
|
|||||
|
 | |
| |
| |
| |
| |
| |
|
Gene: WDR5 |
Gene summary for WDR5 |
| Gene information | Species | Human | Gene symbol | WDR5 | Gene ID | 11091 |
| Gene name | WD repeat domain 5 | |
| Gene Alias | BIG-3 | |
| Cytomap | 9q34.2 | |
| Gene Type | protein-coding | GO ID | GO:0001501 | UniProtAcc | P61964 |
Top |
Malignant transformation analysis |
| Identification of the aberrant gene expression in precancerous and cancerous lesions by comparing the gene expression of stem-like cells in diseased tissues with normal stem cells |
| Entrez ID | Symbol | Replicates | Species | Organ | Tissue | Adj P-value | Log2FC | Malignancy |
| 11091 | WDR5 | HTA11_347_2000001011 | Human | Colorectum | AD | 7.89e-03 | 1.86e-01 | -0.1954 |
| 11091 | WDR5 | HTA11_1391_2000001011 | Human | Colorectum | AD | 8.06e-05 | 3.75e-01 | -0.059 |
| 11091 | WDR5 | HTA11_7862_2000001011 | Human | Colorectum | AD | 5.91e-03 | 3.19e-01 | -0.0179 |
| 11091 | WDR5 | HTA11_866_3004761011 | Human | Colorectum | AD | 2.09e-06 | 3.44e-01 | 0.096 |
| 11091 | WDR5 | HTA11_7696_3000711011 | Human | Colorectum | AD | 3.22e-03 | 2.23e-01 | 0.0674 |
| 11091 | WDR5 | HTA11_99999970781_79442 | Human | Colorectum | MSS | 3.11e-04 | 3.35e-01 | 0.294 |
| 11091 | WDR5 | HTA11_99999965062_69753 | Human | Colorectum | MSI-H | 3.51e-02 | 7.47e-01 | 0.3487 |
| 11091 | WDR5 | HTA11_99999965104_69814 | Human | Colorectum | MSS | 5.05e-09 | 5.25e-01 | 0.281 |
| 11091 | WDR5 | HTA11_99999971662_82457 | Human | Colorectum | MSS | 1.29e-18 | 7.05e-01 | 0.3859 |
| 11091 | WDR5 | HTA11_99999974143_84620 | Human | Colorectum | MSS | 3.89e-07 | 3.73e-01 | 0.3005 |
| 11091 | WDR5 | A015-C-203 | Human | Colorectum | FAP | 3.29e-02 | -7.49e-02 | -0.1294 |
| 11091 | WDR5 | A002-C-116 | Human | Colorectum | FAP | 2.00e-05 | -1.43e-01 | -0.0452 |
| 11091 | WDR5 | LZE4T | Human | Esophagus | ESCC | 1.35e-02 | 6.12e-02 | 0.0811 |
| 11091 | WDR5 | LZE20T | Human | Esophagus | ESCC | 2.89e-04 | 1.70e-01 | 0.0662 |
| 11091 | WDR5 | LZE24T | Human | Esophagus | ESCC | 1.17e-10 | 3.24e-01 | 0.0596 |
| 11091 | WDR5 | LZE21T | Human | Esophagus | ESCC | 2.34e-03 | 3.59e-01 | 0.0655 |
| 11091 | WDR5 | P1T-E | Human | Esophagus | ESCC | 5.88e-04 | 3.33e-01 | 0.0875 |
| 11091 | WDR5 | P2T-E | Human | Esophagus | ESCC | 1.51e-50 | 9.32e-01 | 0.1177 |
| 11091 | WDR5 | P4T-E | Human | Esophagus | ESCC | 3.19e-28 | 6.97e-01 | 0.1323 |
| 11091 | WDR5 | P5T-E | Human | Esophagus | ESCC | 1.57e-30 | 6.36e-01 | 0.1327 |
| Page: 1 2 3 4 5 6 |
| Tissue | Expression Dynamics | Abbreviation |
| Colorectum (GSE201348) |  | FAP: Familial adenomatous polyposis |
| CRC: Colorectal cancer | ||
| Colorectum (HTA11) |  | AD: Adenomas |
| SER: Sessile serrated lesions | ||
| MSI-H: Microsatellite-high colorectal cancer | ||
| MSS: Microsatellite stable colorectal cancer | ||
| Esophagus | 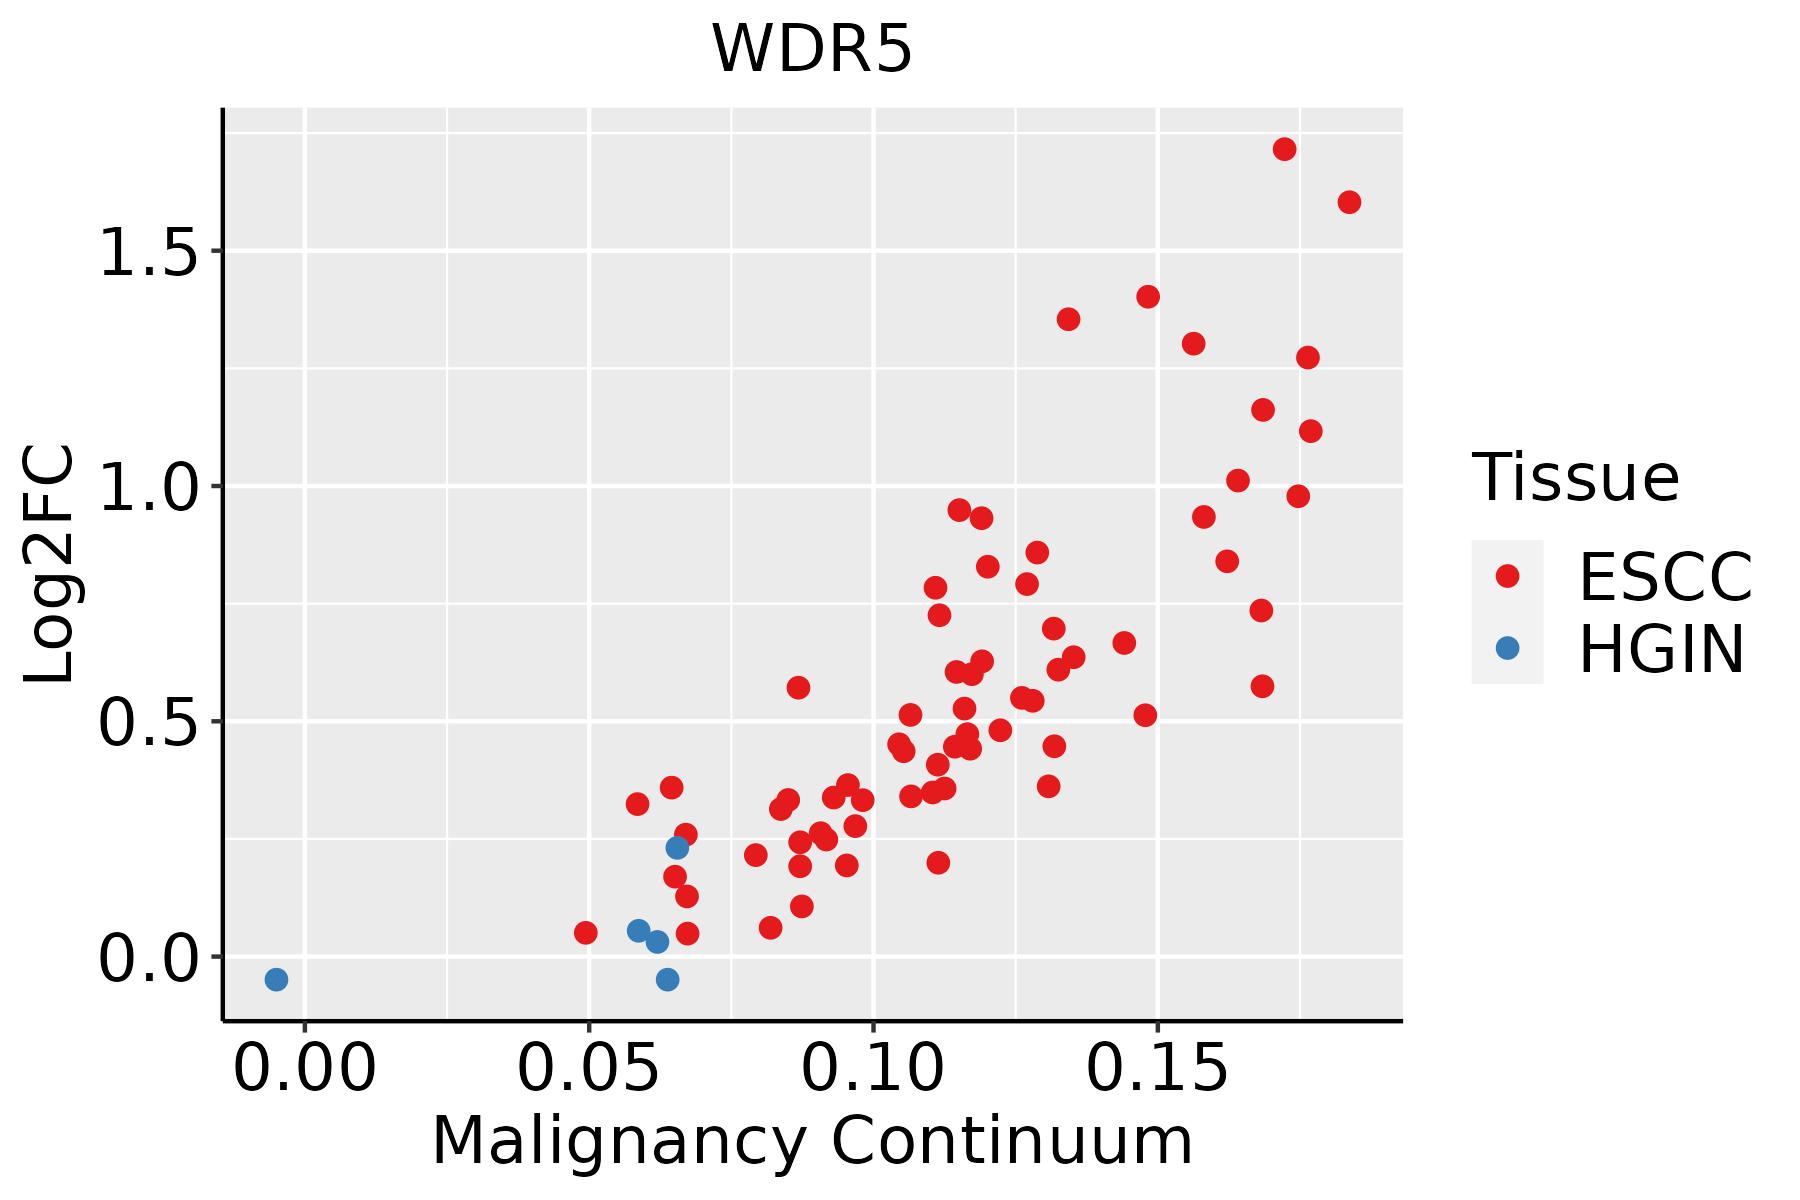 | ESCC: Esophageal squamous cell carcinoma |
| HGIN: High-grade intraepithelial neoplasias | ||
| LGIN: Low-grade intraepithelial neoplasias | ||
| Liver | 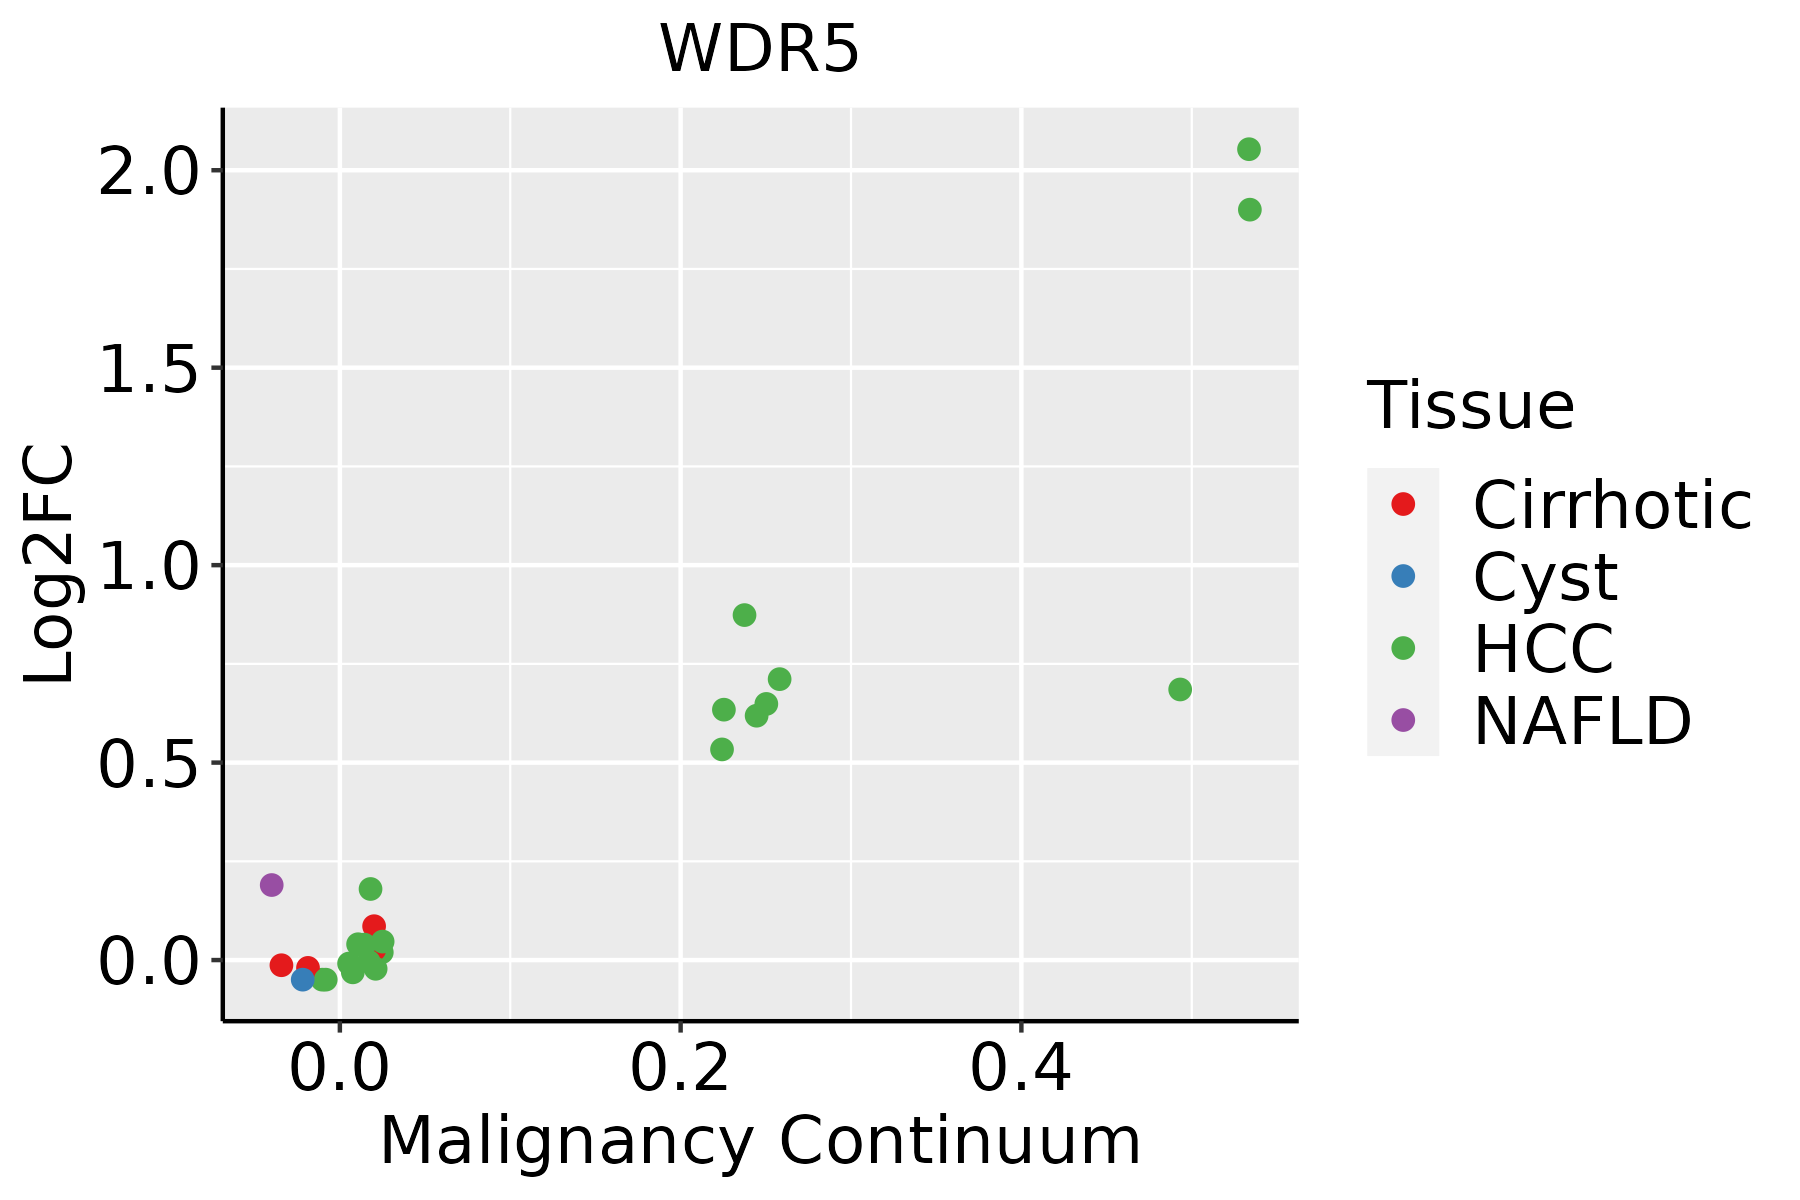 | HCC: Hepatocellular carcinoma |
| NAFLD: Non-alcoholic fatty liver disease | ||
| Oral Cavity | 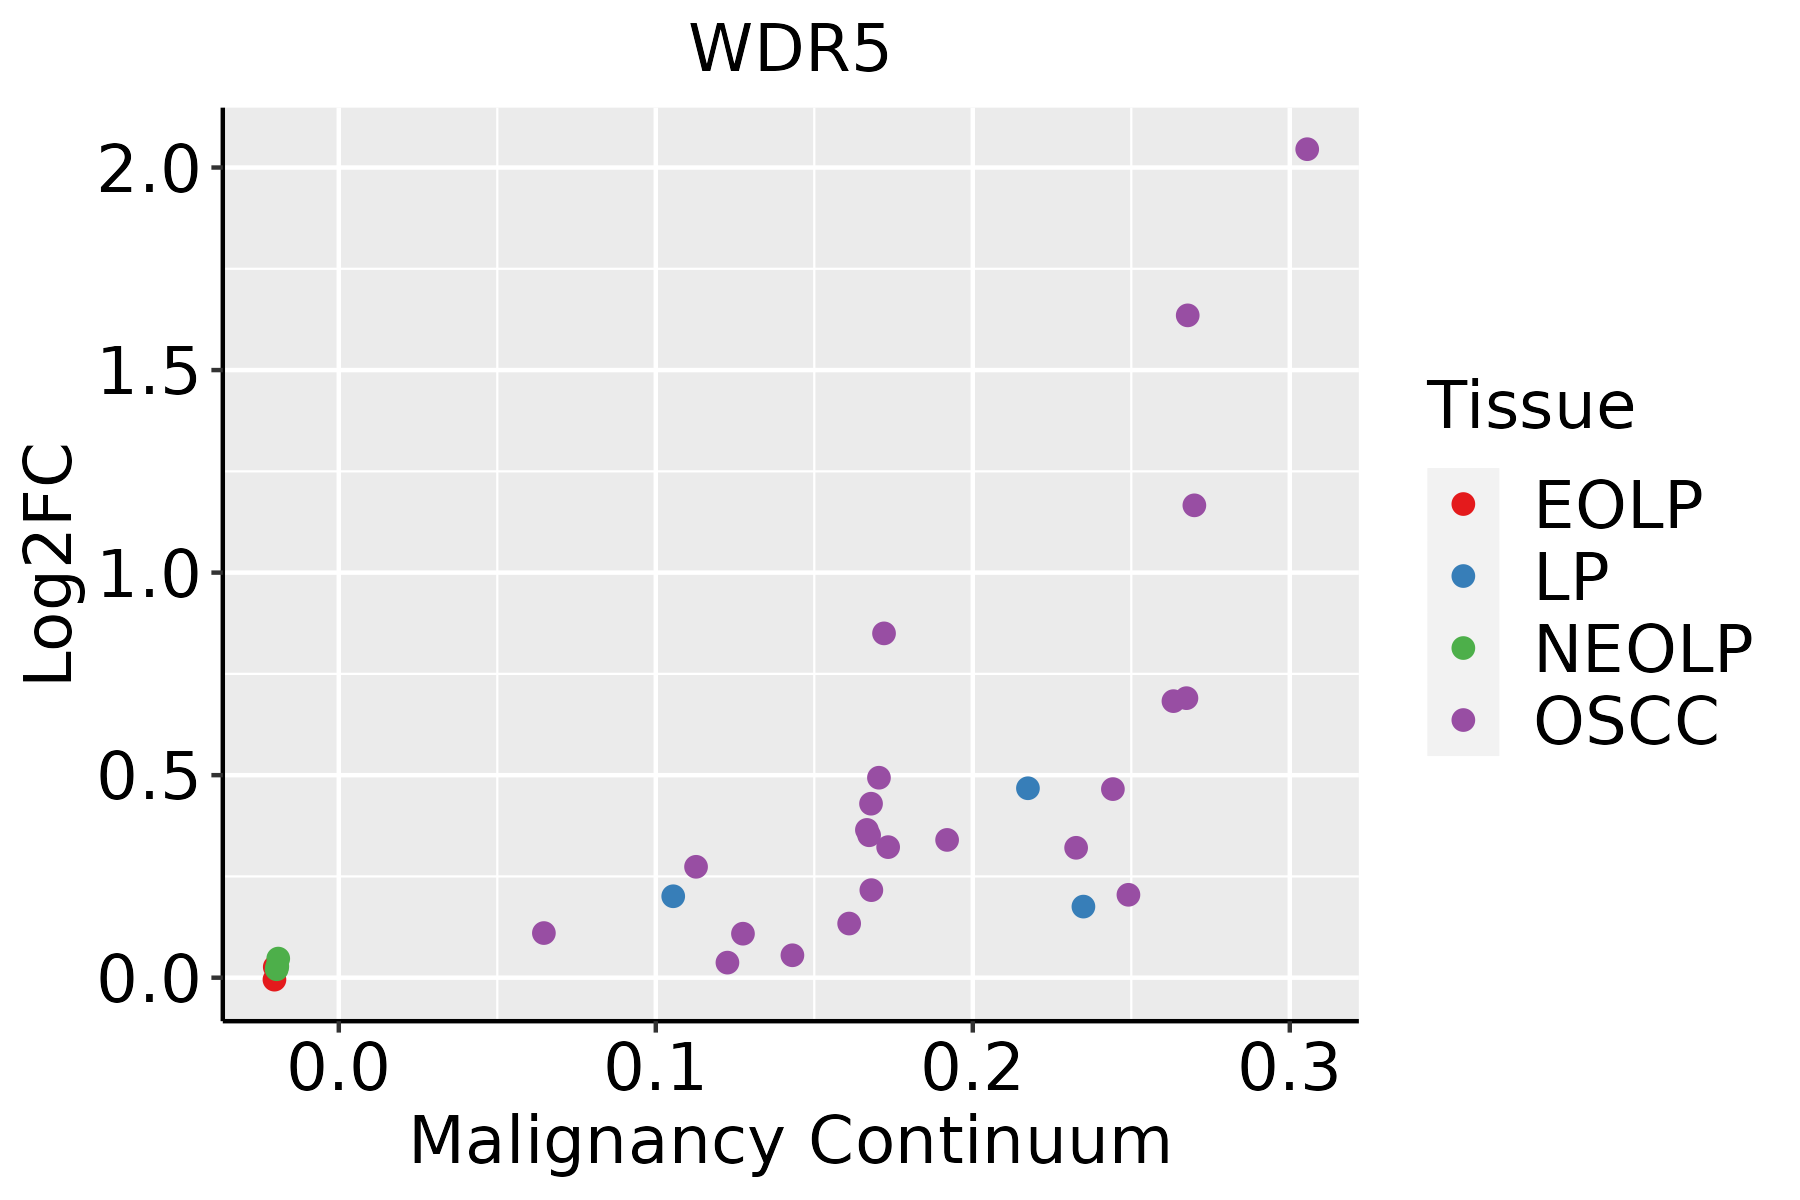 | EOLP: Erosive Oral lichen planus |
| LP: leukoplakia | ||
| NEOLP: Non-erosive oral lichen planus | ||
| OSCC: Oral squamous cell carcinoma | ||
| Skin | 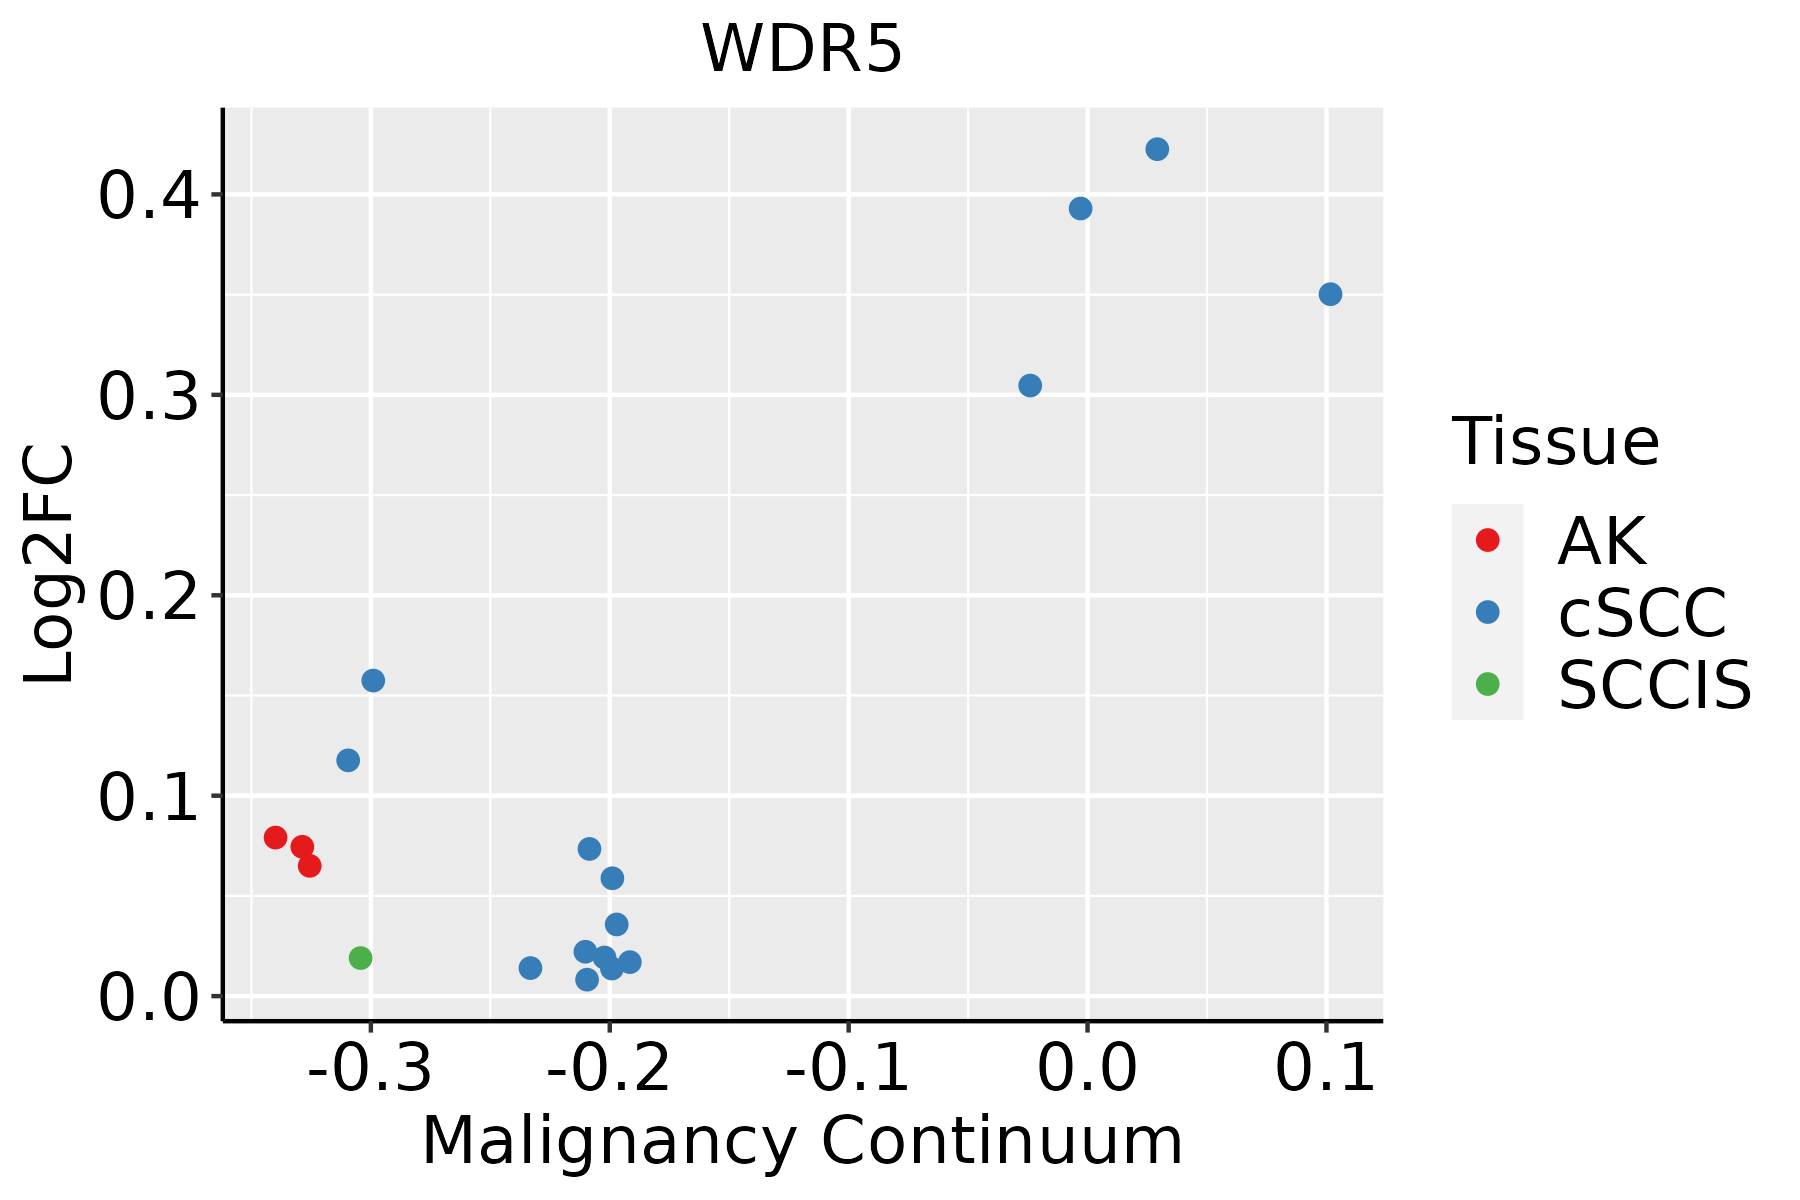 | AK: Actinic keratosis |
| cSCC: Cutaneous squamous cell carcinoma | ||
| SCCIS:squamous cell carcinoma in situ |
| ∗log2FC in expression of this searched gene in stem-like cells from each diseased tissue sample relative to stem-like cells in normal samples in each tissue plotted against the malignancy continuum. Samples are colored based on if they are from different disease stage. |
Top |
Malignant transformation related pathway analysis |
| Find out the enriched GO biological processes and KEGG pathways involved in transition from healthy to precancer to cancer |
| Tissue | Disease Stage | Enriched GO biological Processes |
| Colorectum | AD |  |
| Colorectum | SER |  |
| Colorectum | MSS |  |
| Colorectum | MSI-H |  |
| Colorectum | FAP |  |
| ∗Top 15 enriched GO BP terms are showed in the bar plot of each disease state in each tissue. Each row represents a significant GO biological process which is colored according to the -log10(p.adjust). |
| Page: 1 2 3 4 5 6 7 8 9 |
| GO ID | Tissue | Disease Stage | Description | Gene Ratio | Bg Ratio | pvalue | p.adjust | Count |
| GO:0019318 | Colorectum | AD | hexose metabolic process | 77/3918 | 237/18723 | 1.96e-05 | 4.01e-04 | 77 |
| GO:0044262 | Colorectum | AD | cellular carbohydrate metabolic process | 87/3918 | 283/18723 | 6.00e-05 | 1.01e-03 | 87 |
| GO:0005996 | Colorectum | AD | monosaccharide metabolic process | 80/3918 | 257/18723 | 7.31e-05 | 1.17e-03 | 80 |
| GO:0006006 | Colorectum | AD | glucose metabolic process | 62/3918 | 196/18723 | 2.76e-04 | 3.39e-03 | 62 |
| GO:0006109 | Colorectum | AD | regulation of carbohydrate metabolic process | 55/3918 | 178/18723 | 1.10e-03 | 1.01e-02 | 55 |
| GO:0062012 | Colorectum | AD | regulation of small molecule metabolic process | 93/3918 | 334/18723 | 1.46e-03 | 1.24e-02 | 93 |
| GO:0031056 | Colorectum | AD | regulation of histone modification | 45/3918 | 152/18723 | 7.05e-03 | 4.31e-02 | 45 |
| GO:0016570 | Colorectum | MSS | histone modification | 113/3467 | 463/18723 | 8.37e-04 | 8.68e-03 | 113 |
| GO:00193182 | Colorectum | MSS | hexose metabolic process | 63/3467 | 237/18723 | 1.32e-03 | 1.25e-02 | 63 |
| GO:00620121 | Colorectum | MSS | regulation of small molecule metabolic process | 83/3467 | 334/18723 | 2.25e-03 | 1.85e-02 | 83 |
| GO:00059962 | Colorectum | MSS | monosaccharide metabolic process | 66/3467 | 257/18723 | 2.61e-03 | 2.06e-02 | 66 |
| GO:00060062 | Colorectum | MSS | glucose metabolic process | 51/3467 | 196/18723 | 5.67e-03 | 3.85e-02 | 51 |
| GO:00061091 | Colorectum | MSS | regulation of carbohydrate metabolic process | 47/3467 | 178/18723 | 5.75e-03 | 3.90e-02 | 47 |
| GO:0062013 | Colorectum | MSS | positive regulation of small molecule metabolic process | 39/3467 | 143/18723 | 6.34e-03 | 4.23e-02 | 39 |
| GO:00310562 | Colorectum | MSS | regulation of histone modification | 41/3467 | 152/18723 | 6.41e-03 | 4.27e-02 | 41 |
| GO:00193183 | Colorectum | FAP | hexose metabolic process | 58/2622 | 237/18723 | 1.09e-05 | 3.08e-04 | 58 |
| GO:00442621 | Colorectum | FAP | cellular carbohydrate metabolic process | 66/2622 | 283/18723 | 1.53e-05 | 4.01e-04 | 66 |
| GO:00061092 | Colorectum | FAP | regulation of carbohydrate metabolic process | 46/2622 | 178/18723 | 1.99e-05 | 4.90e-04 | 46 |
| GO:00620122 | Colorectum | FAP | regulation of small molecule metabolic process | 74/2622 | 334/18723 | 3.15e-05 | 7.13e-04 | 74 |
| GO:00060063 | Colorectum | FAP | glucose metabolic process | 48/2622 | 196/18723 | 5.90e-05 | 1.16e-03 | 48 |
| Page: 1 2 3 4 5 6 7 8 9 10 11 12 13 14 15 16 |
| Pathway ID | Tissue | Disease Stage | Description | Gene Ratio | Bg Ratio | pvalue | p.adjust | qvalue | Count |
| Page: 1 |
Top |
Cell-cell communication analysis |
| Identification of potential cell-cell interactions between two cell types and their ligand-receptor pairs for different disease states |
| Ligand | Receptor | LRpair | Pathway | Tissue | Disease Stage |
| Page: 1 |
Top |
Single-cell gene regulatory network inference analysis |
| Find out the significant the regulons (TFs) and the target genes of each regulon across cell types for different disease states |
| TF | Cell Type | Tissue | Disease Stage | Target Gene | RSS | Regulon Activity |
| ∗The dot plots of a searched regulon are shown for all cell subpopulations in each disease state of each tissue based on the regulon specific score inferred using pySCENIC and by calculating the average expression. |
| Page: 1 |
Top |
Somatic mutation of malignant transformation related genes |
| Annotation of somatic variants for genes involved in malignant transformation |
| Hugo Symbol | Variant Class | Variant Classification | dbSNP RS | HGVSc | HGVSp | HGVSp Short | SWISSPROT | BIOTYPE | SIFT | PolyPhen | Tumor Sample Barcode | Tissue | Histology | Sex | Age | Stage | Therapy Types | Drugs | Outcome |
| WDR5 | SNV | Missense_Mutation | rs746477625 | c.949N>A | p.Ala317Thr | p.A317T | P61964 | protein_coding | deleterious(0.03) | possibly_damaging(0.554) | TCGA-2W-A8YY-01 | Cervix | cervical & endocervical cancer | Female | <65 | I/II | Chemotherapy | cisplatin | CR |
| WDR5 | SNV | Missense_Mutation | novel | c.906N>G | p.Asp302Glu | p.D302E | P61964 | protein_coding | deleterious(0.04) | benign(0.058) | TCGA-EA-A410-01 | Cervix | cervical & endocervical cancer | Female | <65 | I/II | Unknown | Unknown | SD |
| WDR5 | SNV | Missense_Mutation | novel | c.221N>T | p.Ala74Val | p.A74V | P61964 | protein_coding | tolerated(0.25) | benign(0.005) | TCGA-A6-5665-01 | Colorectum | colon adenocarcinoma | Female | >=65 | I/II | Unknown | Unknown | PD |
| WDR5 | SNV | Missense_Mutation | c.689N>C | p.Leu230Pro | p.L230P | P61964 | protein_coding | deleterious(0) | probably_damaging(0.999) | TCGA-AA-3811-01 | Colorectum | colon adenocarcinoma | Female | >=65 | III/IV | Unknown | Unknown | PD | |
| WDR5 | SNV | Missense_Mutation | c.874N>C | p.Glu292Gln | p.E292Q | P61964 | protein_coding | tolerated(0.11) | benign(0.267) | TCGA-F4-6809-01 | Colorectum | colon adenocarcinoma | Female | <65 | I/II | Unknown | Unknown | PD | |
| WDR5 | deletion | Frame_Shift_Del | c.642delN | p.Val217CysfsTer4 | p.V217Cfs*4 | P61964 | protein_coding | TCGA-AA-3672-01 | Colorectum | colon adenocarcinoma | Female | >=65 | III/IV | Unknown | Unknown | SD | |||
| WDR5 | insertion | Frame_Shift_Ins | rs780890680 | c.648dupC | p.Val217ArgfsTer42 | p.V217Rfs*42 | P61964 | protein_coding | TCGA-AA-3713-01 | Colorectum | colon adenocarcinoma | Male | >=65 | III/IV | Chemotherapy | 5-fluorouracil | PR | ||
| WDR5 | deletion | Frame_Shift_Del | c.642delN | p.Val217CysfsTer4 | p.V217Cfs*4 | P61964 | protein_coding | TCGA-AD-A5EJ-01 | Colorectum | colon adenocarcinoma | Female | >=65 | I/II | Unknown | Unknown | SD | |||
| WDR5 | deletion | Frame_Shift_Del | c.648delC | p.Val217CysfsTer4 | p.V217Cfs*4 | P61964 | protein_coding | TCGA-AU-6004-01 | Colorectum | colon adenocarcinoma | Female | >=65 | I/II | Unknown | Unknown | SD | |||
| WDR5 | deletion | Frame_Shift_Del | c.642delN | p.Val217CysfsTer4 | p.V217Cfs*4 | P61964 | protein_coding | TCGA-G4-6302-01 | Colorectum | colon adenocarcinoma | Female | >=65 | I/II | Unknown | Unknown | SD |
| Page: 1 2 3 4 5 6 |
Top |
Related drugs of malignant transformation related genes |
| Identification of chemicals and drugs interact with genes involved in malignant transfromation |
| (DGIdb 4.0) |
| Entrez ID | Symbol | Category | Interaction Types | Drug Claim Name | Drug Name | PMIDs |
| 11091 | WDR5 | DRUGGABLE GENOME, TUMOR SUPPRESSOR | antagonist | 249565911 |
| Page: 1 |

Copyright 2023-Present -The University of Texas Health Science Center at Houston |