
|
|||||
|
 | |
| |
| |
| |
| |
| |
|
Gene: WDR48 |
Gene summary for WDR48 |
| Gene information | Species | Human | Gene symbol | WDR48 | Gene ID | 57599 |
| Gene name | WD repeat domain 48 | |
| Gene Alias | Bun62 | |
| Cytomap | 3p22.2 | |
| Gene Type | protein-coding | GO ID | GO:0000003 | UniProtAcc | Q8TAF3 |
Top |
Malignant transformation analysis |
| Identification of the aberrant gene expression in precancerous and cancerous lesions by comparing the gene expression of stem-like cells in diseased tissues with normal stem cells |
| Entrez ID | Symbol | Replicates | Species | Organ | Tissue | Adj P-value | Log2FC | Malignancy |
| 57599 | WDR48 | LZE4T | Human | Esophagus | ESCC | 1.55e-10 | 1.93e-01 | 0.0811 |
| 57599 | WDR48 | LZE7T | Human | Esophagus | ESCC | 1.60e-03 | 1.79e-01 | 0.0667 |
| 57599 | WDR48 | LZE24T | Human | Esophagus | ESCC | 3.94e-15 | 1.98e-01 | 0.0596 |
| 57599 | WDR48 | P1T-E | Human | Esophagus | ESCC | 4.14e-02 | 1.54e-01 | 0.0875 |
| 57599 | WDR48 | P2T-E | Human | Esophagus | ESCC | 4.16e-16 | 2.08e-01 | 0.1177 |
| 57599 | WDR48 | P4T-E | Human | Esophagus | ESCC | 1.31e-11 | 2.35e-01 | 0.1323 |
| 57599 | WDR48 | P8T-E | Human | Esophagus | ESCC | 1.96e-14 | 1.84e-01 | 0.0889 |
| 57599 | WDR48 | P9T-E | Human | Esophagus | ESCC | 8.30e-09 | 1.40e-01 | 0.1131 |
| 57599 | WDR48 | P10T-E | Human | Esophagus | ESCC | 6.81e-10 | 1.37e-01 | 0.116 |
| 57599 | WDR48 | P11T-E | Human | Esophagus | ESCC | 6.44e-08 | 2.21e-01 | 0.1426 |
| 57599 | WDR48 | P12T-E | Human | Esophagus | ESCC | 8.61e-15 | 3.20e-01 | 0.1122 |
| 57599 | WDR48 | P15T-E | Human | Esophagus | ESCC | 4.18e-06 | 1.05e-01 | 0.1149 |
| 57599 | WDR48 | P16T-E | Human | Esophagus | ESCC | 4.43e-17 | 2.67e-01 | 0.1153 |
| 57599 | WDR48 | P17T-E | Human | Esophagus | ESCC | 3.33e-03 | 1.66e-01 | 0.1278 |
| 57599 | WDR48 | P19T-E | Human | Esophagus | ESCC | 4.60e-02 | 2.58e-01 | 0.1662 |
| 57599 | WDR48 | P20T-E | Human | Esophagus | ESCC | 9.94e-09 | 1.15e-01 | 0.1124 |
| 57599 | WDR48 | P21T-E | Human | Esophagus | ESCC | 3.90e-21 | 1.24e-01 | 0.1617 |
| 57599 | WDR48 | P22T-E | Human | Esophagus | ESCC | 1.88e-09 | 1.30e-01 | 0.1236 |
| 57599 | WDR48 | P23T-E | Human | Esophagus | ESCC | 5.70e-14 | 3.26e-01 | 0.108 |
| 57599 | WDR48 | P24T-E | Human | Esophagus | ESCC | 1.97e-09 | 1.97e-01 | 0.1287 |
| Page: 1 2 3 4 |
| Tissue | Expression Dynamics | Abbreviation |
| Esophagus |  | ESCC: Esophageal squamous cell carcinoma |
| HGIN: High-grade intraepithelial neoplasias | ||
| LGIN: Low-grade intraepithelial neoplasias | ||
| Liver | 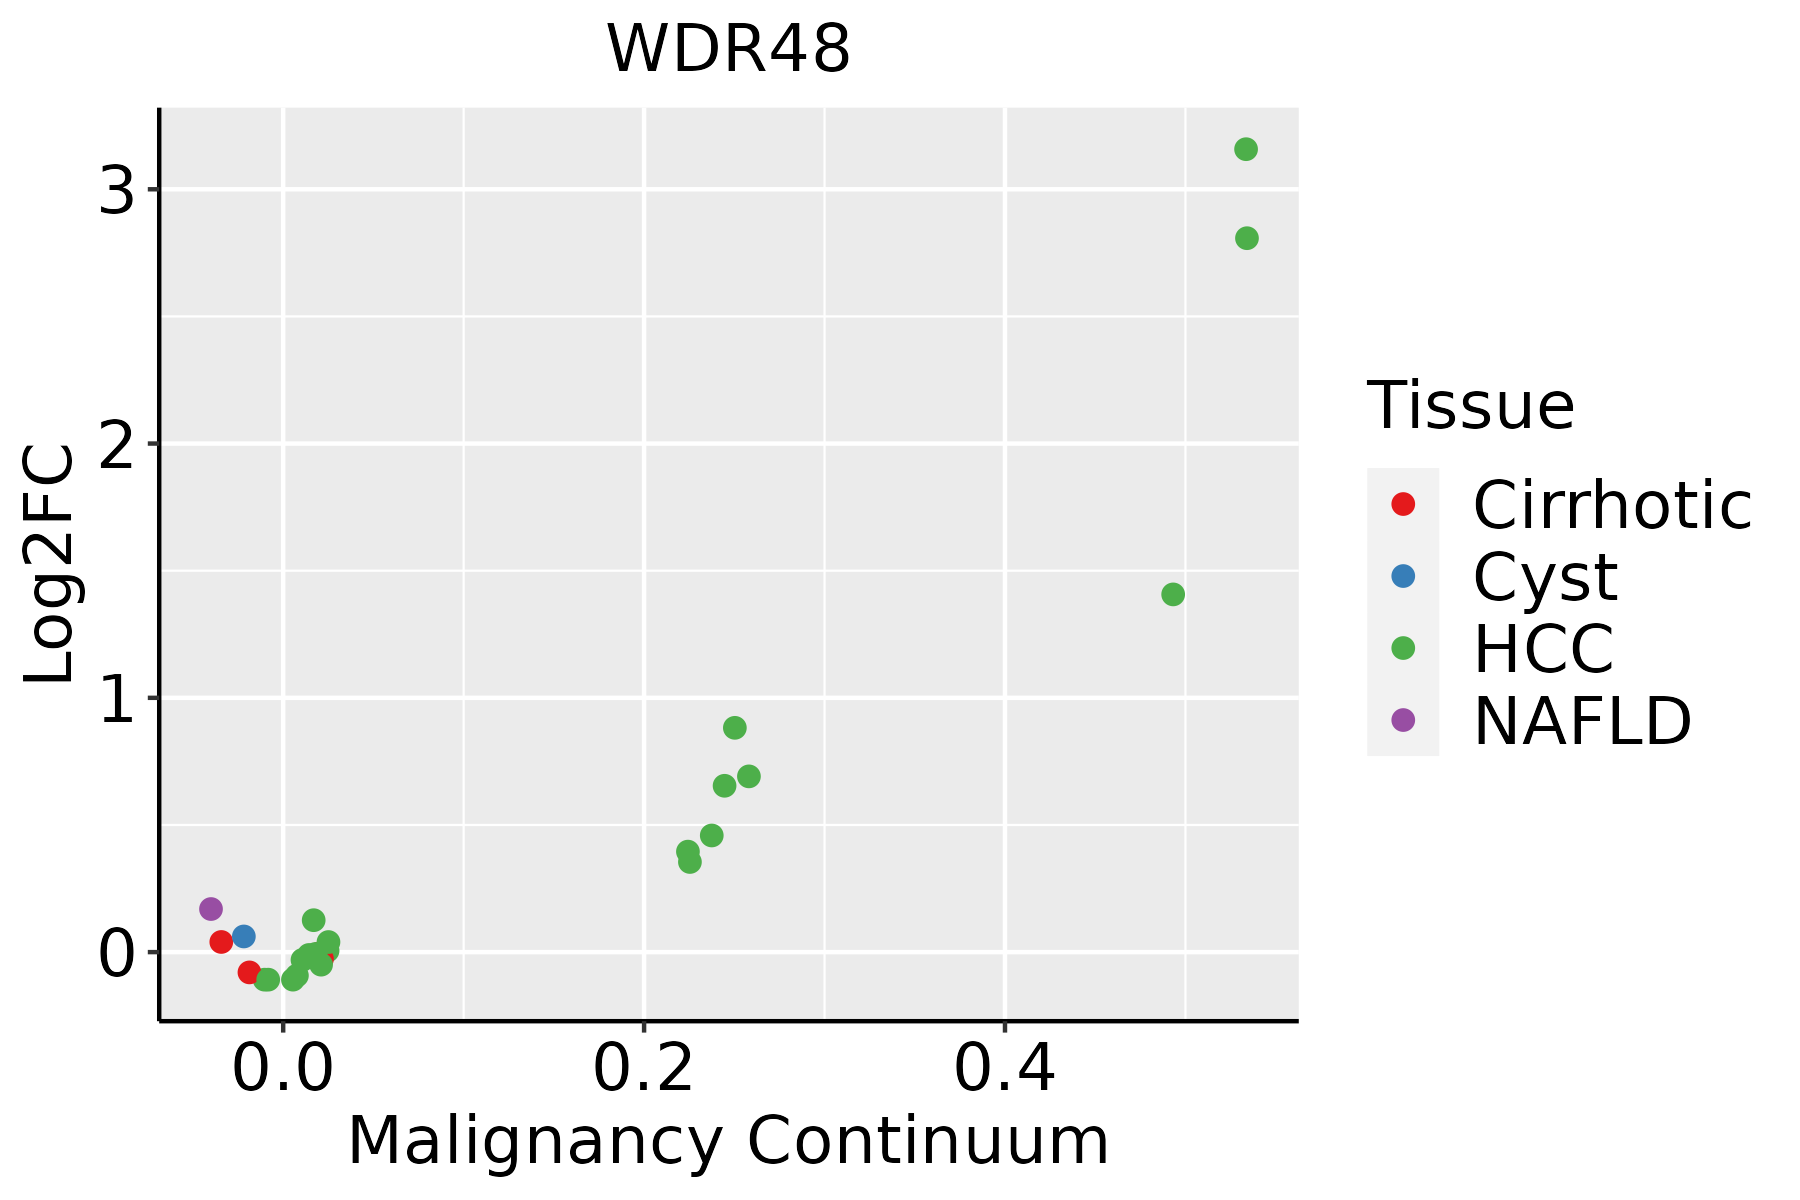 | HCC: Hepatocellular carcinoma |
| NAFLD: Non-alcoholic fatty liver disease | ||
| Thyroid | 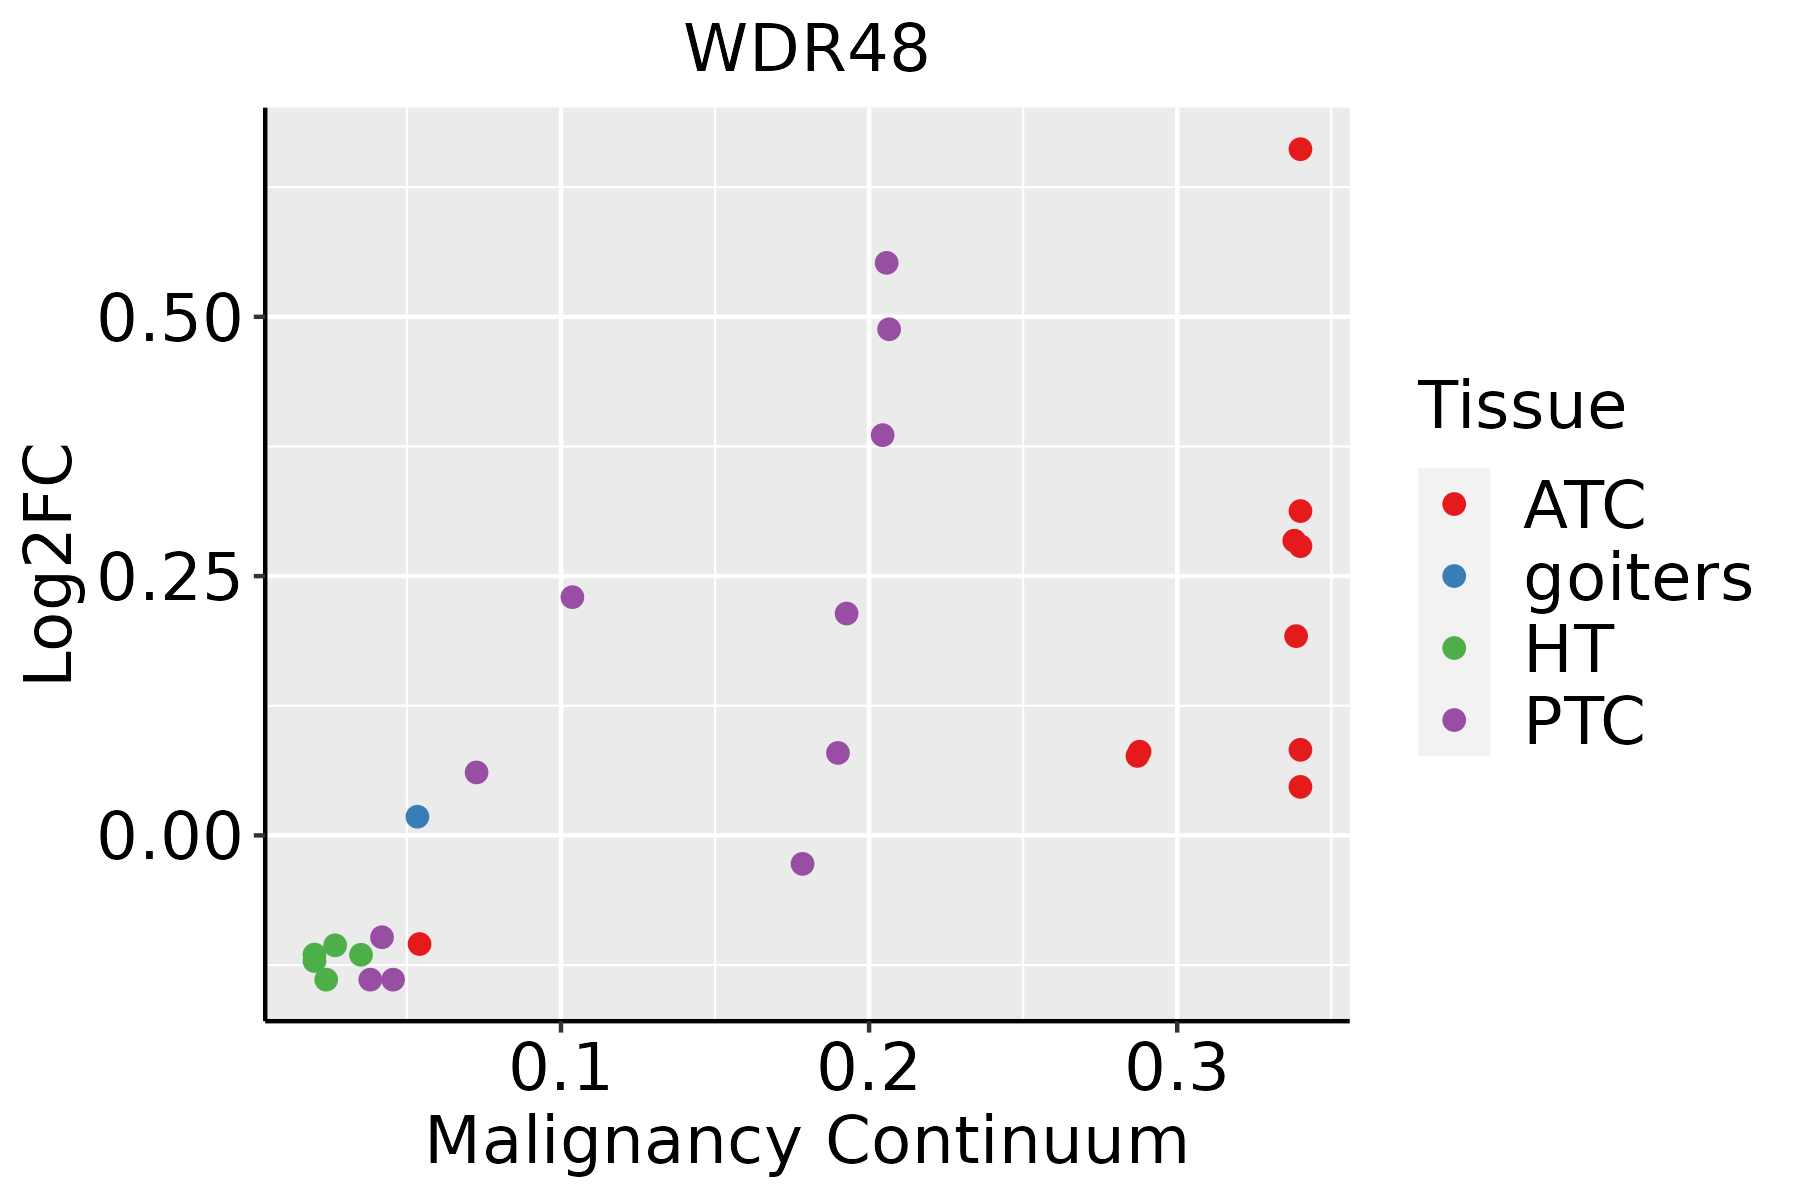 | ATC: Anaplastic thyroid cancer |
| HT: Hashimoto's thyroiditis | ||
| PTC: Papillary thyroid cancer |
| ∗log2FC in expression of this searched gene in stem-like cells from each diseased tissue sample relative to stem-like cells in normal samples in each tissue plotted against the malignancy continuum. Samples are colored based on if they are from different disease stage. |
Top |
Malignant transformation related pathway analysis |
| Find out the enriched GO biological processes and KEGG pathways involved in transition from healthy to precancer to cancer |
| Tissue | Disease Stage | Enriched GO biological Processes |
| Colorectum | AD |  |
| Colorectum | SER |  |
| Colorectum | MSS |  |
| Colorectum | MSI-H |  |
| Colorectum | FAP |  |
| ∗Top 15 enriched GO BP terms are showed in the bar plot of each disease state in each tissue. Each row represents a significant GO biological process which is colored according to the -log10(p.adjust). |
| Page: 1 2 3 4 5 6 7 8 9 |
| GO ID | Tissue | Disease Stage | Description | Gene Ratio | Bg Ratio | pvalue | p.adjust | Count |
| GO:1903320111 | Esophagus | ESCC | regulation of protein modification by small protein conjugation or removal | 181/8552 | 242/18723 | 1.80e-20 | 2.60e-18 | 181 |
| GO:0045862111 | Esophagus | ESCC | positive regulation of proteolysis | 256/8552 | 372/18723 | 7.88e-20 | 9.43e-18 | 256 |
| GO:0031396111 | Esophagus | ESCC | regulation of protein ubiquitination | 154/8552 | 210/18723 | 2.70e-16 | 2.04e-14 | 154 |
| GO:005105215 | Esophagus | ESCC | regulation of DNA metabolic process | 232/8552 | 359/18723 | 2.40e-13 | 1.13e-11 | 232 |
| GO:005105417 | Esophagus | ESCC | positive regulation of DNA metabolic process | 139/8552 | 201/18723 | 1.20e-11 | 4.33e-10 | 139 |
| GO:190332216 | Esophagus | ESCC | positive regulation of protein modification by small protein conjugation or removal | 99/8552 | 138/18723 | 4.39e-10 | 1.16e-08 | 99 |
| GO:2001020110 | Esophagus | ESCC | regulation of response to DNA damage stimulus | 145/8552 | 219/18723 | 5.97e-10 | 1.50e-08 | 145 |
| GO:00065136 | Esophagus | ESCC | protein monoubiquitination | 53/8552 | 67/18723 | 2.11e-08 | 4.03e-07 | 53 |
| GO:00435888 | Esophagus | ESCC | skin development | 163/8552 | 263/18723 | 6.48e-08 | 1.14e-06 | 163 |
| GO:0061458110 | Esophagus | ESCC | reproductive system development | 247/8552 | 427/18723 | 2.24e-07 | 3.42e-06 | 247 |
| GO:004860818 | Esophagus | ESCC | reproductive structure development | 245/8552 | 424/18723 | 2.82e-07 | 4.14e-06 | 245 |
| GO:00063024 | Esophagus | ESCC | double-strand break repair | 152/8552 | 251/18723 | 1.33e-06 | 1.62e-05 | 152 |
| GO:0048872111 | Esophagus | ESCC | homeostasis of number of cells | 163/8552 | 272/18723 | 1.40e-06 | 1.69e-05 | 163 |
| GO:20010228 | Esophagus | ESCC | positive regulation of response to DNA damage stimulus | 69/8552 | 105/18723 | 2.66e-05 | 2.22e-04 | 69 |
| GO:00062826 | Esophagus | ESCC | regulation of DNA repair | 82/8552 | 130/18723 | 4.65e-05 | 3.66e-04 | 82 |
| GO:005067318 | Esophagus | ESCC | epithelial cell proliferation | 238/8552 | 437/18723 | 1.19e-04 | 8.20e-04 | 238 |
| GO:007064612 | Esophagus | ESCC | protein modification by small protein removal | 95/8552 | 157/18723 | 1.25e-04 | 8.56e-04 | 95 |
| GO:00457395 | Esophagus | ESCC | positive regulation of DNA repair | 49/8552 | 73/18723 | 1.74e-04 | 1.14e-03 | 49 |
| GO:00352647 | Esophagus | ESCC | multicellular organism growth | 80/8552 | 132/18723 | 3.84e-04 | 2.22e-03 | 80 |
| GO:005067817 | Esophagus | ESCC | regulation of epithelial cell proliferation | 206/8552 | 381/18723 | 5.51e-04 | 3.02e-03 | 206 |
| Page: 1 2 3 4 5 |
| Pathway ID | Tissue | Disease Stage | Description | Gene Ratio | Bg Ratio | pvalue | p.adjust | qvalue | Count |
| Page: 1 |
Top |
Cell-cell communication analysis |
| Identification of potential cell-cell interactions between two cell types and their ligand-receptor pairs for different disease states |
| Ligand | Receptor | LRpair | Pathway | Tissue | Disease Stage |
| Page: 1 |
Top |
Single-cell gene regulatory network inference analysis |
| Find out the significant the regulons (TFs) and the target genes of each regulon across cell types for different disease states |
| TF | Cell Type | Tissue | Disease Stage | Target Gene | RSS | Regulon Activity |
| ∗The dot plots of a searched regulon are shown for all cell subpopulations in each disease state of each tissue based on the regulon specific score inferred using pySCENIC and by calculating the average expression. |
| Page: 1 |
Top |
Somatic mutation of malignant transformation related genes |
| Annotation of somatic variants for genes involved in malignant transformation |
| Hugo Symbol | Variant Class | Variant Classification | dbSNP RS | HGVSc | HGVSp | HGVSp Short | SWISSPROT | BIOTYPE | SIFT | PolyPhen | Tumor Sample Barcode | Tissue | Histology | Sex | Age | Stage | Therapy Types | Drugs | Outcome |
| WDR48 | SNV | Missense_Mutation | c.15N>G | p.His5Gln | p.H5Q | Q8TAF3 | protein_coding | tolerated(0.15) | benign(0.08) | TCGA-A8-A097-01 | Breast | breast invasive carcinoma | Female | >=65 | I/II | Hormone Therapy | tamoxiphen | SD | |
| WDR48 | SNV | Missense_Mutation | rs774504800 | c.934N>G | p.Ile312Val | p.I312V | Q8TAF3 | protein_coding | tolerated(0.24) | benign(0.021) | TCGA-AO-A0J6-01 | Breast | breast invasive carcinoma | Female | <65 | I/II | Chemotherapy | doxorubicin | SD |
| WDR48 | SNV | Missense_Mutation | rs765064556 | c.2017N>T | p.Arg673Cys | p.R673C | Q8TAF3 | protein_coding | deleterious(0) | probably_damaging(0.975) | TCGA-BH-A0BC-01 | Breast | breast invasive carcinoma | Female | <65 | III/IV | Chemotherapy | doxorubicin | SD |
| WDR48 | insertion | In_Frame_Ins | novel | c.345_346insAAAAGAGGTATT | p.Thr115_His116insLysArgGlyIle | p.T115_H116insKRGI | Q8TAF3 | protein_coding | TCGA-AR-A0TU-01 | Breast | breast invasive carcinoma | Female | <65 | I/II | Unspecific | Doxorubicin | SD | ||
| WDR48 | SNV | Missense_Mutation | novel | c.1529C>T | p.Pro510Leu | p.P510L | Q8TAF3 | protein_coding | deleterious(0) | probably_damaging(0.99) | TCGA-2W-A8YY-01 | Cervix | cervical & endocervical cancer | Female | <65 | I/II | Chemotherapy | cisplatin | CR |
| WDR48 | SNV | Missense_Mutation | c.1210N>A | p.Glu404Lys | p.E404K | Q8TAF3 | protein_coding | deleterious(0.01) | possibly_damaging(0.513) | TCGA-C5-A1MH-01 | Cervix | cervical & endocervical cancer | Female | >=65 | III/IV | Chemotherapy | cisplatin | PD | |
| WDR48 | SNV | Missense_Mutation | c.784N>A | p.Asp262Asn | p.D262N | Q8TAF3 | protein_coding | tolerated(0.07) | benign(0.213) | TCGA-IR-A3LL-01 | Cervix | cervical & endocervical cancer | Female | <65 | I/II | Chemotherapy | cisplatin | CR | |
| WDR48 | SNV | Missense_Mutation | c.83N>G | p.Tyr28Cys | p.Y28C | Q8TAF3 | protein_coding | tolerated(0.18) | benign(0.006) | TCGA-A6-6652-01 | Colorectum | colon adenocarcinoma | Male | <65 | I/II | Targeted Molecular therapy | cetuximab | SD | |
| WDR48 | SNV | Missense_Mutation | novel | c.1310N>G | p.Asp437Gly | p.D437G | Q8TAF3 | protein_coding | deleterious(0) | probably_damaging(0.992) | TCGA-AA-3811-01 | Colorectum | colon adenocarcinoma | Female | >=65 | III/IV | Unknown | Unknown | PD |
| WDR48 | SNV | Missense_Mutation | novel | c.1503N>T | p.Gln501His | p.Q501H | Q8TAF3 | protein_coding | tolerated(0.21) | benign(0.09) | TCGA-AA-A01D-01 | Colorectum | colon adenocarcinoma | Female | <65 | III/IV | Chemotherapy | capecitabine | PD |
| Page: 1 2 3 4 5 6 7 |
Top |
Related drugs of malignant transformation related genes |
| Identification of chemicals and drugs interact with genes involved in malignant transfromation |
| (DGIdb 4.0) |
| Entrez ID | Symbol | Category | Interaction Types | Drug Claim Name | Drug Name | PMIDs |
| Page: 1 |

Copyright 2023-Present -The University of Texas Health Science Center at Houston |