Schematic overview of the cellular and molecular mechanisms involved in the cancer progression, including the proposed cellular and molecular mechanisms in cancer cells trajectory. AT1: alveolar type 1 cells; AT2: alveolar type 2 cells; AAH: atypical adenomatous hyperplasia; AIS: adenocarcinoma in situ; MIA: minimally invasive adenocarcinoma; IA: invasive adenocarcinoma; EMT: epithelial-mesenchymal transition

Home

Download

Statistics

Help

Contact

Center for Computational Systems Medicine
leaf

Gene summary

leaf

Malignant transformation analysis

leaf

Malignant transformation related pathway analysis

leaf

Cell-cell communication analysis

leaf

Single-cell gene regulatory network inference analysis

leaf

Somatic mutation of malignant transformation related genes

leaf

Related drugs of malignant transformation related genes

Gene: WDR45B

Gene summary for WDR45B

check button Gene summary.

Gene informationSpeciesHuman
Gene symbol

WDR45B

Gene ID

56270

Gene nameWD repeat domain 45B
Gene AliasNEDSBAS
Cytomap17q25.3
Gene Typeprotein-coding
GO ID

GO:0000045

UniProtAcc

A0A024R8U4


Top

Malignant transformation analysis

check button Identification of the aberrant gene expression in precancerous and cancerous lesions by comparing the gene expression of stem-like cells in diseased tissues with normal stem cells
check button Malignant transformation involving gene list.
Entrez IDSymbolReplicatesSpeciesOrganTissueAdj P-valueLog2FCMalignancy
56270WDR45BGSM4909282HumanBreastIDC2.26e-074.22e-01-0.0288
56270WDR45BGSM4909293HumanBreastIDC1.96e-042.79e-010.1581
56270WDR45BGSM4909294HumanBreastIDC4.04e-03-1.93e-010.2022
56270WDR45BGSM4909296HumanBreastIDC6.07e-15-3.46e-010.1524
56270WDR45BGSM4909297HumanBreastIDC1.18e-12-2.87e-010.1517
56270WDR45BGSM4909309HumanBreastIDC1.90e-02-2.08e-010.0483
56270WDR45BGSM4909311HumanBreastIDC7.33e-25-3.30e-010.1534
56270WDR45BGSM4909312HumanBreastIDC3.77e-13-2.24e-010.1552
56270WDR45BGSM4909319HumanBreastIDC6.62e-29-2.86e-010.1563
56270WDR45BGSM4909320HumanBreastIDC4.19e-092.37e-010.1575
56270WDR45BGSM4909321HumanBreastIDC4.94e-10-5.86e-020.1559
56270WDR45Bctrl6HumanBreastPrecancer1.30e-055.05e-01-0.0061
56270WDR45Bbrca3HumanBreastPrecancer6.01e-033.23e-01-0.0263
56270WDR45BNCCBC14HumanBreastDCIS4.77e-06-1.96e-010.2021
56270WDR45BNCCBC3HumanBreastDCIS3.93e-05-2.06e-010.1198
56270WDR45BNCCBC5HumanBreastDCIS1.28e-11-1.61e-010.2046
56270WDR45BP1HumanBreastIDC4.96e-17-2.97e-010.1527
56270WDR45BP2HumanBreastIDC8.96e-094.39e-010.21
56270WDR45BDCIS2HumanBreastDCIS8.48e-461.45e-010.0085
56270WDR45BLZE2THumanEsophagusESCC2.23e-034.72e-010.082
Page: 1 2 3 4 5 6 7 8 

check button Transcriptomic changes along malignancy continuum.
TissueExpression DynamicsAbbreviation
BreastThe image shows the transcriptomic changes along malignancy continuum.log2FC in expression of this searched gene in stem-like cells from each diseased tissue sample relative to stem-like cells in normal samples in each tissue plotted against the malignancy continuum. Samples are colored based on if they are from different disease stage.IDC: Invasive ductal carcinoma
DCIS: Ductal carcinoma in situ
Precancer(BRCA1-mut): Precancerous lesion from BRCA1 mutation carriers
EsophagusThe image shows the transcriptomic changes along malignancy continuum.log2FC in expression of this searched gene in stem-like cells from each diseased tissue sample relative to stem-like cells in normal samples in each tissue plotted against the malignancy continuum. Samples are colored based on if they are from different disease stage.ESCC: Esophageal squamous cell carcinoma
HGIN: High-grade intraepithelial neoplasias
LGIN: Low-grade intraepithelial neoplasias
LiverThe image shows the transcriptomic changes along malignancy continuum.log2FC in expression of this searched gene in stem-like cells from each diseased tissue sample relative to stem-like cells in normal samples in each tissue plotted against the malignancy continuum. Samples are colored based on if they are from different disease stage.HCC: Hepatocellular carcinoma
NAFLD: Non-alcoholic fatty liver disease
Oral CavityThe image shows the transcriptomic changes along malignancy continuum.log2FC in expression of this searched gene in stem-like cells from each diseased tissue sample relative to stem-like cells in normal samples in each tissue plotted against the malignancy continuum. Samples are colored based on if they are from different disease stage.
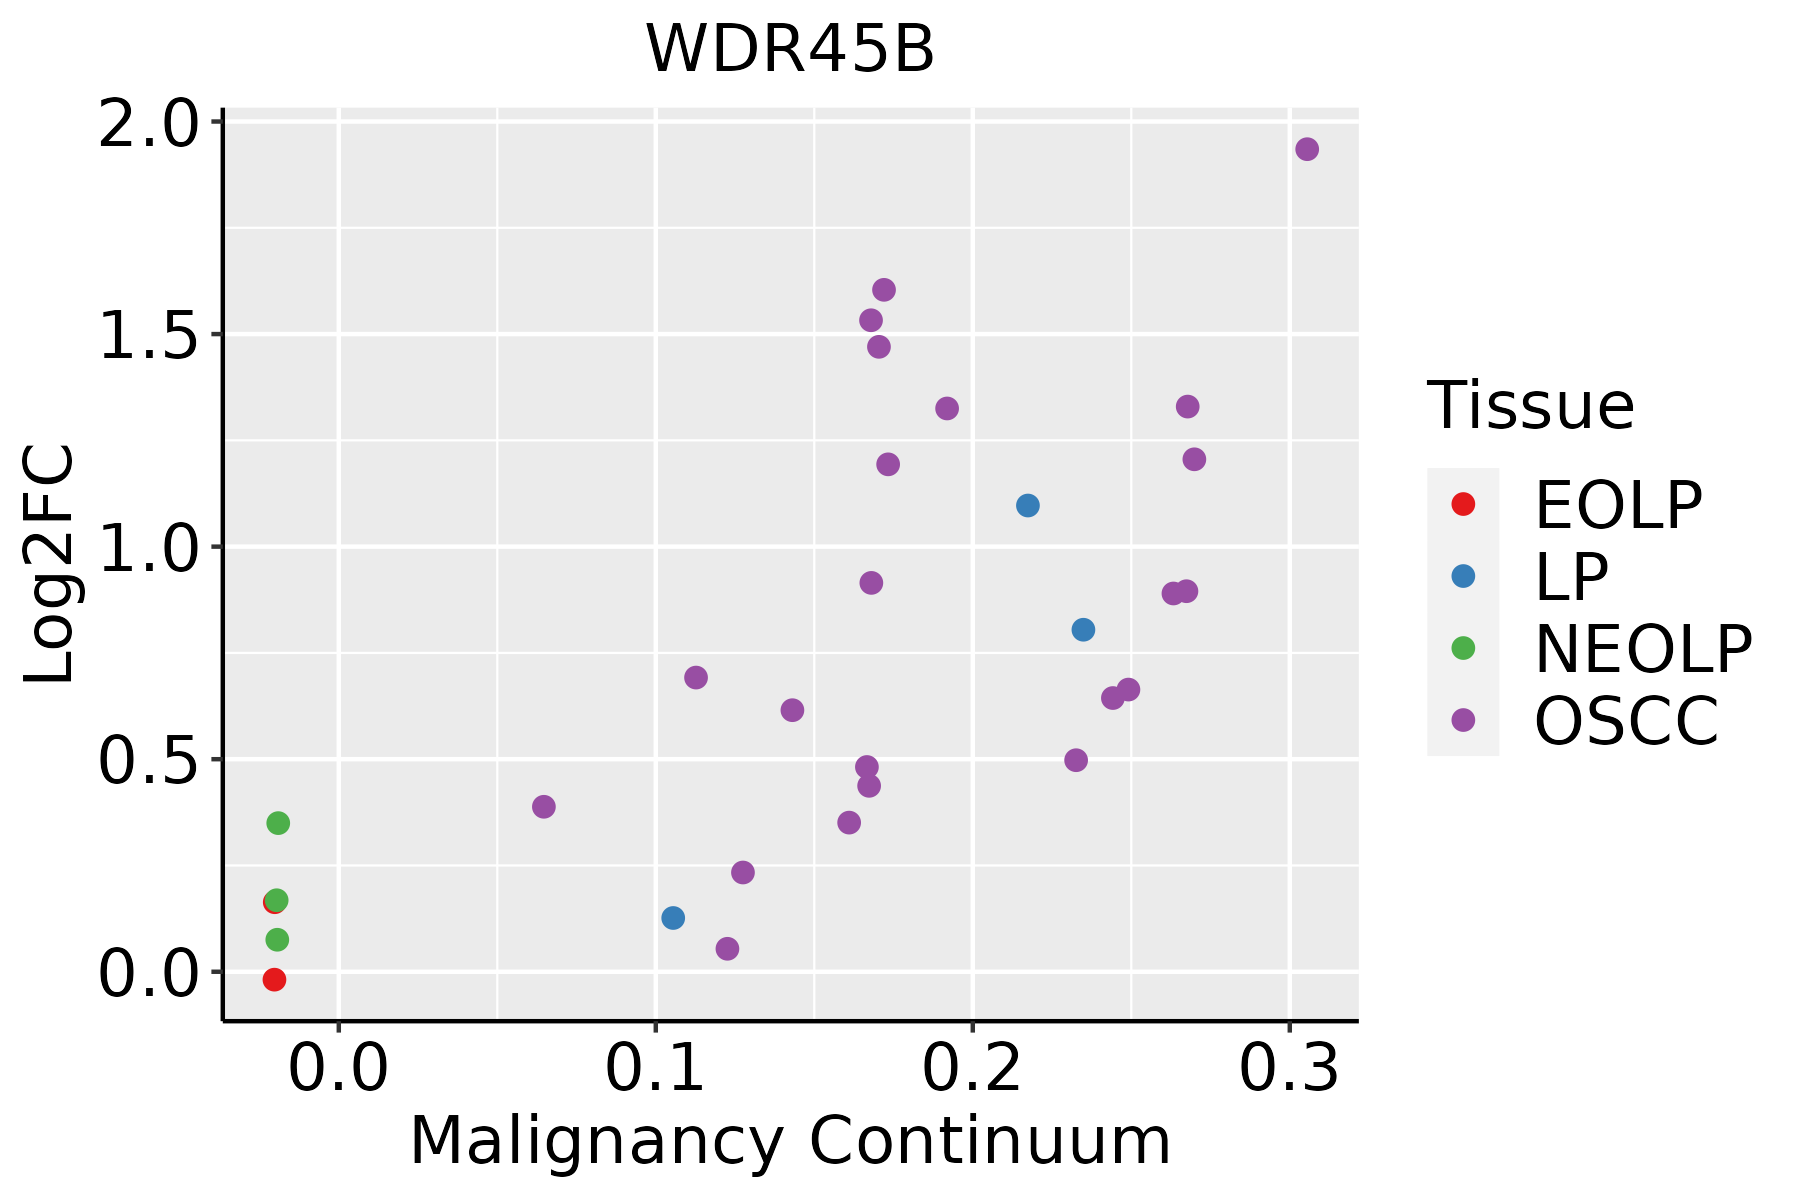
EOLP: Erosive Oral lichen planus
LP: leukoplakia
NEOLP: Non-erosive oral lichen planus
OSCC: Oral squamous cell carcinoma
ProstateThe image shows the transcriptomic changes along malignancy continuum.log2FC in expression of this searched gene in stem-like cells from each diseased tissue sample relative to stem-like cells in normal samples in each tissue plotted against the malignancy continuum. Samples are colored based on if they are from different disease stage.
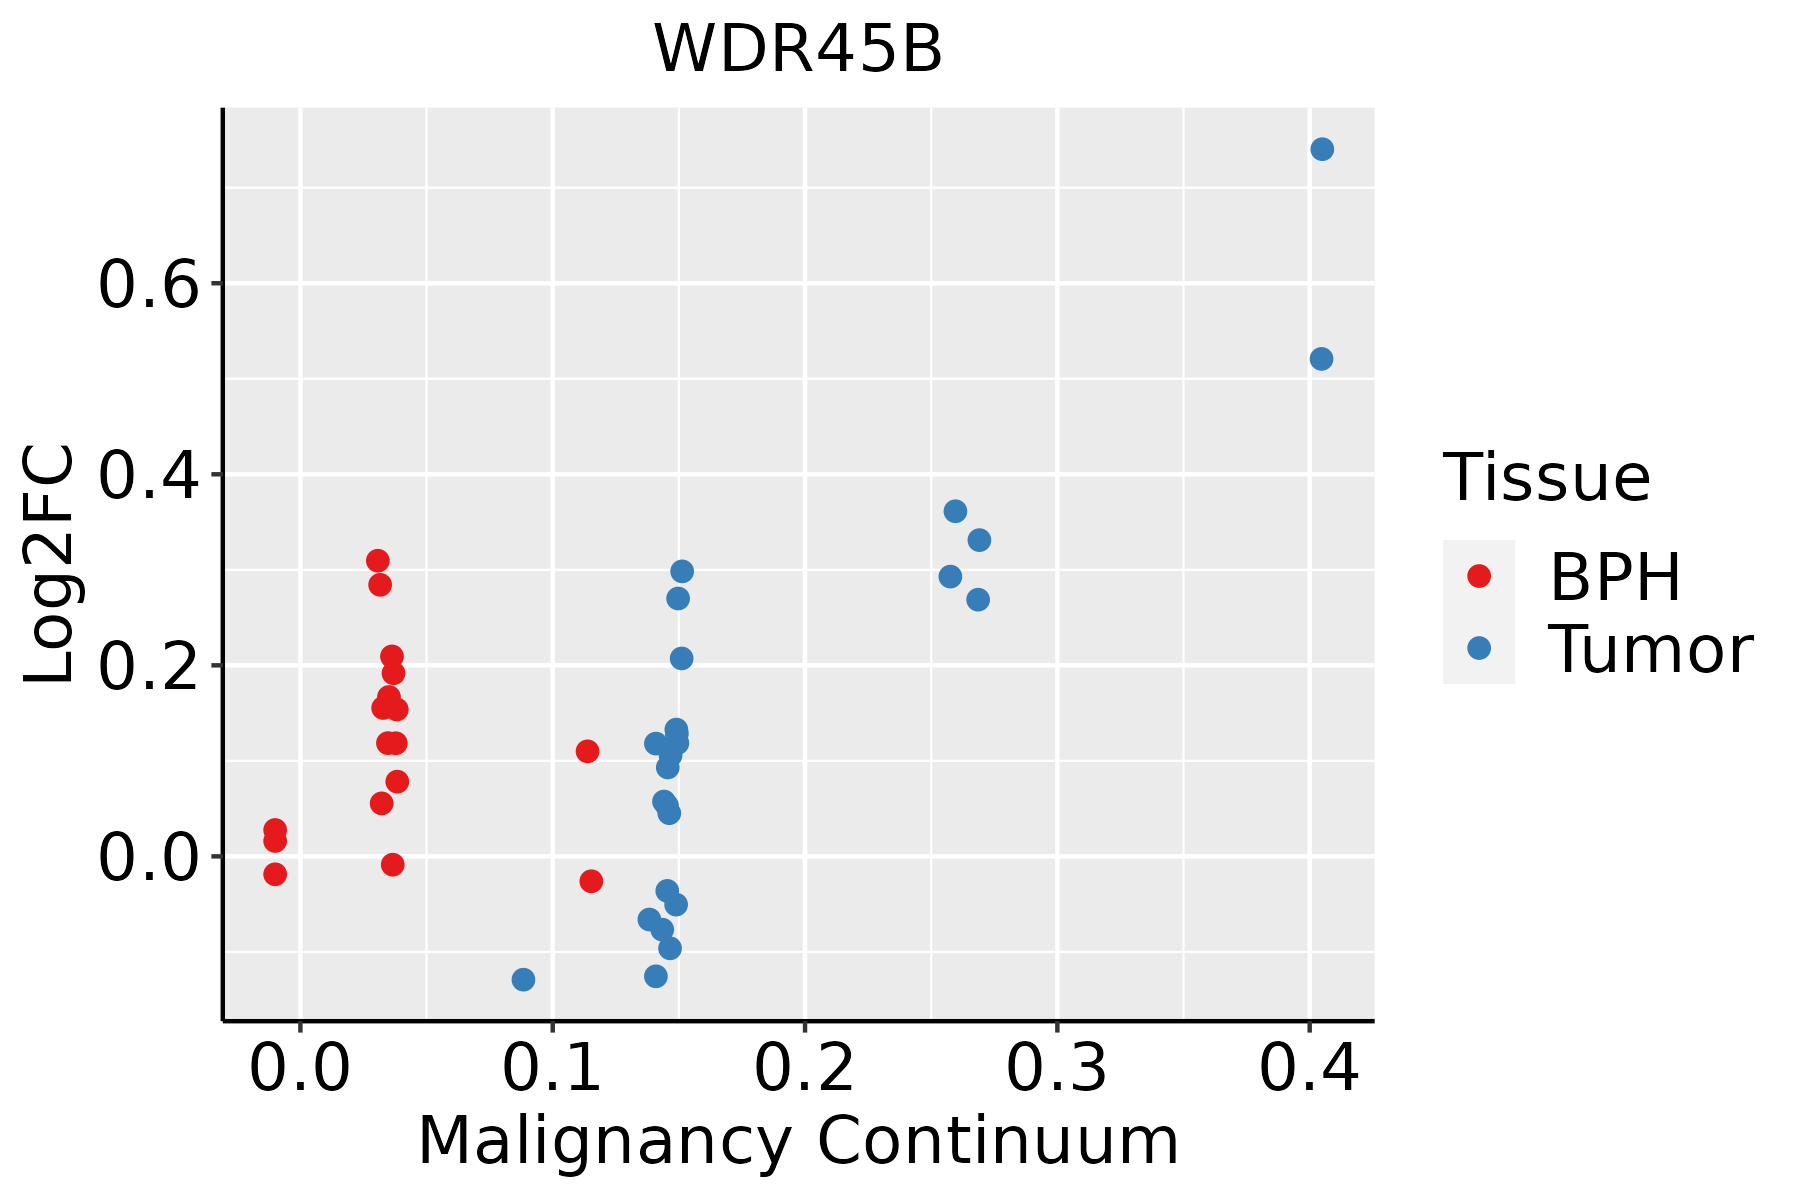
BPH: Benign Prostatic Hyperplasia
SkinThe image shows the transcriptomic changes along malignancy continuum.log2FC in expression of this searched gene in stem-like cells from each diseased tissue sample relative to stem-like cells in normal samples in each tissue plotted against the malignancy continuum. Samples are colored based on if they are from different disease stage.
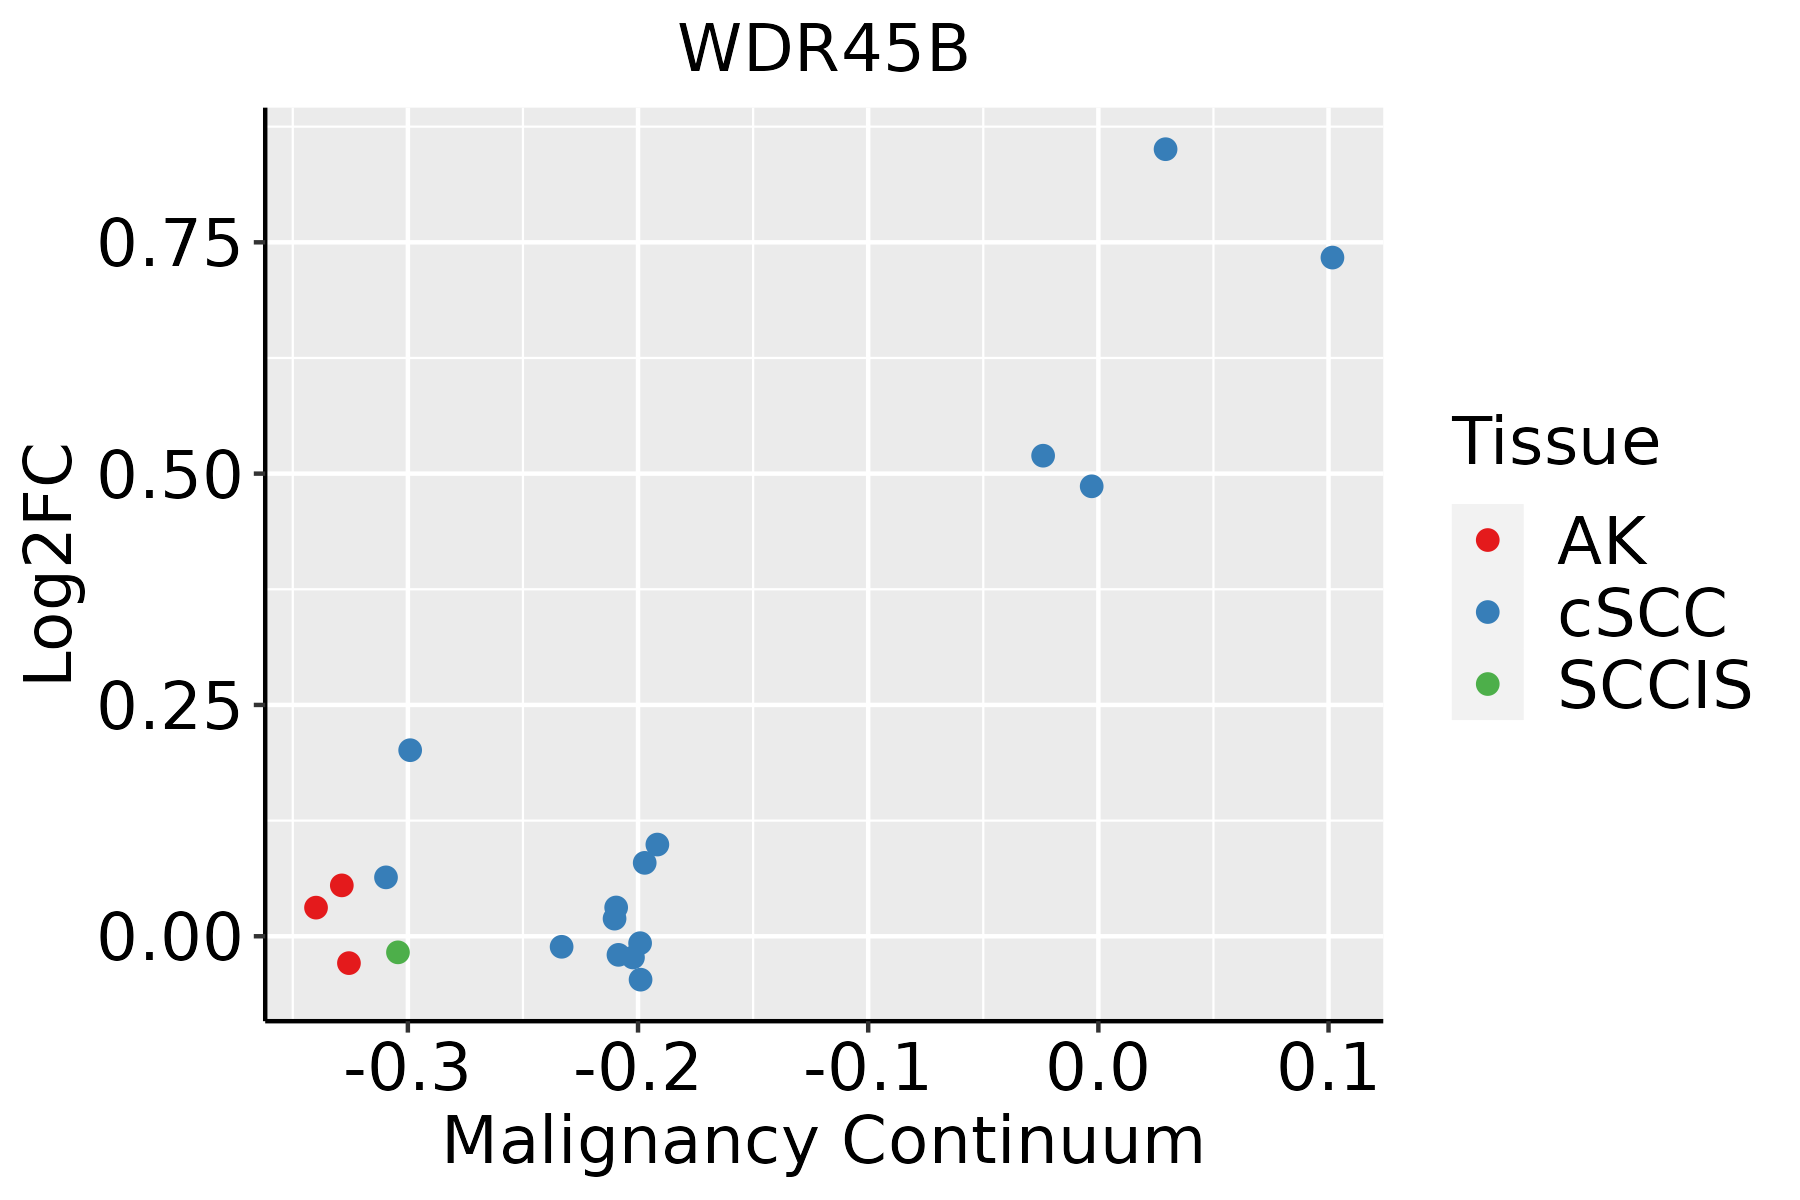
AK: Actinic keratosis
cSCC: Cutaneous squamous cell carcinoma
SCCIS:squamous cell carcinoma in situ
ThyroidThe image shows the transcriptomic changes along malignancy continuum.log2FC in expression of this searched gene in stem-like cells from each diseased tissue sample relative to stem-like cells in normal samples in each tissue plotted against the malignancy continuum. Samples are colored based on if they are from different disease stage.
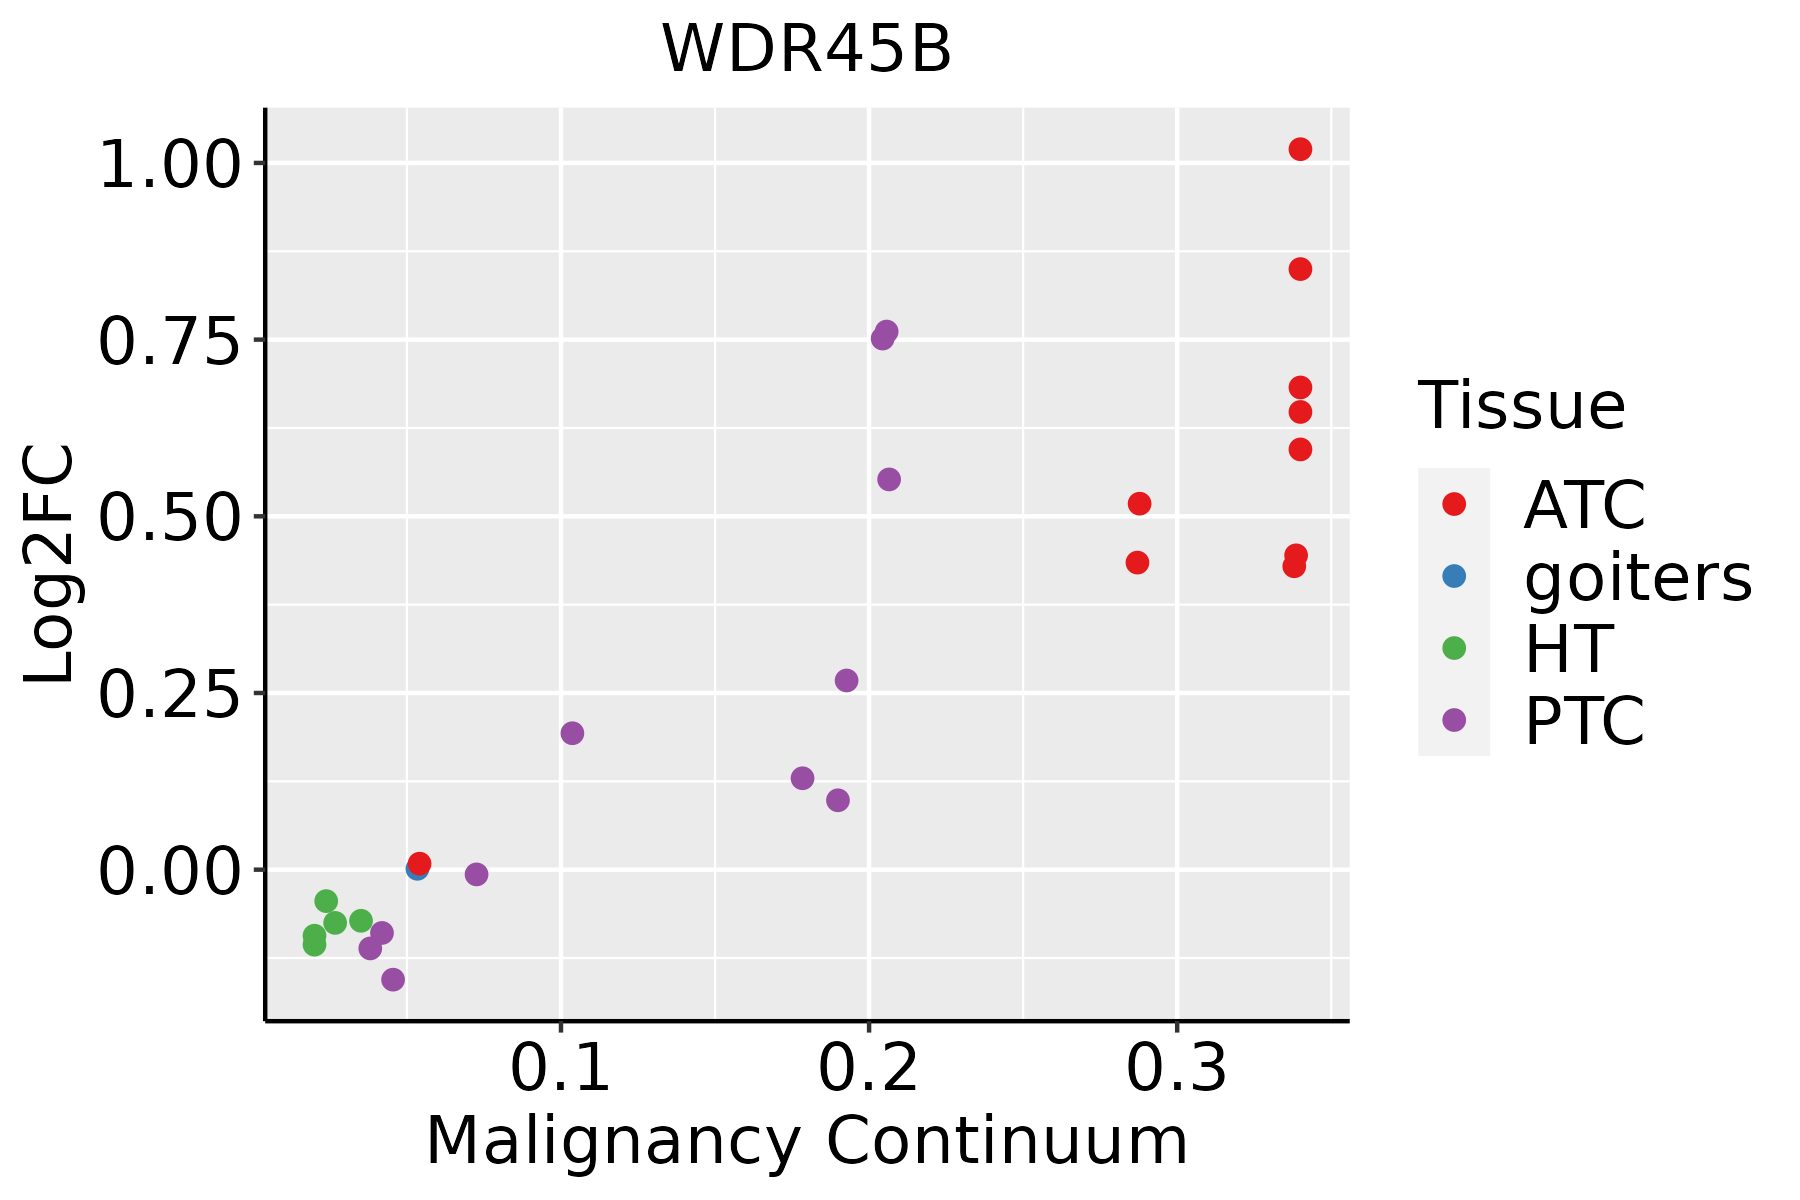
ATC: Anaplastic thyroid cancer
HT: Hashimoto's thyroiditis
PTC: Papillary thyroid cancer
∗log2FC in expression of this searched gene in stem-like cells from each diseased tissue sample relative to stem-like cells in normal samples in each tissue plotted against the malignancy continuum. Samples are colored based on if they are from different disease stage.

Top

Malignant transformation related pathway analysis

check buttonFind out the enriched GO biological processes and KEGG pathways involved in transition from healthy to precancer to cancer
check button Figure of enriched GO biological processes.
TissueDisease StageEnriched GO biological Processes
ColorectumADGO analysis - Figure of enriched GO biological processes: Top 15 enriched GO BP terms are showed in the bar plot of each disease state in each tissue. Each row represents a significant GO biological process which is colored according to the -log10(p.adjust).
ColorectumSERGO analysis - Figure of enriched GO biological processes: Top 15 enriched GO BP terms are showed in the bar plot of each disease state in each tissue. Each row represents a significant GO biological process which is colored according to the -log10(p.adjust).
ColorectumMSSGO analysis - Figure of enriched GO biological processes: Top 15 enriched GO BP terms are showed in the bar plot of each disease state in each tissue. Each row represents a significant GO biological process which is colored according to the -log10(p.adjust).
ColorectumMSI-HGO analysis - Figure of enriched GO biological processes: Top 15 enriched GO BP terms are showed in the bar plot of each disease state in each tissue. Each row represents a significant GO biological process which is colored according to the -log10(p.adjust).
ColorectumFAPGO analysis - Figure of enriched GO biological processes: Top 15 enriched GO BP terms are showed in the bar plot of each disease state in each tissue. Each row represents a significant GO biological process which is colored according to the -log10(p.adjust).
∗Top 15 enriched GO BP terms are showed in the bar plot of each disease state in each tissue. Each row represents a significant GO biological process which is colored according to the -log10(p.adjust).
Page: 1 2 3 4 5 6 7 8 9 

check button Enriched GO biological processes.
GO IDTissueDisease StageDescriptionGene RatioBg Ratiopvaluep.adjustCount
GO:00004226BreastPrecancerautophagy of mitochondrion14/108081/187232.01e-043.16e-0314
GO:00617266BreastPrecancermitochondrion disassembly14/108081/187232.01e-043.16e-0314
GO:00316679BreastPrecancerresponse to nutrient levels47/1080474/187232.09e-043.27e-0347
GO:00224119BreastPrecancercellular component disassembly44/1080443/187233.17e-044.51e-0344
GO:00714969BreastPrecancercellular response to external stimulus33/1080320/187239.01e-041.03e-0233
GO:00316688BreastPrecancercellular response to extracellular stimulus27/1080246/187231.02e-031.13e-0227
GO:00092677BreastPrecancercellular response to starvation19/1080156/187231.65e-031.67e-0219
GO:00425947BreastPrecancerresponse to starvation22/1080197/187232.30e-032.15e-0222
GO:19030085BreastPrecancerorganelle disassembly15/1080114/187232.31e-032.15e-0215
GO:00316697BreastPrecancercellular response to nutrient levels22/1080215/187236.58e-034.53e-0222
GO:003166714BreastIDCresponse to nutrient levels62/1434474/187232.33e-055.57e-0462
GO:007149614BreastIDCcellular response to external stimulus45/1434320/187235.40e-051.15e-0345
GO:003166814BreastIDCcellular response to extracellular stimulus35/1434246/187232.79e-044.26e-0335
GO:000042212BreastIDCautophagy of mitochondrion15/143481/187231.13e-031.23e-0215
GO:006172612BreastIDCmitochondrion disassembly15/143481/187231.13e-031.23e-0215
GO:003166914BreastIDCcellular response to nutrient levels28/1434215/187234.02e-033.25e-0228
GO:190300812BreastIDCorganelle disassembly17/1434114/187235.99e-034.31e-0217
GO:007149623BreastDCIScellular response to external stimulus45/1390320/187232.55e-055.87e-0445
GO:003166723BreastDCISresponse to nutrient levels58/1390474/187231.16e-042.03e-0358
GO:003166822BreastDCIScellular response to extracellular stimulus35/1390246/187231.54e-042.59e-0335
Page: 1 2 3 4 5 6 7 8 9 10 

check button Enriched KEGG pathways.
Pathway IDTissueDisease StageDescriptionGene RatioBg Ratiopvaluep.adjustqvalueCount
Page: 1 

Top

Cell-cell communication analysis

check buttonIdentification of potential cell-cell interactions between two cell types and their ligand-receptor pairs for different disease states
LigandReceptorLRpairPathwayTissueDisease Stage
Page: 1 

Top

Single-cell gene regulatory network inference analysis

check buttonFind out the significant the regulons (TFs) and the target genes of each regulon across cell types for different disease states
TFCell TypeTissueDisease StageTarget GeneRSSRegulon Activity
∗The dot plots of a searched regulon are shown for all cell subpopulations in each disease state of each tissue based on the regulon specific score inferred using pySCENIC and by calculating the average expression.
Page: 1 

Top

Somatic mutation of malignant transformation related genes

check buttonAnnotation of somatic variants for genes involved in malignant transformation
Hugo SymbolVariant ClassVariant ClassificationdbSNP RSHGVScHGVSpHGVSp ShortSWISSPROTBIOTYPESIFTPolyPhenTumor Sample BarcodeTissueHistologySexAgeStageTherapy TypesDrugsOutcome
WDR45BSNVMissense_Mutationc.923T>Gp.Val308Glyp.V308GQ5MNZ6protein_codingdeleterious(0)possibly_damaging(0.832)TCGA-A1-A0SO-01Breastbreast invasive carcinomaFemale>=65I/IIChemotherapySD
WDR45BSNVMissense_Mutationnovelc.734T>Ap.Ile245Asnp.I245NQ5MNZ6protein_codingdeleterious(0)benign(0.24)TCGA-BH-A0BM-01Breastbreast invasive carcinomaFemale<65I/IIChemotherapyadriamycinSD
WDR45BinsertionNonsense_Mutationnovelc.777_778insTCTTAACCCTGTAGCCAACACCGGGTGATTAGATGCTCACCCCAAGACCGTCAp.Glu260SerfsTer2p.E260Sfs*2Q5MNZ6protein_codingTCGA-A2-A04Y-01Breastbreast invasive carcinomaFemale<65I/IIChemotherapycytoxanSD
WDR45BinsertionFrame_Shift_Insnovelc.731_732insACTACAAATTCCTGTTp.Ile245LeufsTer21p.I245Lfs*21Q5MNZ6protein_codingTCGA-BH-A0BM-01Breastbreast invasive carcinomaFemale<65I/IIChemotherapyadriamycinSD
WDR45BSNVMissense_Mutationnovelc.866N>Gp.Phe289Cysp.F289CQ5MNZ6protein_codingdeleterious(0)possibly_damaging(0.818)TCGA-2W-A8YY-01Cervixcervical & endocervical cancerFemale<65I/IIChemotherapycisplatinCR
WDR45BSNVMissense_Mutationnovelc.322N>Tp.Arg108Trpp.R108WQ5MNZ6protein_codingdeleterious(0)probably_damaging(0.958)TCGA-2W-A8YY-01Cervixcervical & endocervical cancerFemale<65I/IIChemotherapycisplatinCR
WDR45BSNVMissense_Mutationc.77N>Tp.Ala26Valp.A26VQ5MNZ6protein_codingdeleterious(0.04)benign(0.092)TCGA-2W-A8YY-01Cervixcervical & endocervical cancerFemale<65I/IIChemotherapycisplatinCR
WDR45BSNVMissense_Mutationrs780142007c.1024G>Ap.Asp342Asnp.D342NQ5MNZ6protein_codingdeleterious(0.04)benign(0.017)TCGA-C5-A2LX-01Cervixcervical & endocervical cancerFemale<65I/IIChemotherapycisplatinSD
WDR45BSNVMissense_Mutationc.249N>Ap.Met83Ilep.M83IQ5MNZ6protein_codingtolerated(0.23)benign(0)TCGA-EA-A3HR-01Cervixcervical & endocervical cancerFemale<65I/IIUnknownUnknownSD
WDR45BSNVMissense_Mutationnovelc.887N>Tp.Pro296Leup.P296LQ5MNZ6protein_codingtolerated(0.05)benign(0.084)TCGA-VS-A9UD-01Cervixcervical & endocervical cancerFemale>=65III/IVChemotherapycisplatinCR
Page: 1 2 3 4 5 

Top

Related drugs of malignant transformation related genes

check buttonIdentification of chemicals and drugs interact with genes involved in malignant transfromation
(DGIdb 4.0)
Entrez IDSymbolCategoryInteraction TypesDrug Claim NameDrug NamePMIDs
Page: 1