
|
|||||
|
 | |
| |
| |
| |
| |
| |
|
Gene: WDR44 |
Gene summary for WDR44 |
| Gene information | Species | Human | Gene symbol | WDR44 | Gene ID | 54521 |
| Gene name | WD repeat domain 44 | |
| Gene Alias | RAB11BP | |
| Cytomap | Xq24 | |
| Gene Type | protein-coding | GO ID | GO:0005575 | UniProtAcc | Q5JSH3 |
Top |
Malignant transformation analysis |
| Identification of the aberrant gene expression in precancerous and cancerous lesions by comparing the gene expression of stem-like cells in diseased tissues with normal stem cells |
| Entrez ID | Symbol | Replicates | Species | Organ | Tissue | Adj P-value | Log2FC | Malignancy |
| 54521 | WDR44 | CCI_2 | Human | Cervix | CC | 1.46e-04 | 8.08e-01 | 0.5249 |
| 54521 | WDR44 | CCI_3 | Human | Cervix | CC | 3.35e-06 | 5.01e-01 | 0.516 |
| 54521 | WDR44 | T3 | Human | Cervix | CC | 2.68e-02 | 1.14e-01 | 0.1389 |
| 54521 | WDR44 | LZE4T | Human | Esophagus | ESCC | 4.35e-08 | 1.54e-01 | 0.0811 |
| 54521 | WDR44 | LZE7T | Human | Esophagus | ESCC | 1.08e-06 | 3.18e-01 | 0.0667 |
| 54521 | WDR44 | LZE24T | Human | Esophagus | ESCC | 3.35e-12 | 2.56e-01 | 0.0596 |
| 54521 | WDR44 | P1T-E | Human | Esophagus | ESCC | 4.92e-03 | 1.55e-01 | 0.0875 |
| 54521 | WDR44 | P2T-E | Human | Esophagus | ESCC | 1.95e-13 | 1.84e-01 | 0.1177 |
| 54521 | WDR44 | P4T-E | Human | Esophagus | ESCC | 3.86e-06 | 1.14e-01 | 0.1323 |
| 54521 | WDR44 | P5T-E | Human | Esophagus | ESCC | 1.13e-04 | 8.77e-02 | 0.1327 |
| 54521 | WDR44 | P8T-E | Human | Esophagus | ESCC | 3.38e-11 | 1.06e-01 | 0.0889 |
| 54521 | WDR44 | P9T-E | Human | Esophagus | ESCC | 4.81e-07 | 1.40e-01 | 0.1131 |
| 54521 | WDR44 | P10T-E | Human | Esophagus | ESCC | 1.91e-02 | 1.17e-01 | 0.116 |
| 54521 | WDR44 | P11T-E | Human | Esophagus | ESCC | 1.24e-06 | 3.14e-01 | 0.1426 |
| 54521 | WDR44 | P12T-E | Human | Esophagus | ESCC | 1.16e-07 | 1.56e-01 | 0.1122 |
| 54521 | WDR44 | P15T-E | Human | Esophagus | ESCC | 1.66e-11 | 2.25e-01 | 0.1149 |
| 54521 | WDR44 | P16T-E | Human | Esophagus | ESCC | 4.72e-05 | 3.55e-02 | 0.1153 |
| 54521 | WDR44 | P20T-E | Human | Esophagus | ESCC | 1.31e-12 | 1.72e-01 | 0.1124 |
| 54521 | WDR44 | P21T-E | Human | Esophagus | ESCC | 5.30e-20 | 3.27e-01 | 0.1617 |
| 54521 | WDR44 | P22T-E | Human | Esophagus | ESCC | 7.22e-09 | 1.33e-01 | 0.1236 |
| Page: 1 2 3 4 |
| Tissue | Expression Dynamics | Abbreviation |
| Cervix | 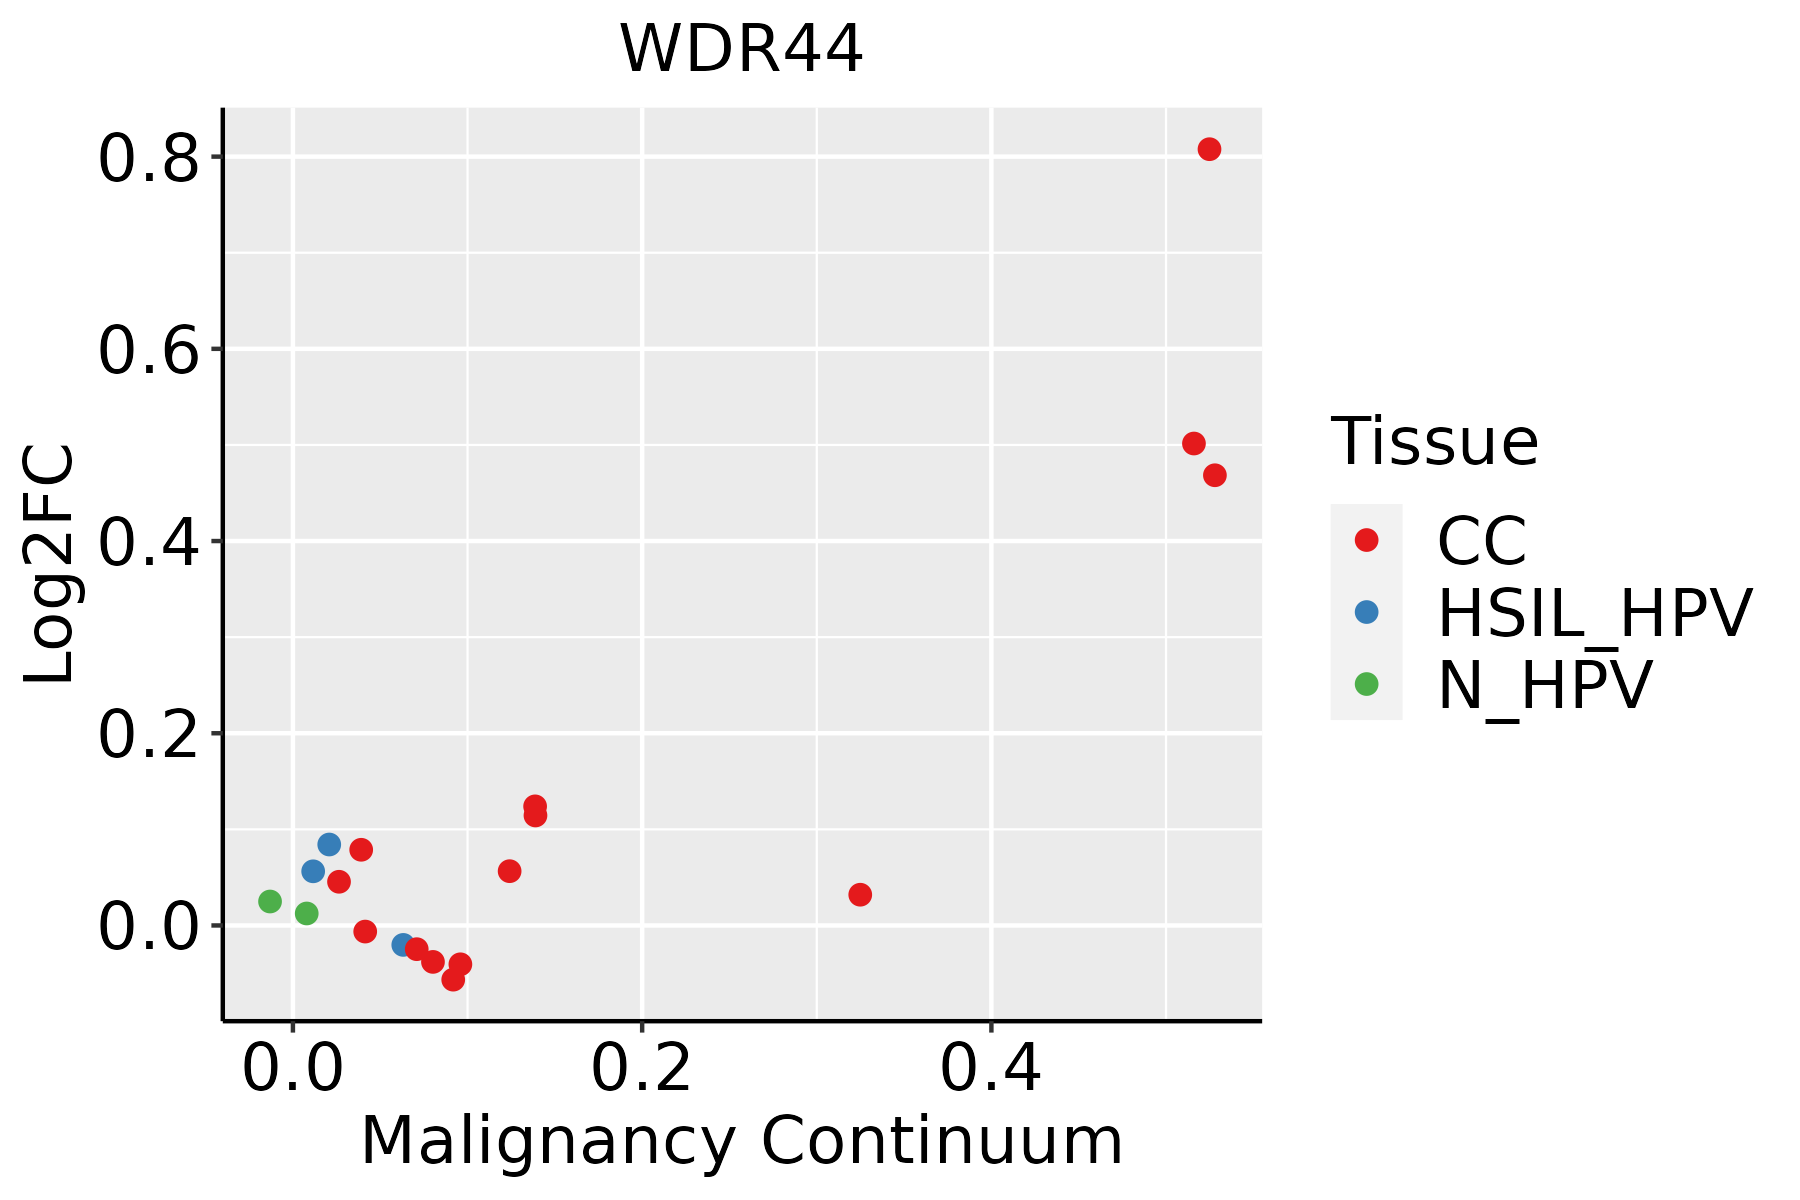 | CC: Cervix cancer |
| HSIL_HPV: HPV-infected high-grade squamous intraepithelial lesions | ||
| N_HPV: HPV-infected normal cervix | ||
| Esophagus | 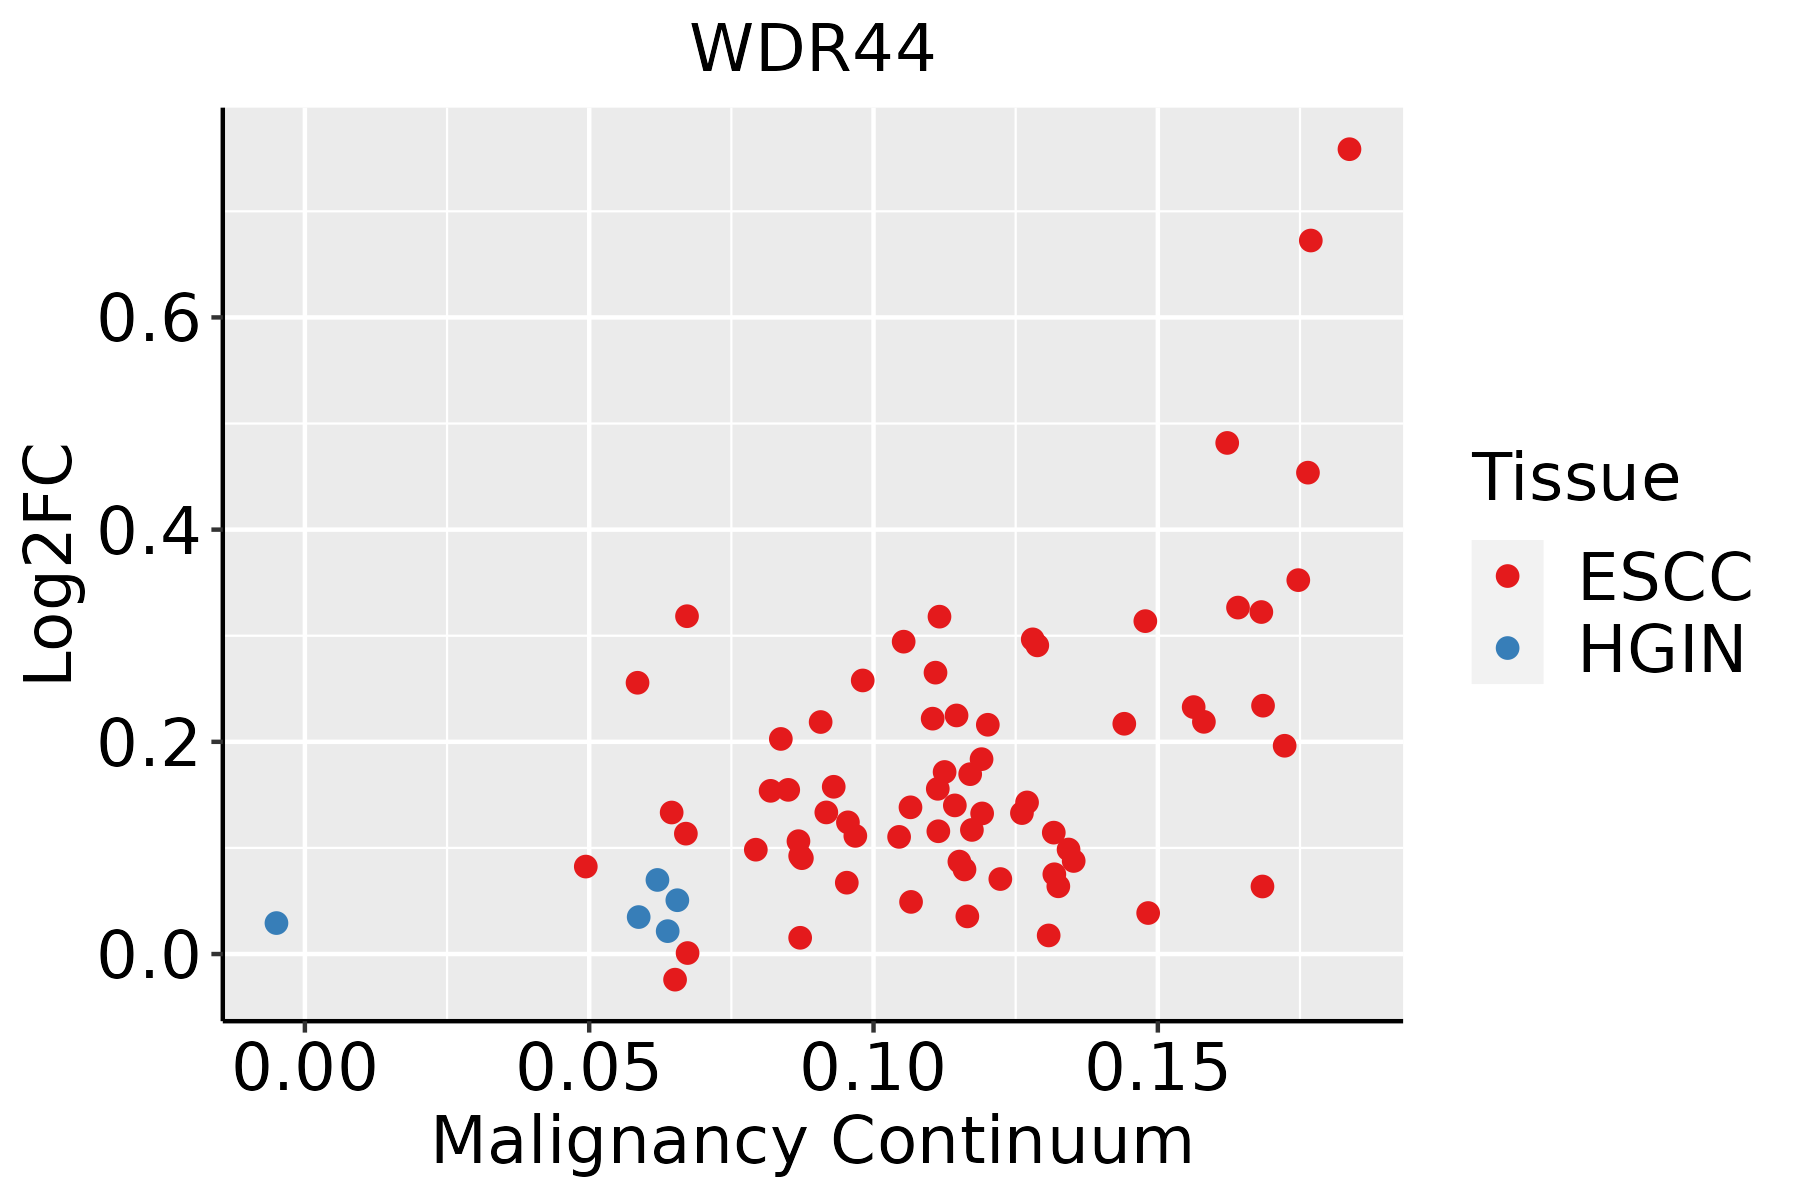 | ESCC: Esophageal squamous cell carcinoma |
| HGIN: High-grade intraepithelial neoplasias | ||
| LGIN: Low-grade intraepithelial neoplasias | ||
| Liver | 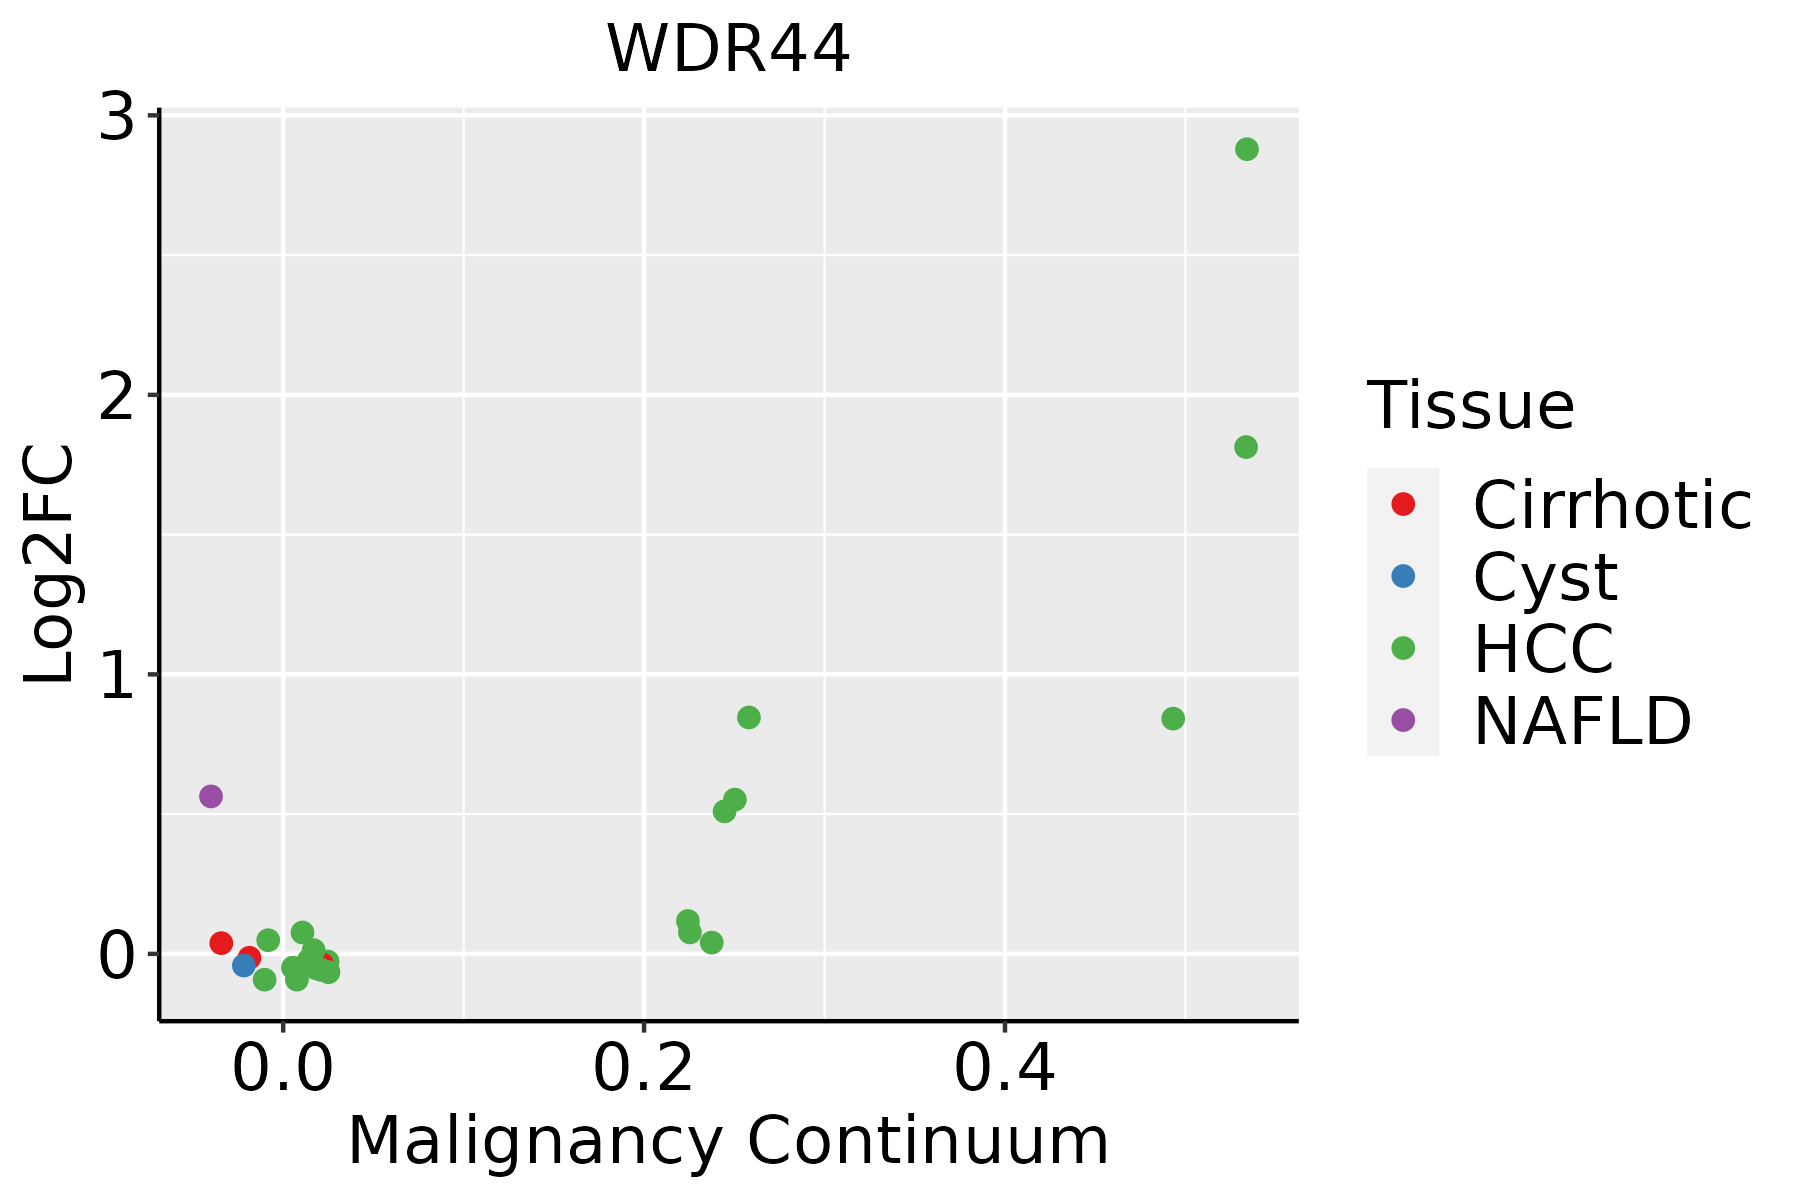 | HCC: Hepatocellular carcinoma |
| NAFLD: Non-alcoholic fatty liver disease | ||
| Thyroid |  | ATC: Anaplastic thyroid cancer |
| HT: Hashimoto's thyroiditis | ||
| PTC: Papillary thyroid cancer |
| ∗log2FC in expression of this searched gene in stem-like cells from each diseased tissue sample relative to stem-like cells in normal samples in each tissue plotted against the malignancy continuum. Samples are colored based on if they are from different disease stage. |
Top |
Malignant transformation related pathway analysis |
| Find out the enriched GO biological processes and KEGG pathways involved in transition from healthy to precancer to cancer |
| Tissue | Disease Stage | Enriched GO biological Processes |
| Colorectum | AD |  |
| Colorectum | SER |  |
| Colorectum | MSS |  |
| Colorectum | MSI-H |  |
| Colorectum | FAP |  |
| ∗Top 15 enriched GO BP terms are showed in the bar plot of each disease state in each tissue. Each row represents a significant GO biological process which is colored according to the -log10(p.adjust). |
| Page: 1 2 3 4 5 6 7 8 9 |
| GO ID | Tissue | Disease Stage | Description | Gene Ratio | Bg Ratio | pvalue | p.adjust | Count |
| Page: 1 |
| Pathway ID | Tissue | Disease Stage | Description | Gene Ratio | Bg Ratio | pvalue | p.adjust | qvalue | Count |
| Page: 1 |
Top |
Cell-cell communication analysis |
| Identification of potential cell-cell interactions between two cell types and their ligand-receptor pairs for different disease states |
| Ligand | Receptor | LRpair | Pathway | Tissue | Disease Stage |
| Page: 1 |
Top |
Single-cell gene regulatory network inference analysis |
| Find out the significant the regulons (TFs) and the target genes of each regulon across cell types for different disease states |
| TF | Cell Type | Tissue | Disease Stage | Target Gene | RSS | Regulon Activity |
| ∗The dot plots of a searched regulon are shown for all cell subpopulations in each disease state of each tissue based on the regulon specific score inferred using pySCENIC and by calculating the average expression. |
| Page: 1 |
Top |
Somatic mutation of malignant transformation related genes |
| Annotation of somatic variants for genes involved in malignant transformation |
| Hugo Symbol | Variant Class | Variant Classification | dbSNP RS | HGVSc | HGVSp | HGVSp Short | SWISSPROT | BIOTYPE | SIFT | PolyPhen | Tumor Sample Barcode | Tissue | Histology | Sex | Age | Stage | Therapy Types | Drugs | Outcome |
| WDR44 | SNV | Missense_Mutation | novel | c.880G>A | p.Glu294Lys | p.E294K | Q5JSH3 | protein_coding | tolerated(0.13) | benign(0.08) | TCGA-A2-A0CX-01 | Breast | breast invasive carcinoma | Female | <65 | I/II | Chemotherapy | adriamycin | SD |
| WDR44 | SNV | Missense_Mutation | rs753819771 | c.613N>A | p.Ala205Thr | p.A205T | Q5JSH3 | protein_coding | tolerated_low_confidence(0.68) | benign(0) | TCGA-A2-A4S3-01 | Breast | breast invasive carcinoma | Female | <65 | I/II | Unknown | Unknown | SD |
| WDR44 | SNV | Missense_Mutation | c.758C>A | p.Pro253His | p.P253H | Q5JSH3 | protein_coding | deleterious(0.03) | possibly_damaging(0.907) | TCGA-A7-A0CG-01 | Breast | breast invasive carcinoma | Female | >=65 | I/II | Unknown | Unknown | SD | |
| WDR44 | SNV | Missense_Mutation | c.1460C>T | p.Ala487Val | p.A487V | Q5JSH3 | protein_coding | tolerated(0.06) | possibly_damaging(0.901) | TCGA-A7-A13F-01 | Breast | breast invasive carcinoma | Female | <65 | III/IV | Chemotherapy | doxorubicin | SD | |
| WDR44 | SNV | Missense_Mutation | c.1853N>G | p.Asn618Ser | p.N618S | Q5JSH3 | protein_coding | tolerated(0.06) | possibly_damaging(0.855) | TCGA-A8-A09Z-01 | Breast | breast invasive carcinoma | Female | >=65 | I/II | Unknown | Unknown | SD | |
| WDR44 | SNV | Missense_Mutation | novel | c.1311G>C | p.Lys437Asn | p.K437N | Q5JSH3 | protein_coding | tolerated(0.07) | benign(0.334) | TCGA-AO-A1KR-01 | Breast | breast invasive carcinoma | Female | <65 | I/II | Chemotherapy | cyclophosphamide | SD |
| WDR44 | SNV | Missense_Mutation | c.2378G>A | p.Ser793Asn | p.S793N | Q5JSH3 | protein_coding | deleterious(0.02) | probably_damaging(0.997) | TCGA-AR-A0TP-01 | Breast | breast invasive carcinoma | Female | <65 | I/II | Chemotherapy | doxorubicin | SD | |
| WDR44 | SNV | Missense_Mutation | rs771913074 | c.1786N>T | p.Arg596Trp | p.R596W | Q5JSH3 | protein_coding | deleterious(0.05) | probably_damaging(0.96) | TCGA-AR-A5QP-01 | Breast | breast invasive carcinoma | Female | <65 | I/II | Hormone Therapy | tamoxiphen | SD |
| WDR44 | SNV | Missense_Mutation | c.2212C>T | p.Arg738Cys | p.R738C | Q5JSH3 | protein_coding | deleterious(0) | probably_damaging(0.987) | TCGA-BH-A2L8-01 | Breast | breast invasive carcinoma | Female | <65 | I/II | Chemotherapy | cytoxan | CR | |
| WDR44 | SNV | Missense_Mutation | c.1969N>G | p.Pro657Ala | p.P657A | Q5JSH3 | protein_coding | deleterious(0.01) | probably_damaging(1) | TCGA-C8-A26Y-01 | Breast | breast invasive carcinoma | Female | >=65 | I/II | Unknown | Unknown | SD |
| Page: 1 2 3 4 5 6 7 8 9 10 11 12 13 14 15 |
Top |
Related drugs of malignant transformation related genes |
| Identification of chemicals and drugs interact with genes involved in malignant transfromation |
| (DGIdb 4.0) |
| Entrez ID | Symbol | Category | Interaction Types | Drug Claim Name | Drug Name | PMIDs |
| Page: 1 |

Copyright 2023-Present -The University of Texas Health Science Center at Houston |