
|
|||||
|
 | |
| |
| |
| |
| |
| |
|
Gene: WDR43 |
Gene summary for WDR43 |
| Gene information | Species | Human | Gene symbol | WDR43 | Gene ID | 23160 |
| Gene name | WD repeat domain 43 | |
| Gene Alias | NET12 | |
| Cytomap | 2p23.2 | |
| Gene Type | protein-coding | GO ID | GO:0006139 | UniProtAcc | Q15061 |
Top |
Malignant transformation analysis |
| Identification of the aberrant gene expression in precancerous and cancerous lesions by comparing the gene expression of stem-like cells in diseased tissues with normal stem cells |
| Entrez ID | Symbol | Replicates | Species | Organ | Tissue | Adj P-value | Log2FC | Malignancy |
| 23160 | WDR43 | N_HPV_2 | Human | Cervix | N_HPV | 9.55e-03 | 1.95e-01 | -0.0131 |
| 23160 | WDR43 | CCI_2 | Human | Cervix | CC | 1.16e-09 | 1.12e+00 | 0.5249 |
| 23160 | WDR43 | CCI_3 | Human | Cervix | CC | 1.20e-04 | 5.30e-01 | 0.516 |
| 23160 | WDR43 | HTA11_3410_2000001011 | Human | Colorectum | AD | 1.98e-11 | -5.44e-01 | 0.0155 |
| 23160 | WDR43 | HTA11_2487_2000001011 | Human | Colorectum | SER | 1.61e-05 | -5.58e-01 | -0.1808 |
| 23160 | WDR43 | HTA11_3361_2000001011 | Human | Colorectum | AD | 1.24e-06 | -6.37e-01 | -0.1207 |
| 23160 | WDR43 | HTA11_696_2000001011 | Human | Colorectum | AD | 1.17e-21 | -5.19e-01 | -0.1464 |
| 23160 | WDR43 | HTA11_866_2000001011 | Human | Colorectum | AD | 1.03e-14 | -4.84e-01 | -0.1001 |
| 23160 | WDR43 | HTA11_10711_2000001011 | Human | Colorectum | AD | 1.55e-02 | -4.99e-01 | 0.0338 |
| 23160 | WDR43 | HTA11_7696_3000711011 | Human | Colorectum | AD | 2.85e-09 | -4.12e-01 | 0.0674 |
| 23160 | WDR43 | HTA11_6818_2000001021 | Human | Colorectum | AD | 3.78e-03 | -5.41e-01 | 0.0588 |
| 23160 | WDR43 | HTA11_99999970781_79442 | Human | Colorectum | MSS | 2.55e-09 | -2.73e-01 | 0.294 |
| 23160 | WDR43 | HTA11_99999974143_84620 | Human | Colorectum | MSS | 1.97e-07 | -3.41e-01 | 0.3005 |
| 23160 | WDR43 | A002-C-010 | Human | Colorectum | FAP | 4.50e-04 | -2.97e-01 | 0.242 |
| 23160 | WDR43 | A001-C-207 | Human | Colorectum | FAP | 2.82e-02 | -1.94e-01 | 0.1278 |
| 23160 | WDR43 | A015-C-203 | Human | Colorectum | FAP | 6.32e-28 | -5.15e-01 | -0.1294 |
| 23160 | WDR43 | A015-C-204 | Human | Colorectum | FAP | 3.09e-06 | -2.99e-01 | -0.0228 |
| 23160 | WDR43 | A014-C-040 | Human | Colorectum | FAP | 8.73e-06 | -5.96e-01 | -0.1184 |
| 23160 | WDR43 | A002-C-201 | Human | Colorectum | FAP | 4.12e-13 | -4.10e-01 | 0.0324 |
| 23160 | WDR43 | A002-C-203 | Human | Colorectum | FAP | 3.43e-05 | -2.48e-01 | 0.2786 |
| Page: 1 2 3 4 5 6 7 8 9 |
| Tissue | Expression Dynamics | Abbreviation |
| Cervix |  | CC: Cervix cancer |
| HSIL_HPV: HPV-infected high-grade squamous intraepithelial lesions | ||
| N_HPV: HPV-infected normal cervix | ||
| Colorectum (GSE201348) |  | FAP: Familial adenomatous polyposis |
| CRC: Colorectal cancer | ||
| Colorectum (HTA11) |  | AD: Adenomas |
| SER: Sessile serrated lesions | ||
| MSI-H: Microsatellite-high colorectal cancer | ||
| MSS: Microsatellite stable colorectal cancer | ||
| Endometrium | 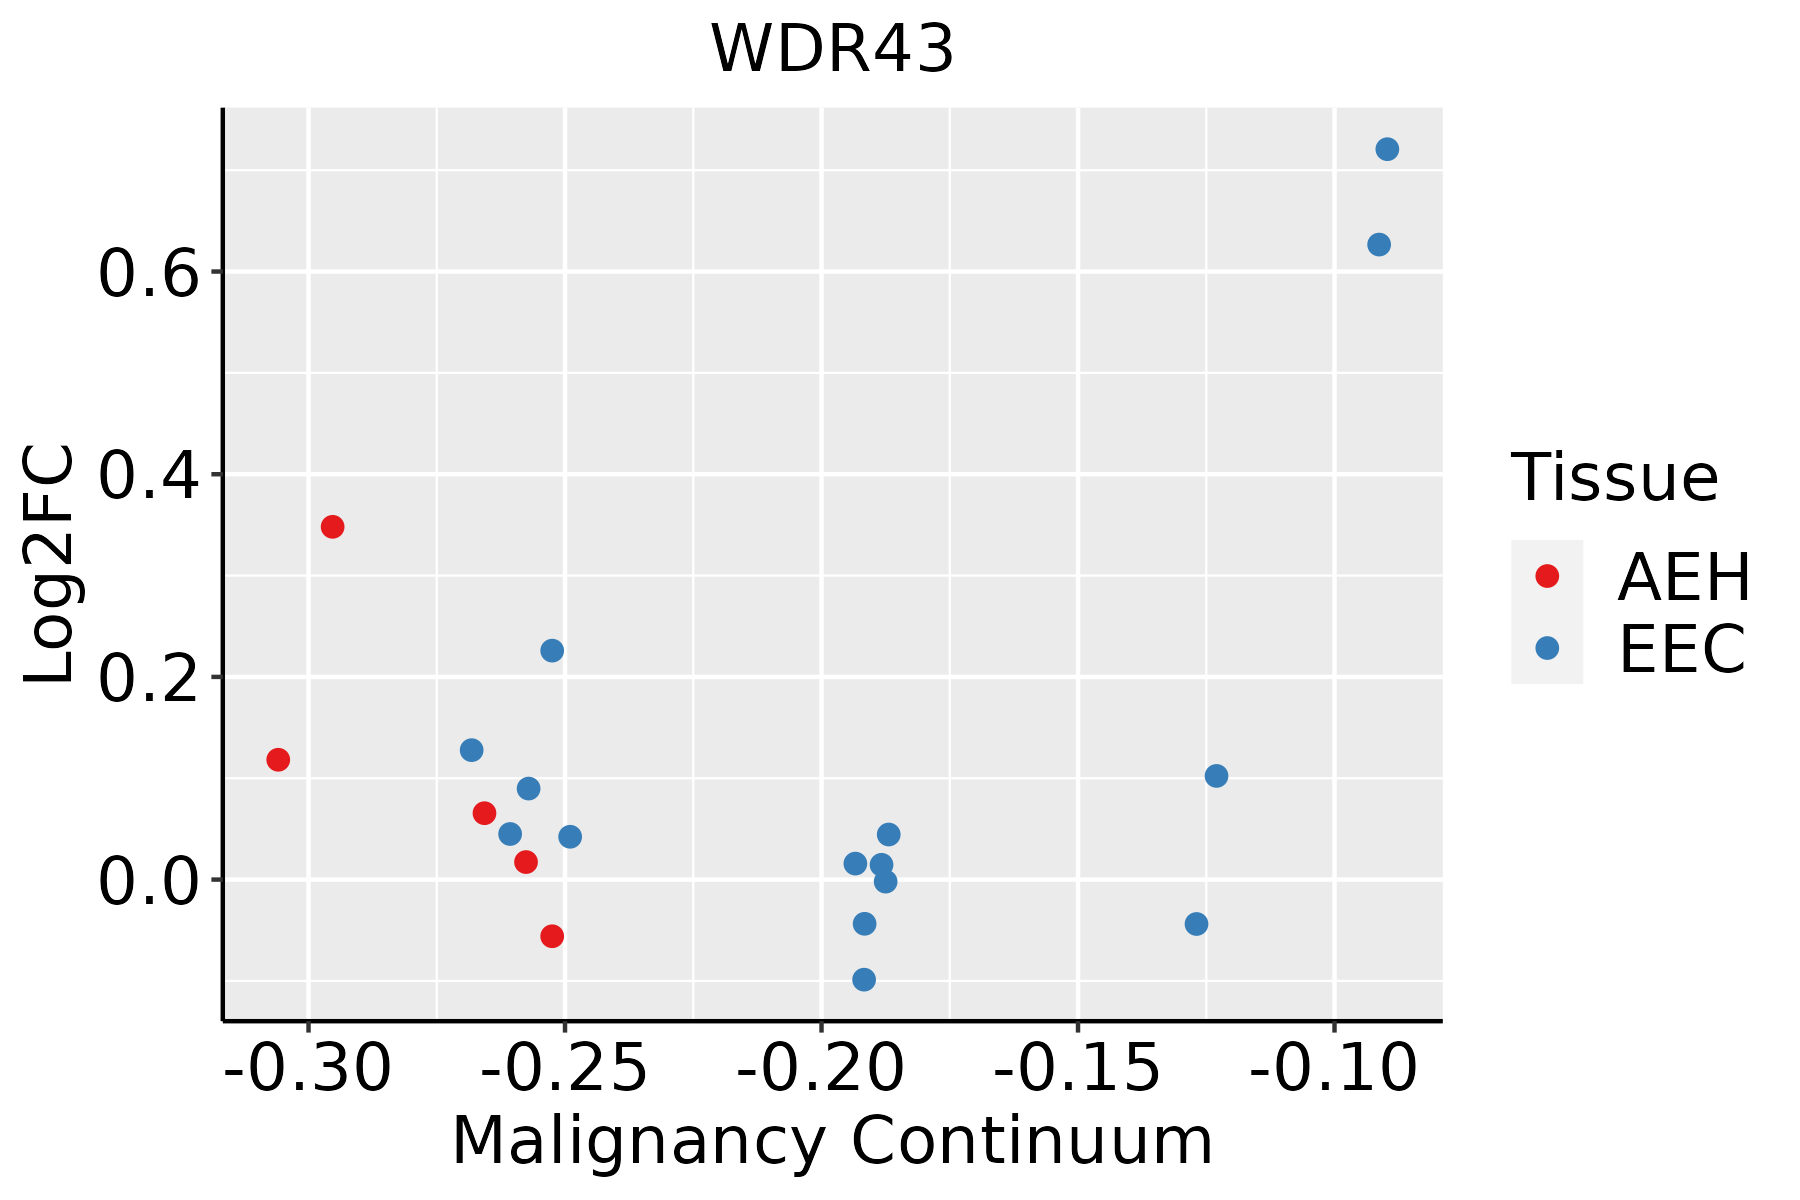 | AEH: Atypical endometrial hyperplasia |
| EEC: Endometrioid Cancer | ||
| Esophagus |  | ESCC: Esophageal squamous cell carcinoma |
| HGIN: High-grade intraepithelial neoplasias | ||
| LGIN: Low-grade intraepithelial neoplasias | ||
| Liver |  | HCC: Hepatocellular carcinoma |
| NAFLD: Non-alcoholic fatty liver disease | ||
| Oral Cavity | 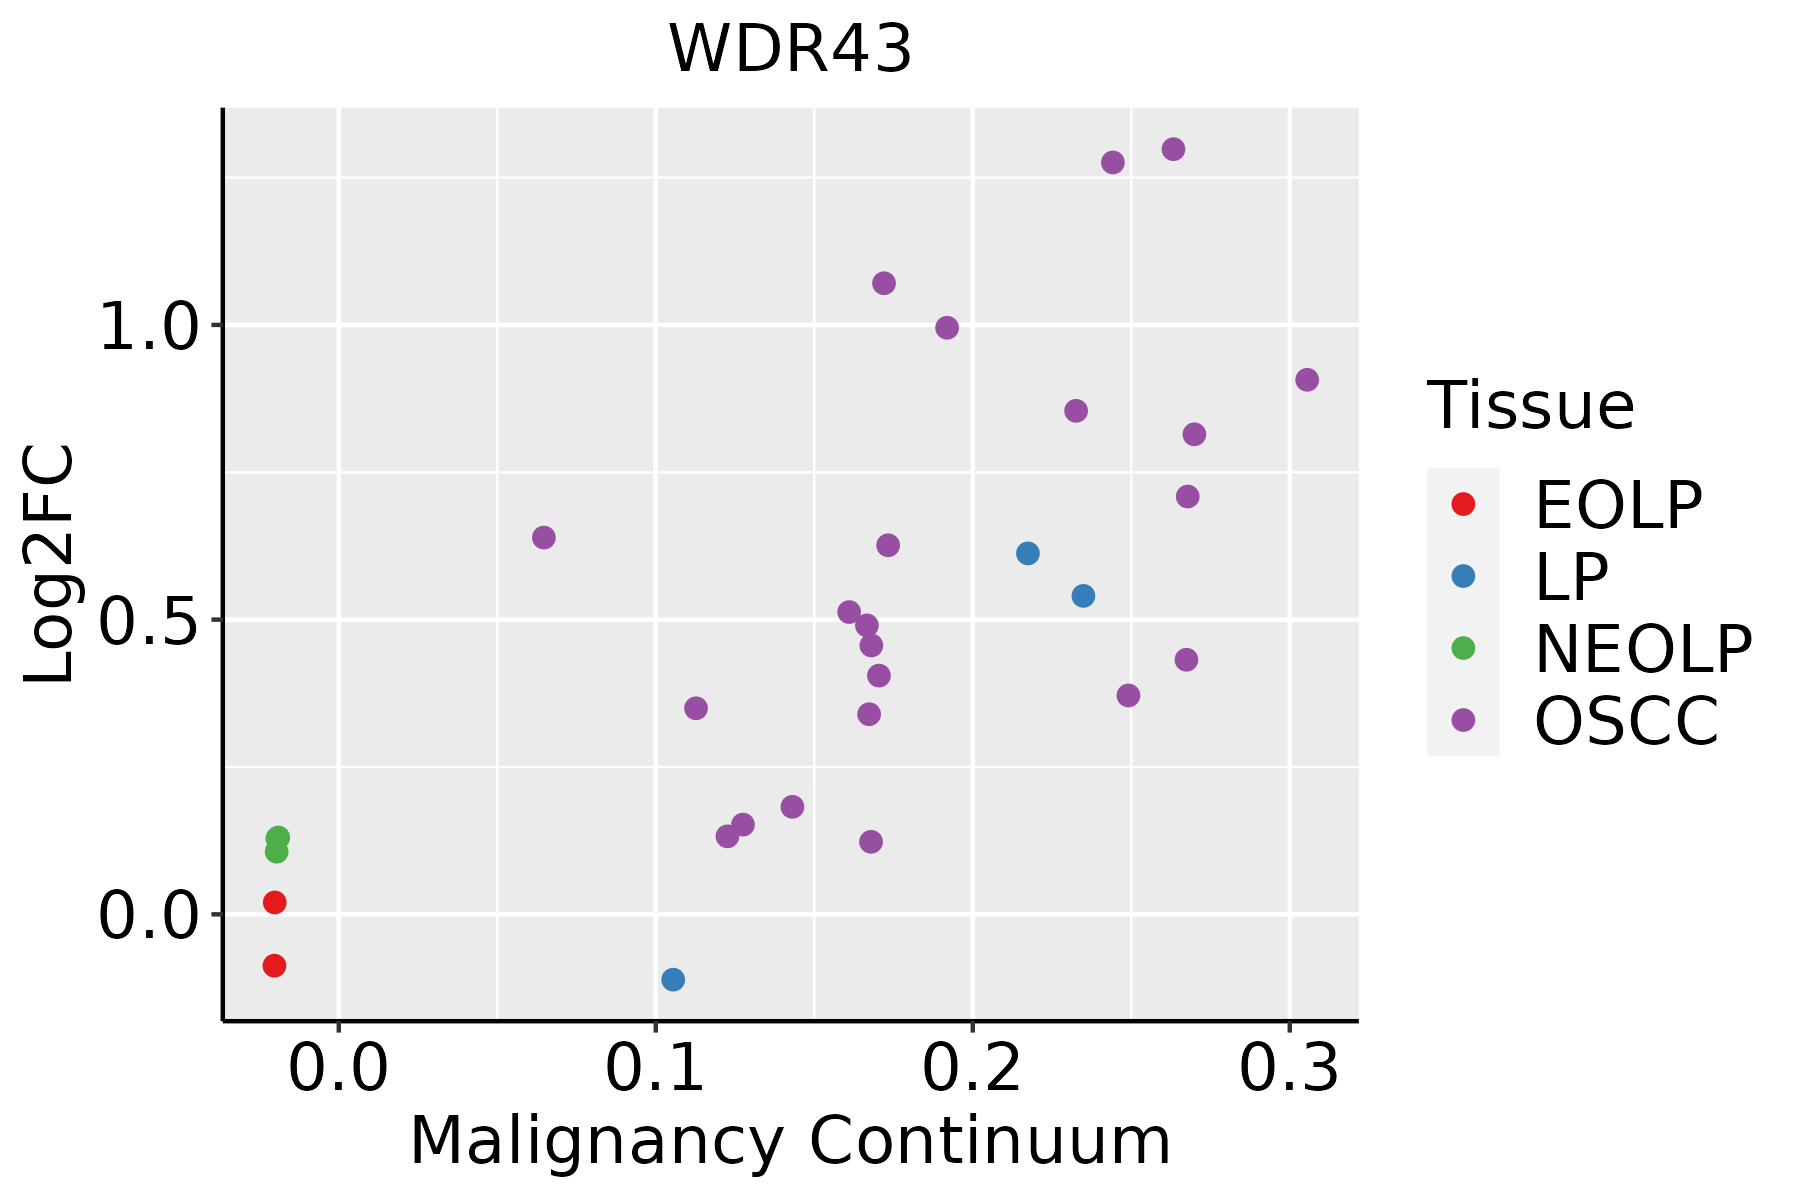 | EOLP: Erosive Oral lichen planus |
| LP: leukoplakia | ||
| NEOLP: Non-erosive oral lichen planus | ||
| OSCC: Oral squamous cell carcinoma | ||
| Prostate | 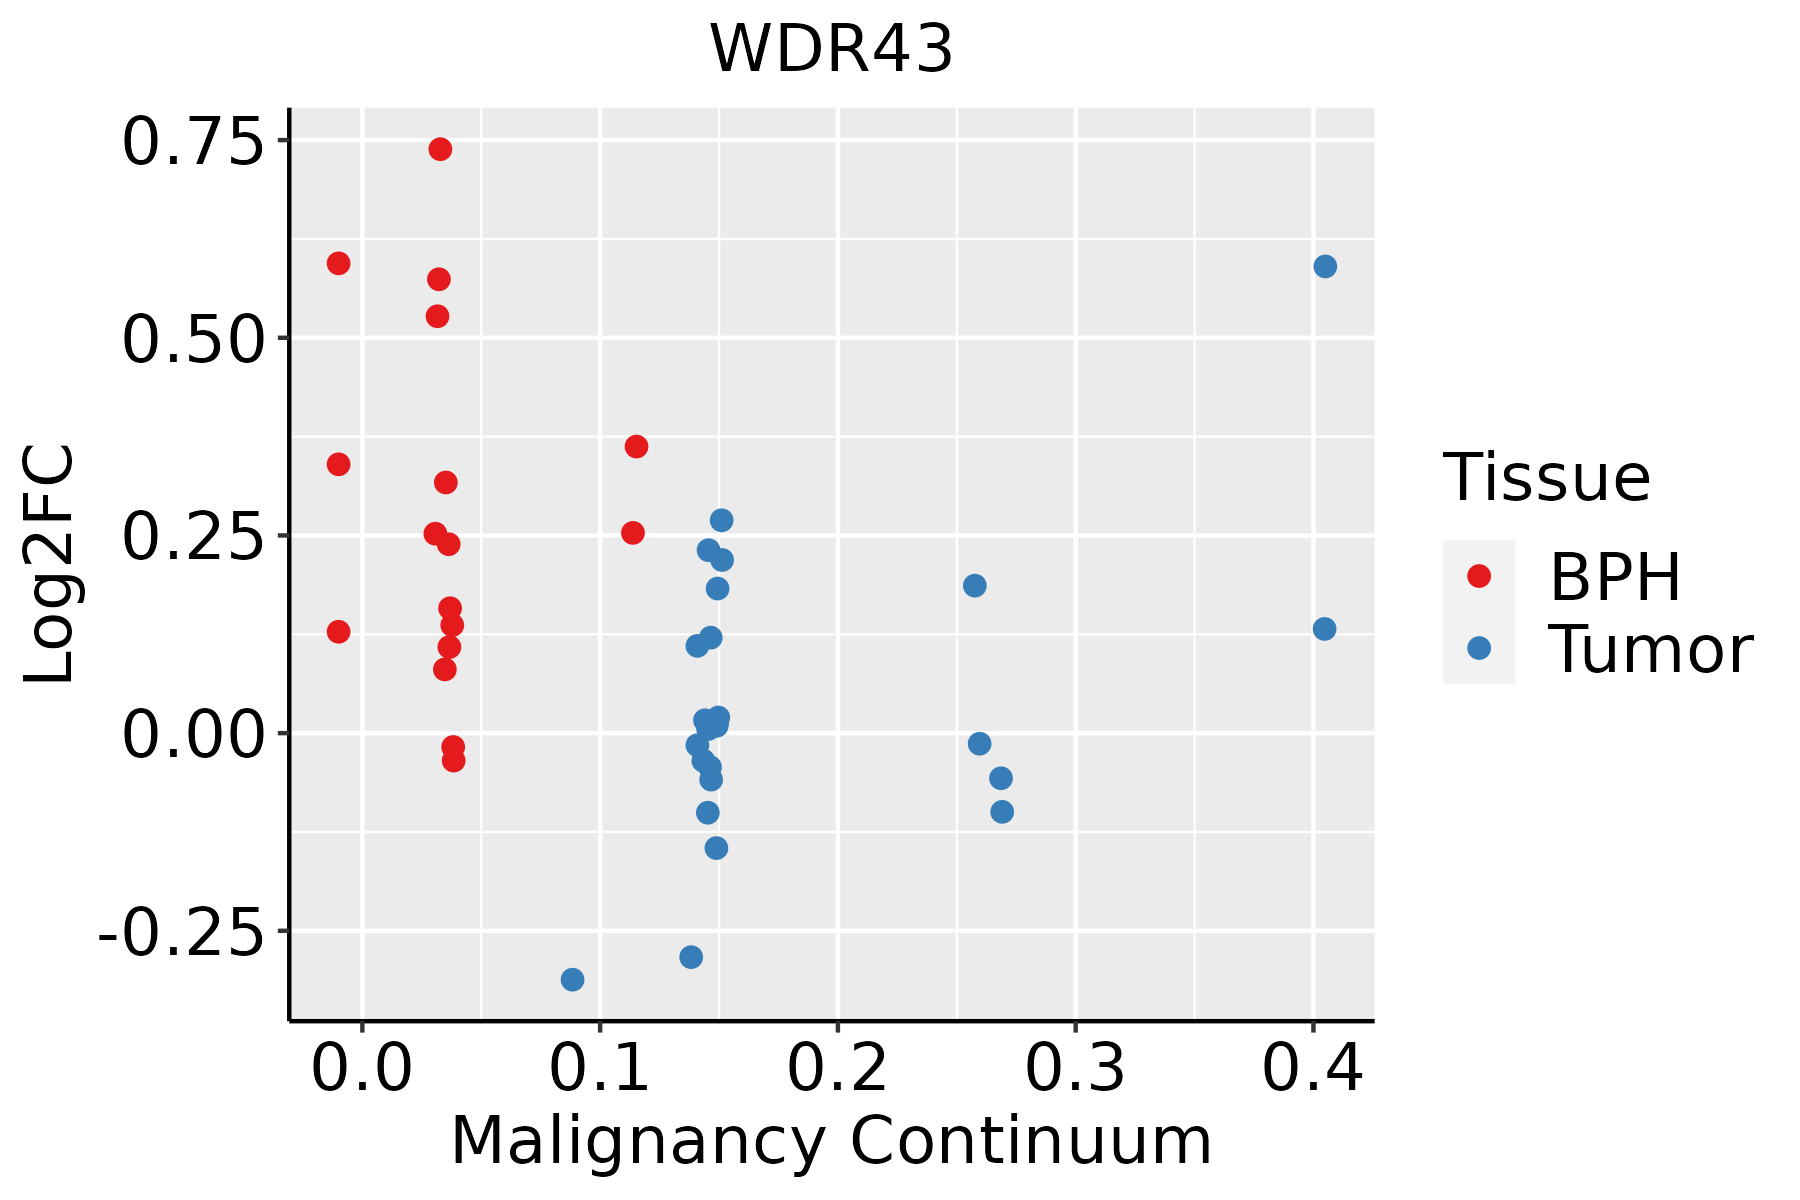 | BPH: Benign Prostatic Hyperplasia |
| Skin | 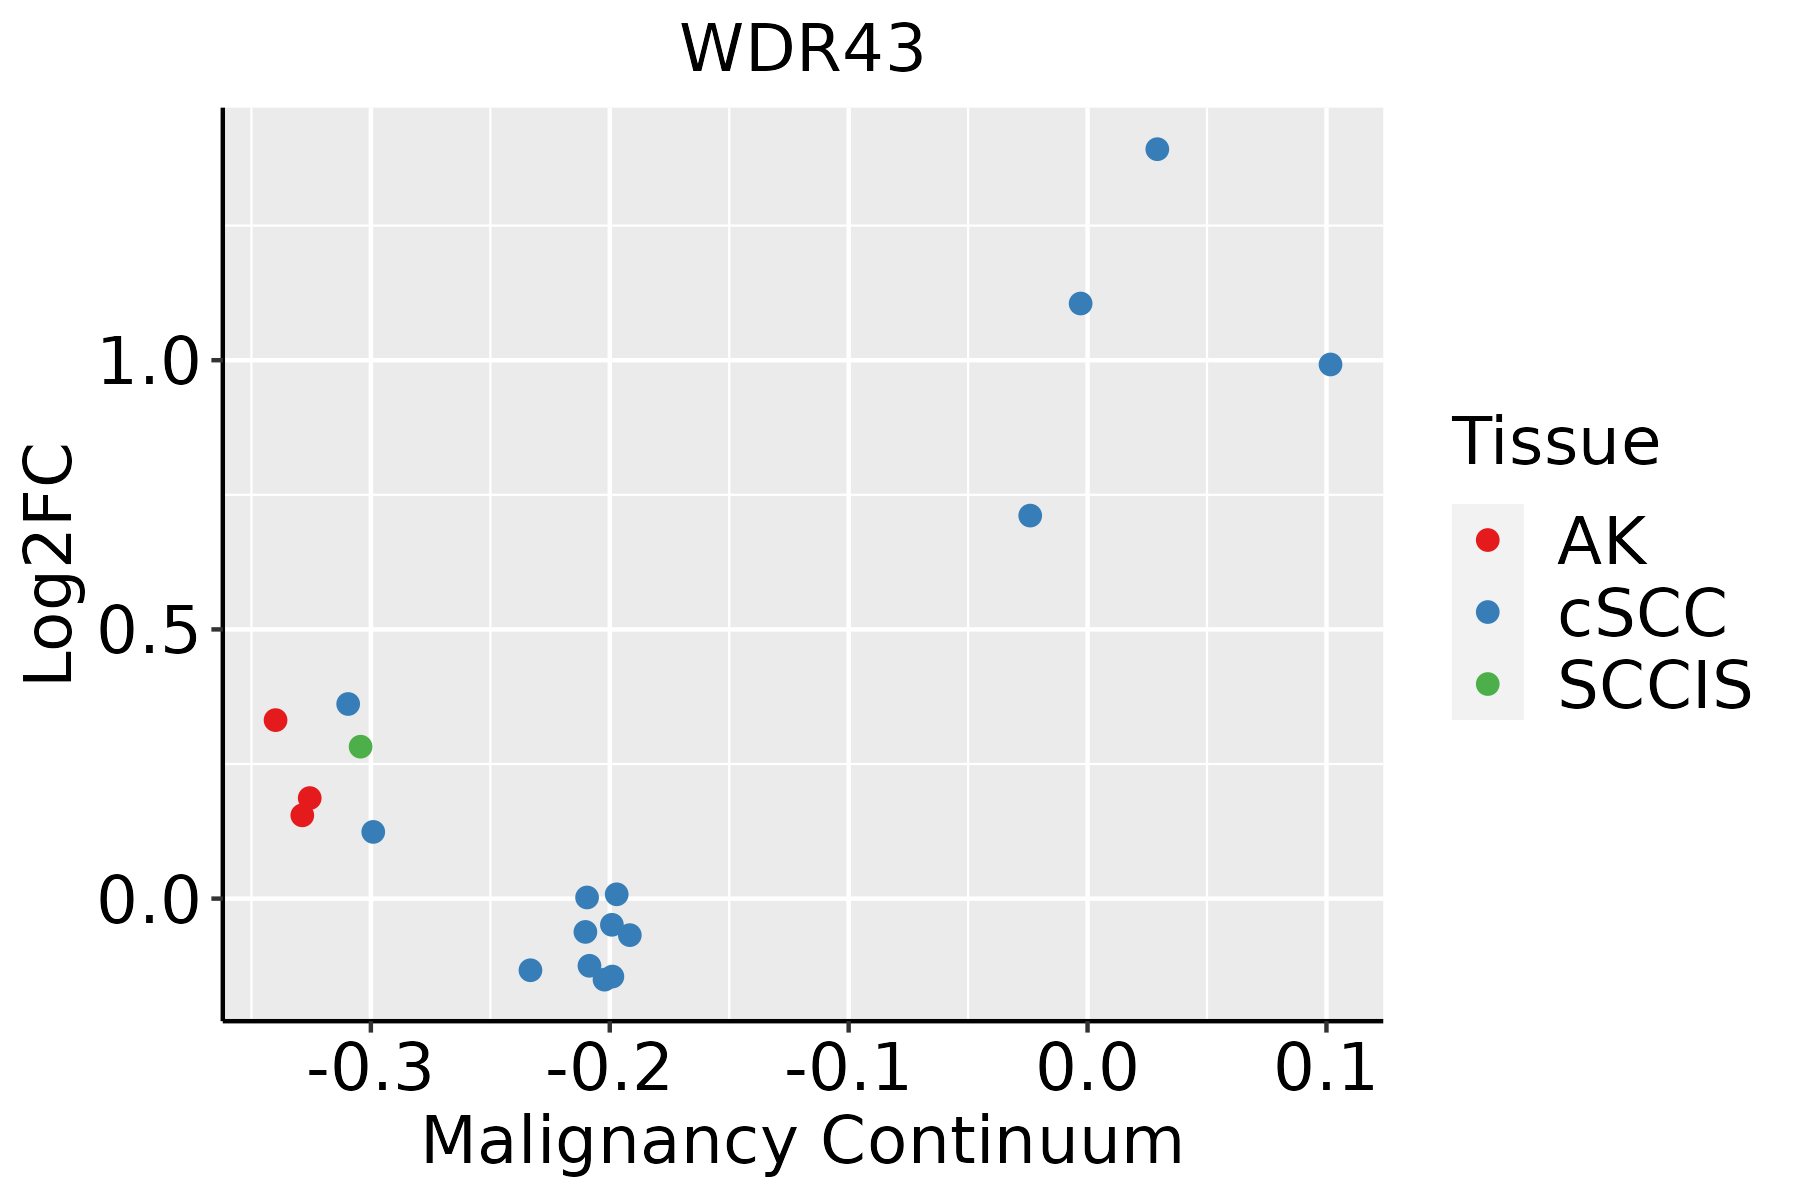 | AK: Actinic keratosis |
| cSCC: Cutaneous squamous cell carcinoma | ||
| SCCIS:squamous cell carcinoma in situ | ||
| Thyroid |  | ATC: Anaplastic thyroid cancer |
| HT: Hashimoto's thyroiditis | ||
| PTC: Papillary thyroid cancer |
| ∗log2FC in expression of this searched gene in stem-like cells from each diseased tissue sample relative to stem-like cells in normal samples in each tissue plotted against the malignancy continuum. Samples are colored based on if they are from different disease stage. |
Top |
Malignant transformation related pathway analysis |
| Find out the enriched GO biological processes and KEGG pathways involved in transition from healthy to precancer to cancer |
| Tissue | Disease Stage | Enriched GO biological Processes |
| Colorectum | AD |  |
| Colorectum | SER |  |
| Colorectum | MSS |  |
| Colorectum | MSI-H |  |
| Colorectum | FAP |  |
| ∗Top 15 enriched GO BP terms are showed in the bar plot of each disease state in each tissue. Each row represents a significant GO biological process which is colored according to the -log10(p.adjust). |
| Page: 1 2 3 4 5 6 7 8 9 |
| GO ID | Tissue | Disease Stage | Description | Gene Ratio | Bg Ratio | pvalue | p.adjust | Count |
| GO:002261310 | Cervix | CC | ribonucleoprotein complex biogenesis | 88/2311 | 463/18723 | 2.11e-05 | 3.82e-04 | 88 |
| GO:004225410 | Cervix | CC | ribosome biogenesis | 62/2311 | 299/18723 | 2.48e-05 | 4.27e-04 | 62 |
| GO:00987275 | Cervix | CC | maintenance of cell number | 30/2311 | 134/18723 | 7.98e-04 | 7.00e-03 | 30 |
| GO:00198274 | Cervix | CC | stem cell population maintenance | 29/2311 | 131/18723 | 1.17e-03 | 9.47e-03 | 29 |
| GO:00063684 | Cervix | CC | transcription elongation from RNA polymerase II promoter | 17/2311 | 69/18723 | 3.65e-03 | 2.33e-02 | 17 |
| GO:00063545 | Cervix | CC | DNA-templated transcription, elongation | 20/2311 | 91/18723 | 6.88e-03 | 3.74e-02 | 20 |
| GO:00160727 | Cervix | CC | rRNA metabolic process | 42/2311 | 236/18723 | 9.12e-03 | 4.60e-02 | 42 |
| GO:002261325 | Cervix | N_HPV | ribonucleoprotein complex biogenesis | 30/534 | 463/18723 | 2.78e-05 | 7.49e-04 | 30 |
| GO:004225424 | Cervix | N_HPV | ribosome biogenesis | 21/534 | 299/18723 | 1.46e-04 | 2.68e-03 | 21 |
| GO:000636415 | Cervix | N_HPV | rRNA processing | 14/534 | 225/18723 | 5.35e-03 | 3.84e-02 | 14 |
| GO:0022613 | Colorectum | AD | ribonucleoprotein complex biogenesis | 151/3918 | 463/18723 | 1.96e-09 | 1.39e-07 | 151 |
| GO:0042254 | Colorectum | AD | ribosome biogenesis | 84/3918 | 299/18723 | 1.82e-03 | 1.50e-02 | 84 |
| GO:0006354 | Colorectum | AD | DNA-templated transcription, elongation | 31/3918 | 91/18723 | 2.46e-03 | 1.90e-02 | 31 |
| GO:0006368 | Colorectum | AD | transcription elongation from RNA polymerase II promoter | 24/3918 | 69/18723 | 5.35e-03 | 3.52e-02 | 24 |
| GO:00226131 | Colorectum | SER | ribonucleoprotein complex biogenesis | 112/2897 | 463/18723 | 5.01e-07 | 2.48e-05 | 112 |
| GO:00422541 | Colorectum | SER | ribosome biogenesis | 66/2897 | 299/18723 | 1.48e-03 | 1.60e-02 | 66 |
| GO:00226132 | Colorectum | MSS | ribonucleoprotein complex biogenesis | 144/3467 | 463/18723 | 2.76e-11 | 3.67e-09 | 144 |
| GO:00422542 | Colorectum | MSS | ribosome biogenesis | 79/3467 | 299/18723 | 4.32e-04 | 5.23e-03 | 79 |
| GO:00063541 | Colorectum | MSS | DNA-templated transcription, elongation | 29/3467 | 91/18723 | 1.52e-03 | 1.39e-02 | 29 |
| GO:0006364 | Colorectum | MSS | rRNA processing | 58/3467 | 225/18723 | 4.17e-03 | 3.03e-02 | 58 |
| Page: 1 2 3 4 5 6 7 8 9 10 |
| Pathway ID | Tissue | Disease Stage | Description | Gene Ratio | Bg Ratio | pvalue | p.adjust | qvalue | Count |
| Page: 1 |
Top |
Cell-cell communication analysis |
| Identification of potential cell-cell interactions between two cell types and their ligand-receptor pairs for different disease states |
| Ligand | Receptor | LRpair | Pathway | Tissue | Disease Stage |
| Page: 1 |
Top |
Single-cell gene regulatory network inference analysis |
| Find out the significant the regulons (TFs) and the target genes of each regulon across cell types for different disease states |
| TF | Cell Type | Tissue | Disease Stage | Target Gene | RSS | Regulon Activity |
| ∗The dot plots of a searched regulon are shown for all cell subpopulations in each disease state of each tissue based on the regulon specific score inferred using pySCENIC and by calculating the average expression. |
| Page: 1 |
Top |
Somatic mutation of malignant transformation related genes |
| Annotation of somatic variants for genes involved in malignant transformation |
| Hugo Symbol | Variant Class | Variant Classification | dbSNP RS | HGVSc | HGVSp | HGVSp Short | SWISSPROT | BIOTYPE | SIFT | PolyPhen | Tumor Sample Barcode | Tissue | Histology | Sex | Age | Stage | Therapy Types | Drugs | Outcome |
| WDR43 | SNV | Missense_Mutation | rs752884679 | c.1376N>T | p.Thr459Met | p.T459M | Q15061 | protein_coding | deleterious(0) | benign(0.037) | TCGA-A2-A0CX-01 | Breast | breast invasive carcinoma | Female | <65 | I/II | Chemotherapy | adriamycin | SD |
| WDR43 | SNV | Missense_Mutation | rs779467686 | c.563N>A | p.Arg188Gln | p.R188Q | Q15061 | protein_coding | tolerated(0.07) | possibly_damaging(0.616) | TCGA-BH-A1EV-01 | Breast | breast invasive carcinoma | Female | <65 | III/IV | Unknown | Unknown | PD |
| WDR43 | insertion | Frame_Shift_Ins | novel | c.1421_1422insCCCACTCAACCAAAAG | p.Phe475ProfsTer7 | p.F475Pfs*7 | Q15061 | protein_coding | TCGA-AO-A0JB-01 | Breast | breast invasive carcinoma | Female | <65 | III/IV | Chemotherapy | cyclophosphamide | SD | ||
| WDR43 | insertion | In_Frame_Ins | novel | c.2013_2014insTTT | p.Glu671_Asn672insPhe | p.E671_N672insF | Q15061 | protein_coding | TCGA-AR-A0U2-01 | Breast | breast invasive carcinoma | Female | <65 | III/IV | Hormone Therapy | tamoxiphen | PD | ||
| WDR43 | insertion | Frame_Shift_Ins | novel | c.2014_2015insCTTTTAGAAAT | p.Asn672ThrfsTer75 | p.N672Tfs*75 | Q15061 | protein_coding | TCGA-AR-A0U2-01 | Breast | breast invasive carcinoma | Female | <65 | III/IV | Hormone Therapy | tamoxiphen | PD | ||
| WDR43 | SNV | Missense_Mutation | rs371667538 | c.1393C>T | p.Leu465Phe | p.L465F | Q15061 | protein_coding | deleterious(0) | probably_damaging(0.974) | TCGA-EK-A3GK-01 | Cervix | cervical & endocervical cancer | Female | <65 | I/II | Unknown | Unknown | SD |
| WDR43 | SNV | Missense_Mutation | rs775251293 | c.862G>A | p.Ala288Thr | p.A288T | Q15061 | protein_coding | tolerated(0.13) | probably_damaging(0.942) | TCGA-AA-3510-01 | Colorectum | colon adenocarcinoma | Male | >=65 | I/II | Unknown | Unknown | SD |
| WDR43 | SNV | Missense_Mutation | novel | c.1741N>A | p.Ala581Thr | p.A581T | Q15061 | protein_coding | tolerated(0.21) | benign(0.012) | TCGA-AA-A010-01 | Colorectum | colon adenocarcinoma | Female | <65 | I/II | Chemotherapy | folinic | CR |
| WDR43 | SNV | Missense_Mutation | c.544N>G | p.Met182Val | p.M182V | Q15061 | protein_coding | tolerated(0.46) | benign(0.05) | TCGA-AA-A01V-01 | Colorectum | colon adenocarcinoma | Male | <65 | I/II | Unknown | Unknown | SD | |
| WDR43 | SNV | Missense_Mutation | novel | c.1102G>A | p.Glu368Lys | p.E368K | Q15061 | protein_coding | deleterious(0.01) | benign(0.24) | TCGA-AG-3892-01 | Colorectum | rectum adenocarcinoma | Female | <65 | I/II | Unknown | Unknown | SD |
| Page: 1 2 3 4 5 6 |
Top |
Related drugs of malignant transformation related genes |
| Identification of chemicals and drugs interact with genes involved in malignant transfromation |
| (DGIdb 4.0) |
| Entrez ID | Symbol | Category | Interaction Types | Drug Claim Name | Drug Name | PMIDs |
| Page: 1 |

Copyright 2023-Present -The University of Texas Health Science Center at Houston |