
|
|||||
|
 | |
| |
| |
| |
| |
| |
|
Gene: WDR41 |
Gene summary for WDR41 |
| Gene information | Species | Human | Gene symbol | WDR41 | Gene ID | 55255 |
| Gene name | WD repeat domain 41 | |
| Gene Alias | MSTP048 | |
| Cytomap | 5q13.3-q14.1 | |
| Gene Type | protein-coding | GO ID | GO:0006914 | UniProtAcc | A0A0S2Z5E0 |
Top |
Malignant transformation analysis |
| Identification of the aberrant gene expression in precancerous and cancerous lesions by comparing the gene expression of stem-like cells in diseased tissues with normal stem cells |
| Entrez ID | Symbol | Replicates | Species | Organ | Tissue | Adj P-value | Log2FC | Malignancy |
| 55255 | WDR41 | HTA11_78_2000001011 | Human | Colorectum | AD | 6.13e-11 | 9.90e-01 | -0.1088 |
| 55255 | WDR41 | HTA11_347_2000001011 | Human | Colorectum | AD | 3.00e-20 | 1.20e+00 | -0.1954 |
| 55255 | WDR41 | HTA11_99999965104_69814 | Human | Colorectum | MSS | 7.42e-56 | 3.74e+00 | 0.281 |
| 55255 | WDR41 | HTA11_99999971662_82457 | Human | Colorectum | MSS | 1.00e-04 | 4.11e-01 | 0.3859 |
| 55255 | WDR41 | A015-C-203 | Human | Colorectum | FAP | 6.13e-08 | -2.48e-01 | -0.1294 |
| 55255 | WDR41 | A002-C-201 | Human | Colorectum | FAP | 2.70e-04 | -2.62e-01 | 0.0324 |
| 55255 | WDR41 | A001-C-108 | Human | Colorectum | FAP | 1.32e-05 | -2.22e-01 | -0.0272 |
| 55255 | WDR41 | A002-C-205 | Human | Colorectum | FAP | 3.11e-05 | -2.46e-01 | -0.1236 |
| 55255 | WDR41 | A015-C-006 | Human | Colorectum | FAP | 2.58e-02 | -2.03e-01 | -0.0994 |
| 55255 | WDR41 | A015-C-106 | Human | Colorectum | FAP | 1.10e-03 | -2.21e-01 | -0.0511 |
| 55255 | WDR41 | A002-C-114 | Human | Colorectum | FAP | 1.40e-05 | -2.90e-01 | -0.1561 |
| 55255 | WDR41 | A015-C-104 | Human | Colorectum | FAP | 2.63e-11 | -3.17e-01 | -0.1899 |
| 55255 | WDR41 | A002-C-016 | Human | Colorectum | FAP | 1.12e-04 | -2.35e-01 | 0.0521 |
| 55255 | WDR41 | A001-C-007 | Human | Colorectum | CRC | 3.38e-03 | -3.25e-01 | 0.1899 |
| 55255 | WDR41 | A001-C-203 | Human | Colorectum | FAP | 2.42e-02 | -1.86e-01 | -0.0481 |
| 55255 | WDR41 | A002-C-116 | Human | Colorectum | FAP | 2.33e-09 | -2.64e-01 | -0.0452 |
| 55255 | WDR41 | A018-E-020 | Human | Colorectum | FAP | 1.08e-03 | -2.41e-01 | -0.2034 |
| 55255 | WDR41 | F034 | Human | Colorectum | FAP | 2.12e-06 | -2.43e-01 | -0.0665 |
| 55255 | WDR41 | F072B | Human | Colorectum | FAP | 5.35e-05 | -2.26e-01 | 0.257 |
| 55255 | WDR41 | CRC-3-11773 | Human | Colorectum | CRC | 1.35e-02 | -2.00e-01 | 0.2564 |
| Page: 1 2 3 4 5 6 |
| Tissue | Expression Dynamics | Abbreviation |
| Colorectum (GSE201348) |  | FAP: Familial adenomatous polyposis |
| CRC: Colorectal cancer | ||
| Colorectum (HTA11) | 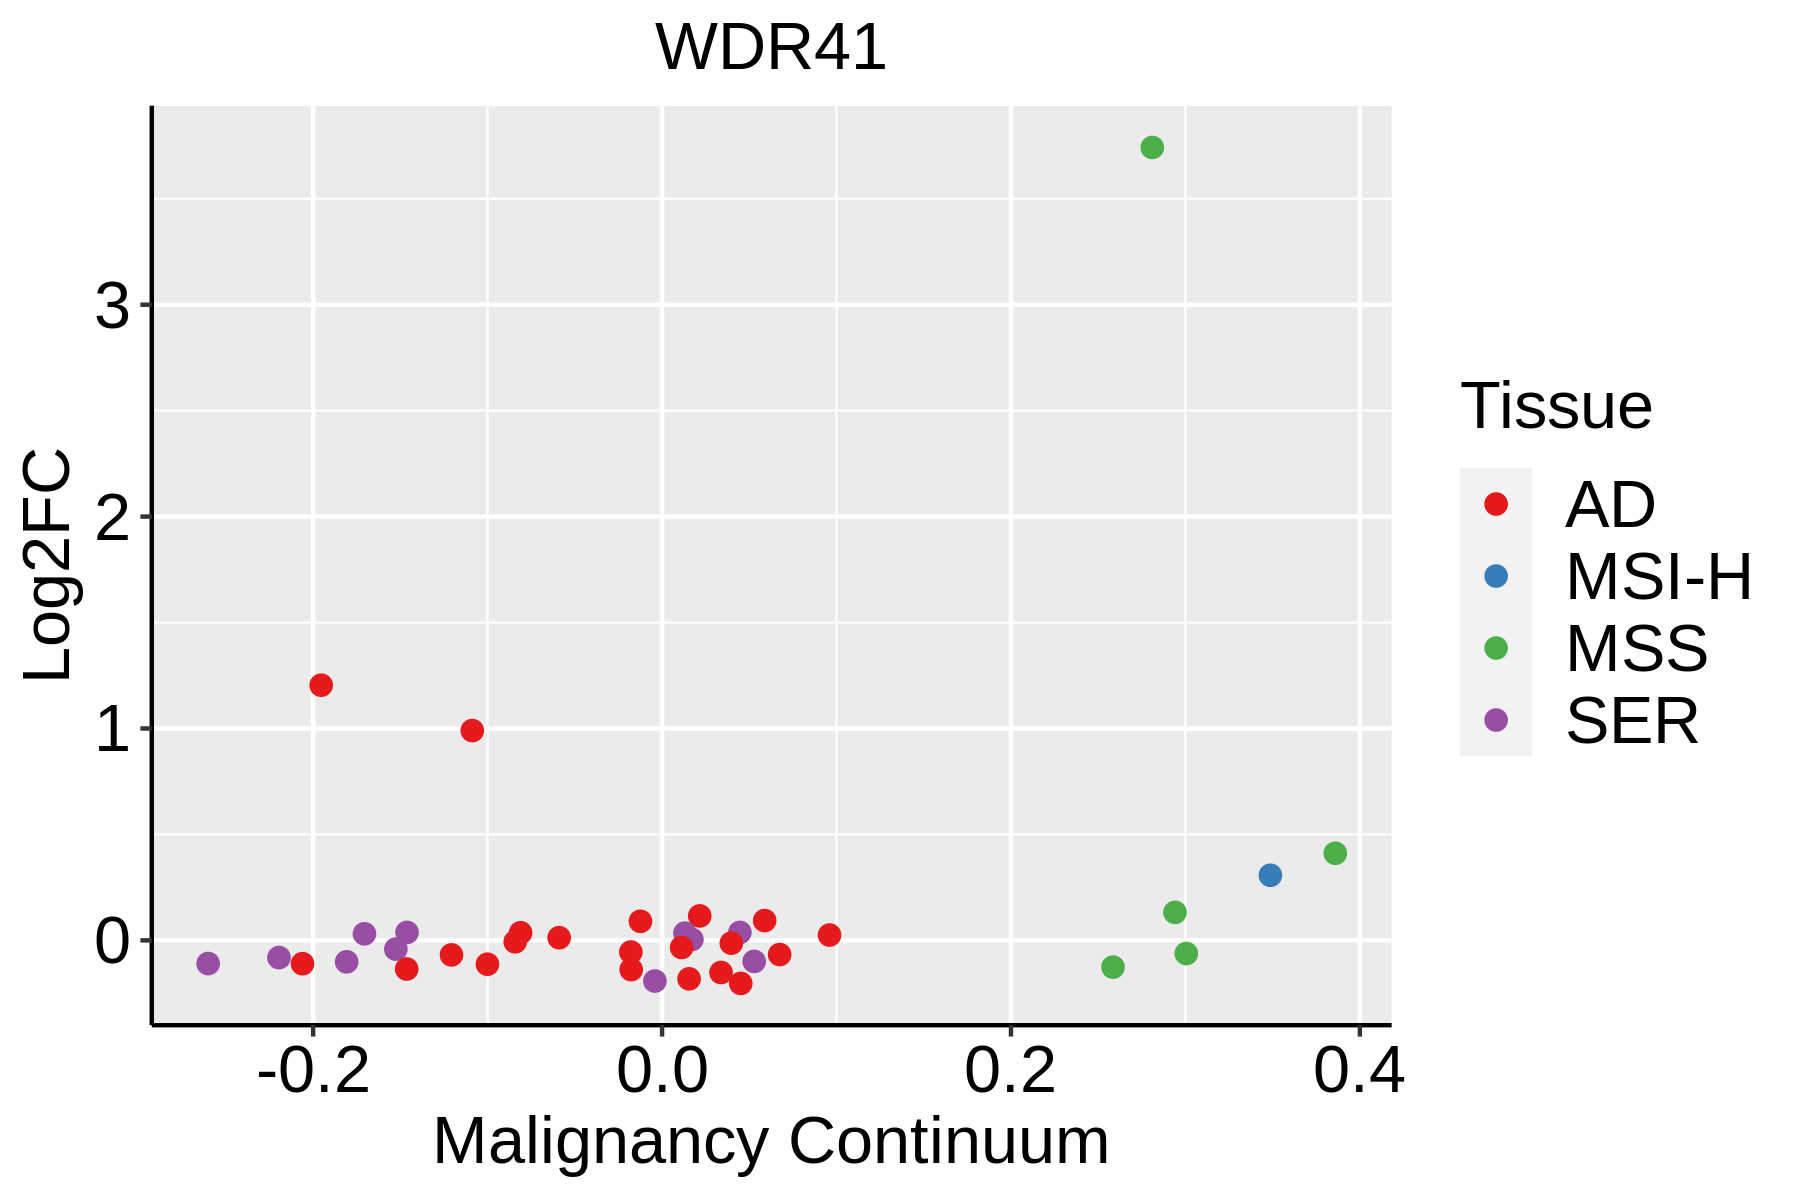 | AD: Adenomas |
| SER: Sessile serrated lesions | ||
| MSI-H: Microsatellite-high colorectal cancer | ||
| MSS: Microsatellite stable colorectal cancer | ||
| Esophagus | 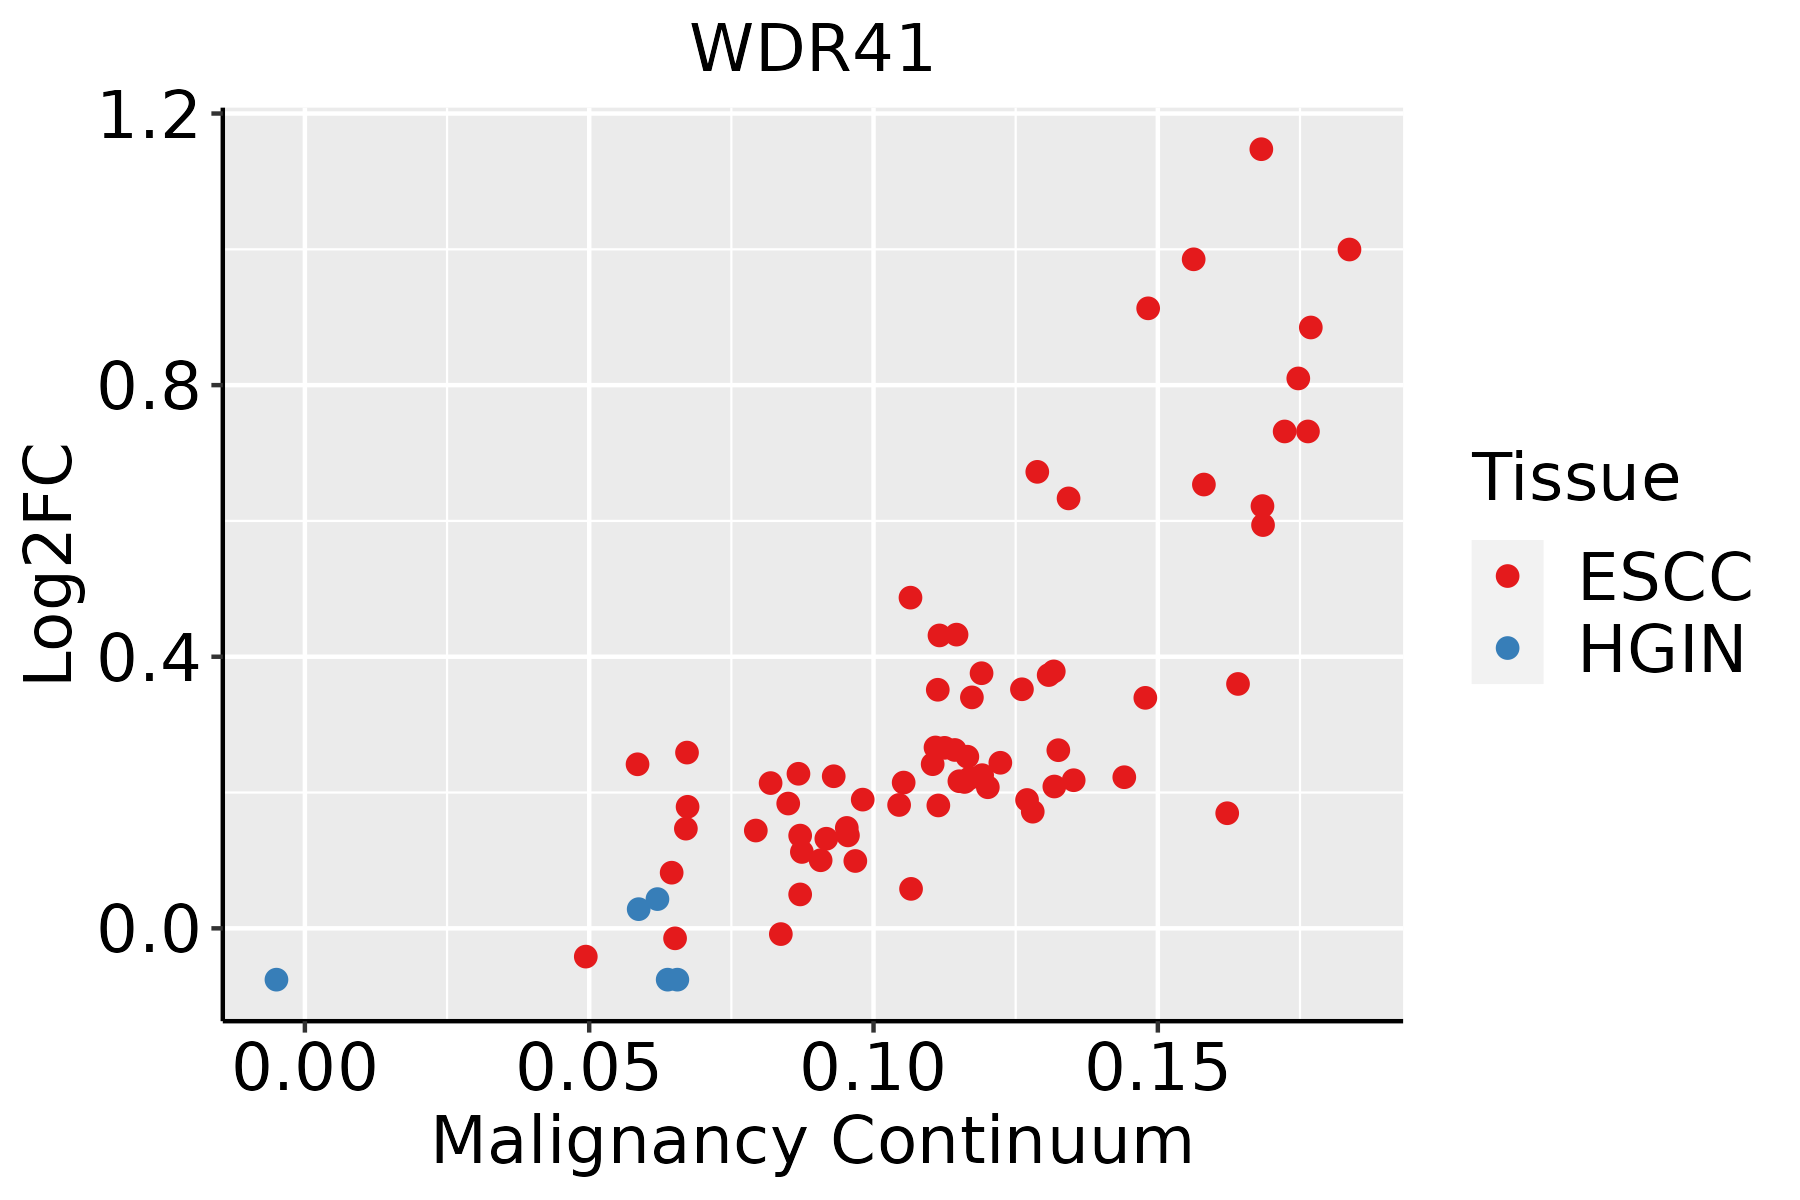 | ESCC: Esophageal squamous cell carcinoma |
| HGIN: High-grade intraepithelial neoplasias | ||
| LGIN: Low-grade intraepithelial neoplasias | ||
| Oral Cavity | 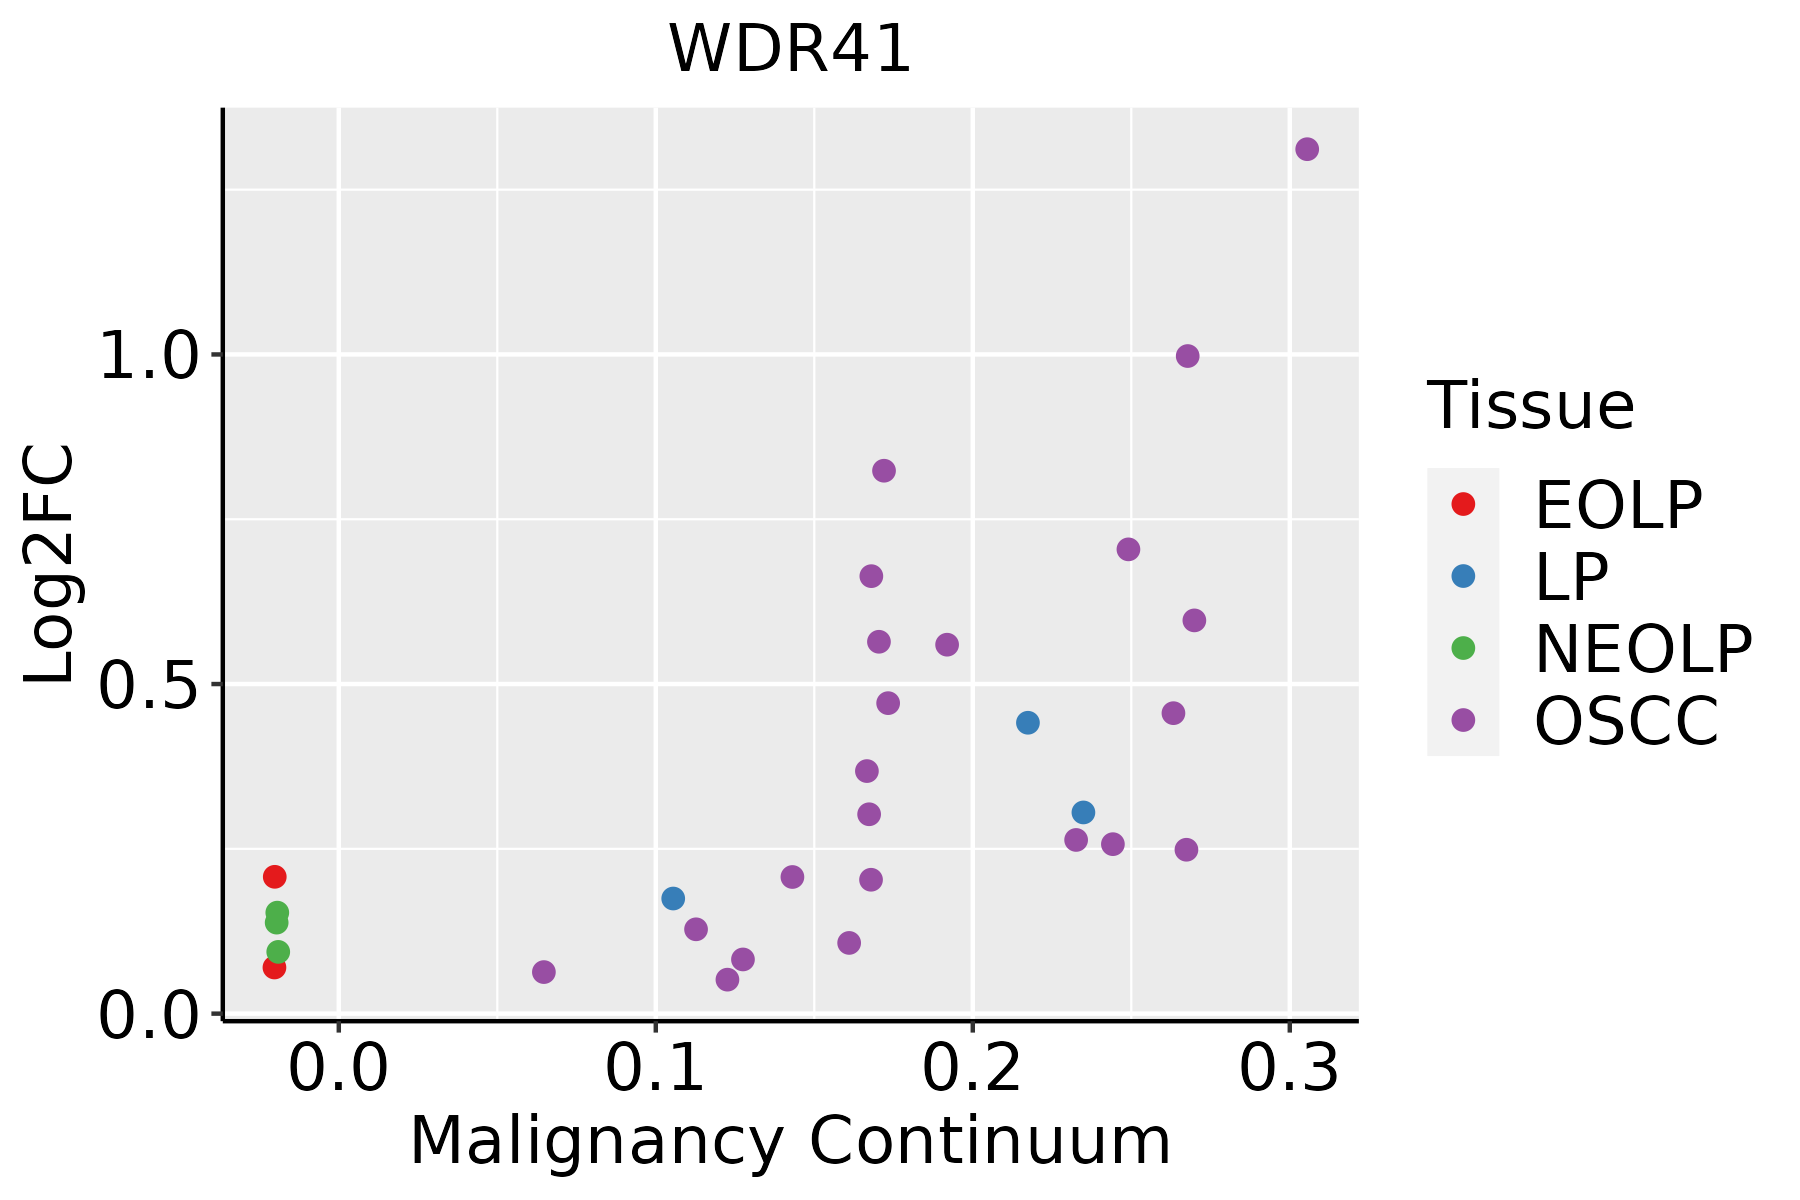 | EOLP: Erosive Oral lichen planus |
| LP: leukoplakia | ||
| NEOLP: Non-erosive oral lichen planus | ||
| OSCC: Oral squamous cell carcinoma | ||
| Skin | 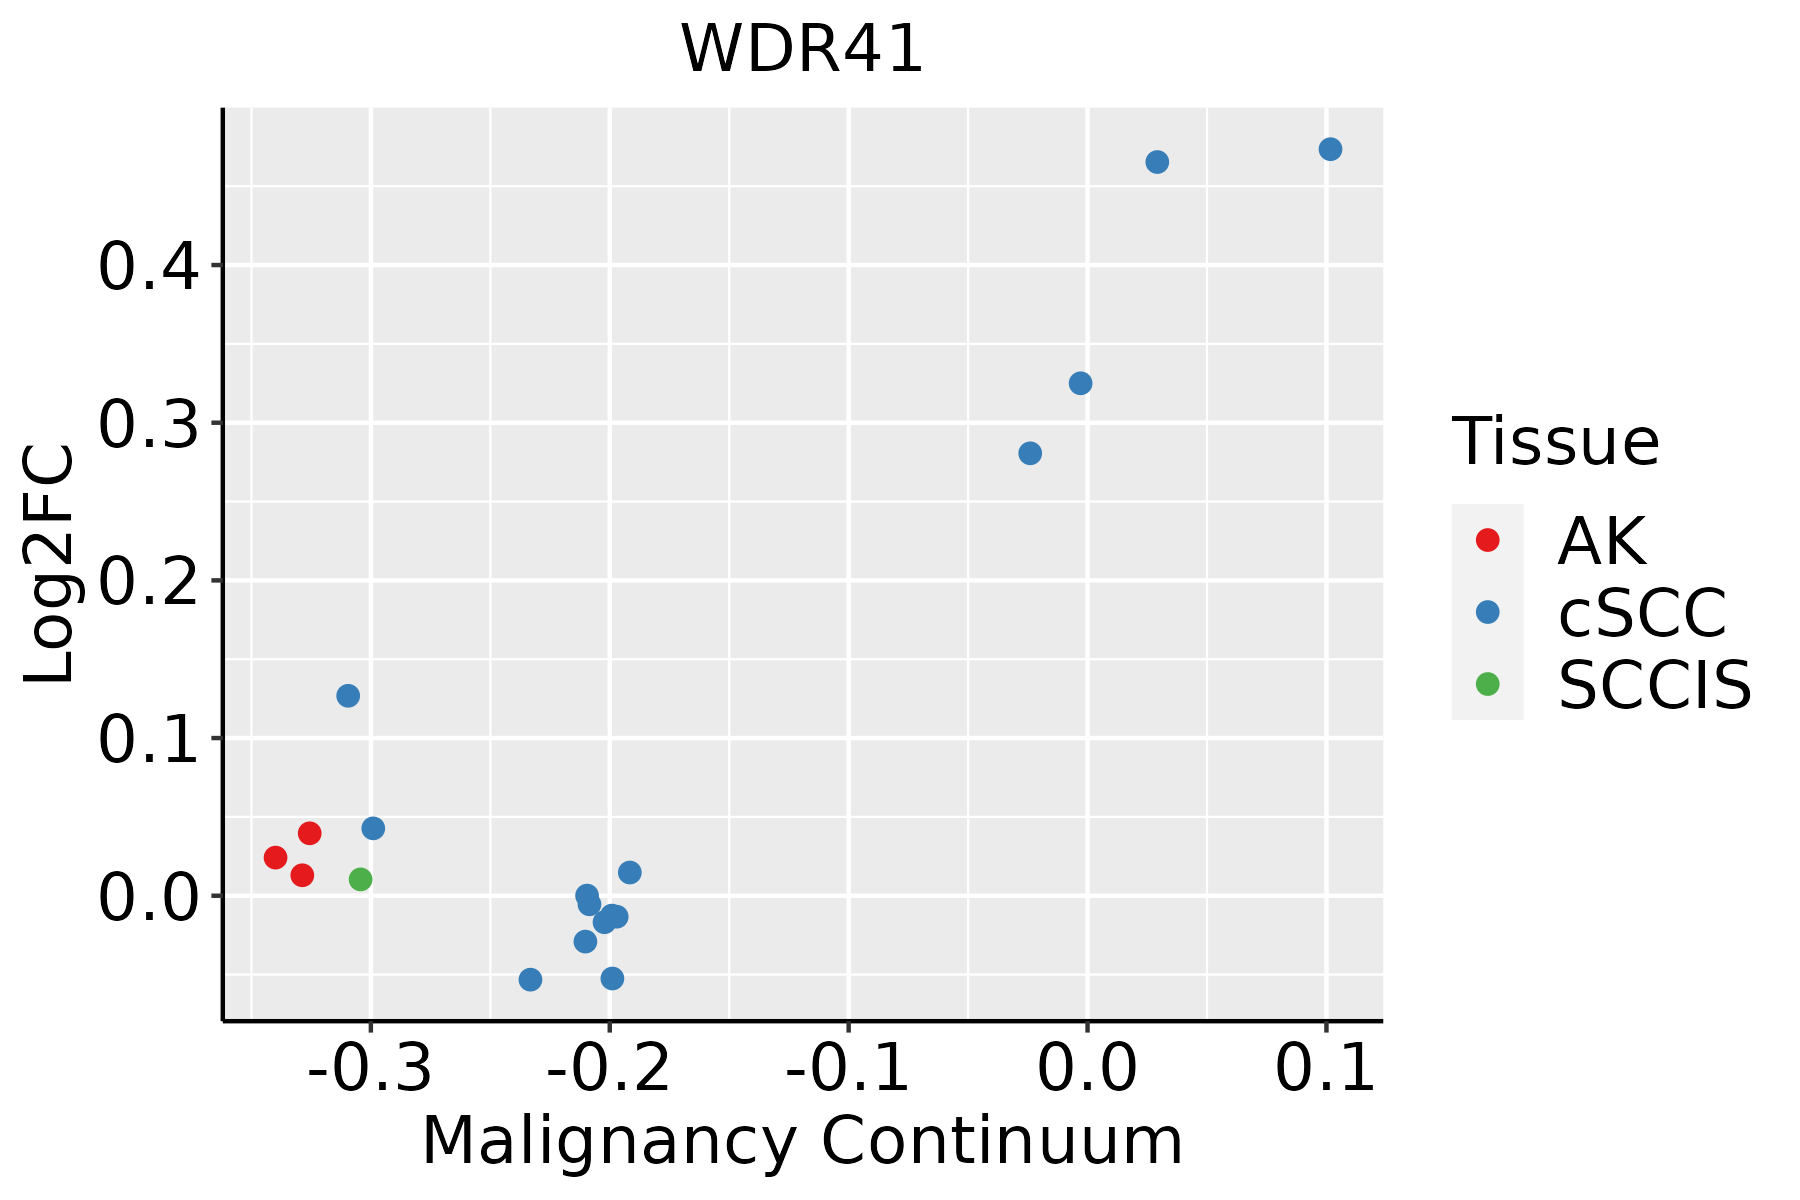 | AK: Actinic keratosis |
| cSCC: Cutaneous squamous cell carcinoma | ||
| SCCIS:squamous cell carcinoma in situ | ||
| Thyroid |  | ATC: Anaplastic thyroid cancer |
| HT: Hashimoto's thyroiditis | ||
| PTC: Papillary thyroid cancer |
| ∗log2FC in expression of this searched gene in stem-like cells from each diseased tissue sample relative to stem-like cells in normal samples in each tissue plotted against the malignancy continuum. Samples are colored based on if they are from different disease stage. |
Top |
Malignant transformation related pathway analysis |
| Find out the enriched GO biological processes and KEGG pathways involved in transition from healthy to precancer to cancer |
| Tissue | Disease Stage | Enriched GO biological Processes |
| Colorectum | AD |  |
| Colorectum | SER |  |
| Colorectum | MSS |  |
| Colorectum | MSI-H |  |
| Colorectum | FAP |  |
| ∗Top 15 enriched GO BP terms are showed in the bar plot of each disease state in each tissue. Each row represents a significant GO biological process which is colored according to the -log10(p.adjust). |
| Page: 1 2 3 4 5 6 7 8 9 |
| GO ID | Tissue | Disease Stage | Description | Gene Ratio | Bg Ratio | pvalue | p.adjust | Count |
| GO:0010506 | Colorectum | AD | regulation of autophagy | 111/3918 | 317/18723 | 3.57e-09 | 2.35e-07 | 111 |
| GO:00105062 | Colorectum | MSS | regulation of autophagy | 95/3467 | 317/18723 | 4.36e-07 | 1.71e-05 | 95 |
| GO:00105063 | Colorectum | FAP | regulation of autophagy | 80/2622 | 317/18723 | 6.43e-08 | 4.54e-06 | 80 |
| GO:00105064 | Colorectum | CRC | regulation of autophagy | 62/2078 | 317/18723 | 6.04e-06 | 2.35e-04 | 62 |
| GO:001050617 | Esophagus | ESCC | regulation of autophagy | 220/8552 | 317/18723 | 6.72e-18 | 6.36e-16 | 220 |
| GO:001050610 | Oral cavity | OSCC | regulation of autophagy | 198/7305 | 317/18723 | 1.63e-17 | 1.51e-15 | 198 |
| GO:001050622 | Oral cavity | EOLP | regulation of autophagy | 74/2218 | 317/18723 | 5.84e-09 | 3.07e-07 | 74 |
| GO:001050631 | Oral cavity | NEOLP | regulation of autophagy | 60/2005 | 317/18723 | 8.06e-06 | 1.57e-04 | 60 |
| GO:001050619 | Skin | cSCC | regulation of autophagy | 127/4864 | 317/18723 | 2.36e-08 | 6.71e-07 | 127 |
| GO:0010506110 | Thyroid | PTC | regulation of autophagy | 172/5968 | 317/18723 | 8.76e-17 | 7.57e-15 | 172 |
| GO:001050632 | Thyroid | ATC | regulation of autophagy | 180/6293 | 317/18723 | 1.34e-17 | 1.46e-15 | 180 |
| Page: 1 |
| Pathway ID | Tissue | Disease Stage | Description | Gene Ratio | Bg Ratio | pvalue | p.adjust | qvalue | Count |
| hsa05014 | Colorectum | AD | Amyotrophic lateral sclerosis | 164/2092 | 364/8465 | 4.28e-18 | 1.27e-16 | 8.09e-17 | 164 |
| hsa05022 | Colorectum | AD | Pathways of neurodegeneration - multiple diseases | 201/2092 | 476/8465 | 4.54e-18 | 1.27e-16 | 8.09e-17 | 201 |
| hsa04140 | Colorectum | AD | Autophagy - animal | 49/2092 | 141/8465 | 4.58e-03 | 2.20e-02 | 1.40e-02 | 49 |
| hsa050141 | Colorectum | AD | Amyotrophic lateral sclerosis | 164/2092 | 364/8465 | 4.28e-18 | 1.27e-16 | 8.09e-17 | 164 |
| hsa050221 | Colorectum | AD | Pathways of neurodegeneration - multiple diseases | 201/2092 | 476/8465 | 4.54e-18 | 1.27e-16 | 8.09e-17 | 201 |
| hsa041401 | Colorectum | AD | Autophagy - animal | 49/2092 | 141/8465 | 4.58e-03 | 2.20e-02 | 1.40e-02 | 49 |
| hsa050224 | Colorectum | MSS | Pathways of neurodegeneration - multiple diseases | 192/1875 | 476/8465 | 2.79e-20 | 1.04e-18 | 6.36e-19 | 192 |
| hsa050144 | Colorectum | MSS | Amyotrophic lateral sclerosis | 156/1875 | 364/8465 | 1.43e-19 | 4.62e-18 | 2.83e-18 | 156 |
| hsa041404 | Colorectum | MSS | Autophagy - animal | 45/1875 | 141/8465 | 4.42e-03 | 1.90e-02 | 1.16e-02 | 45 |
| hsa050225 | Colorectum | MSS | Pathways of neurodegeneration - multiple diseases | 192/1875 | 476/8465 | 2.79e-20 | 1.04e-18 | 6.36e-19 | 192 |
| hsa050145 | Colorectum | MSS | Amyotrophic lateral sclerosis | 156/1875 | 364/8465 | 1.43e-19 | 4.62e-18 | 2.83e-18 | 156 |
| hsa041405 | Colorectum | MSS | Autophagy - animal | 45/1875 | 141/8465 | 4.42e-03 | 1.90e-02 | 1.16e-02 | 45 |
| hsa050228 | Colorectum | FAP | Pathways of neurodegeneration - multiple diseases | 117/1404 | 476/8465 | 2.81e-06 | 4.47e-05 | 2.72e-05 | 117 |
| hsa050148 | Colorectum | FAP | Amyotrophic lateral sclerosis | 91/1404 | 364/8465 | 1.84e-05 | 2.36e-04 | 1.44e-04 | 91 |
| hsa050229 | Colorectum | FAP | Pathways of neurodegeneration - multiple diseases | 117/1404 | 476/8465 | 2.81e-06 | 4.47e-05 | 2.72e-05 | 117 |
| hsa050149 | Colorectum | FAP | Amyotrophic lateral sclerosis | 91/1404 | 364/8465 | 1.84e-05 | 2.36e-04 | 1.44e-04 | 91 |
| hsa05014210 | Esophagus | ESCC | Amyotrophic lateral sclerosis | 266/4205 | 364/8465 | 1.31e-20 | 2.20e-18 | 1.13e-18 | 266 |
| hsa05022210 | Esophagus | ESCC | Pathways of neurodegeneration - multiple diseases | 318/4205 | 476/8465 | 6.10e-15 | 2.04e-13 | 1.05e-13 | 318 |
| hsa0414010 | Esophagus | ESCC | Autophagy - animal | 101/4205 | 141/8465 | 7.60e-08 | 6.21e-07 | 3.18e-07 | 101 |
| hsa0501438 | Esophagus | ESCC | Amyotrophic lateral sclerosis | 266/4205 | 364/8465 | 1.31e-20 | 2.20e-18 | 1.13e-18 | 266 |
| Page: 1 2 |
Top |
Cell-cell communication analysis |
| Identification of potential cell-cell interactions between two cell types and their ligand-receptor pairs for different disease states |
| Ligand | Receptor | LRpair | Pathway | Tissue | Disease Stage |
| Page: 1 |
Top |
Single-cell gene regulatory network inference analysis |
| Find out the significant the regulons (TFs) and the target genes of each regulon across cell types for different disease states |
| TF | Cell Type | Tissue | Disease Stage | Target Gene | RSS | Regulon Activity |
| ∗The dot plots of a searched regulon are shown for all cell subpopulations in each disease state of each tissue based on the regulon specific score inferred using pySCENIC and by calculating the average expression. |
| Page: 1 |
Top |
Somatic mutation of malignant transformation related genes |
| Annotation of somatic variants for genes involved in malignant transformation |
| Hugo Symbol | Variant Class | Variant Classification | dbSNP RS | HGVSc | HGVSp | HGVSp Short | SWISSPROT | BIOTYPE | SIFT | PolyPhen | Tumor Sample Barcode | Tissue | Histology | Sex | Age | Stage | Therapy Types | Drugs | Outcome |
| WDR41 | SNV | Missense_Mutation | rs370753681 | c.121N>C | p.Ala41Pro | p.A41P | Q9HAD4 | protein_coding | deleterious(0.02) | probably_damaging(0.937) | TCGA-D8-A1J8-01 | Breast | breast invasive carcinoma | Female | >=65 | I/II | Hormone Therapy | nolvadex | SD |
| WDR41 | SNV | Missense_Mutation | novel | c.1004G>T | p.Arg335Met | p.R335M | Q9HAD4 | protein_coding | deleterious(0.01) | probably_damaging(0.947) | TCGA-2W-A8YY-01 | Cervix | cervical & endocervical cancer | Female | <65 | I/II | Chemotherapy | cisplatin | CR |
| WDR41 | SNV | Missense_Mutation | c.893N>A | p.Ala298Asp | p.A298D | Q9HAD4 | protein_coding | deleterious(0) | benign(0.303) | TCGA-FU-A3HZ-01 | Cervix | cervical & endocervical cancer | Female | <65 | I/II | Chemotherapy | cisplatin | CR | |
| WDR41 | SNV | Missense_Mutation | c.877N>A | p.Glu293Lys | p.E293K | Q9HAD4 | protein_coding | tolerated(0.33) | benign(0.214) | TCGA-JX-A3Q0-01 | Cervix | cervical & endocervical cancer | Female | <65 | III/IV | Unknown | Unknown | SD | |
| WDR41 | SNV | Missense_Mutation | rs144473455 | c.140N>A | p.Arg47Gln | p.R47Q | Q9HAD4 | protein_coding | tolerated(0.09) | probably_damaging(0.999) | TCGA-AA-A00N-01 | Colorectum | colon adenocarcinoma | Male | >=65 | I/II | Unknown | Unknown | PD |
| WDR41 | SNV | Missense_Mutation | rs765902291 | c.692T>C | p.Val231Ala | p.V231A | Q9HAD4 | protein_coding | deleterious(0) | benign(0.166) | TCGA-AZ-6598-01 | Colorectum | colon adenocarcinoma | Female | >=65 | I/II | Unknown | Unknown | SD |
| WDR41 | SNV | Missense_Mutation | novel | c.1090N>G | p.Thr364Ala | p.T364A | Q9HAD4 | protein_coding | tolerated(0.21) | benign(0.005) | TCGA-CA-6717-01 | Colorectum | colon adenocarcinoma | Male | <65 | I/II | Chemotherapy | oxaliplatin | CR |
| WDR41 | SNV | Missense_Mutation | novel | c.258N>T | p.Lys86Asn | p.K86N | Q9HAD4 | protein_coding | tolerated(0.06) | probably_damaging(0.978) | TCGA-F5-6814-01 | Colorectum | rectum adenocarcinoma | Male | <65 | I/II | Unknown | Unknown | SD |
| WDR41 | SNV | Missense_Mutation | novel | c.31N>A | p.Glu11Lys | p.E11K | Q9HAD4 | protein_coding | tolerated(0.15) | benign(0.133) | TCGA-F5-6814-01 | Colorectum | rectum adenocarcinoma | Male | <65 | I/II | Unknown | Unknown | SD |
| WDR41 | insertion | Frame_Shift_Ins | rs748110033 | c.1101_1102insT | p.Asn368Ter | p.N368* | Q9HAD4 | protein_coding | TCGA-A6-3809-01 | Colorectum | colon adenocarcinoma | Female | >=65 | I/II | Unknown | Unknown | SD |
| Page: 1 2 3 4 |
Top |
Related drugs of malignant transformation related genes |
| Identification of chemicals and drugs interact with genes involved in malignant transfromation |
| (DGIdb 4.0) |
| Entrez ID | Symbol | Category | Interaction Types | Drug Claim Name | Drug Name | PMIDs |
| Page: 1 |

Copyright 2023-Present -The University of Texas Health Science Center at Houston |