
|
|||||
|
 | |
| |
| |
| |
| |
| |
|
Gene: WDR37 |
Gene summary for WDR37 |
| Gene information | Species | Human | Gene symbol | WDR37 | Gene ID | 22884 |
| Gene name | WD repeat domain 37 | |
| Gene Alias | NOCGUS | |
| Cytomap | 10p15.3 | |
| Gene Type | protein-coding | GO ID | GO:0005575 | UniProtAcc | Q9Y2I8 |
Top |
Malignant transformation analysis |
| Identification of the aberrant gene expression in precancerous and cancerous lesions by comparing the gene expression of stem-like cells in diseased tissues with normal stem cells |
| Entrez ID | Symbol | Replicates | Species | Organ | Tissue | Adj P-value | Log2FC | Malignancy |
| 22884 | WDR37 | CCI_1 | Human | Cervix | CC | 5.94e-11 | 6.88e-01 | 0.528 |
| 22884 | WDR37 | CCI_2 | Human | Cervix | CC | 7.01e-14 | 1.11e+00 | 0.5249 |
| 22884 | WDR37 | CCI_3 | Human | Cervix | CC | 2.71e-07 | 5.78e-01 | 0.516 |
| 22884 | WDR37 | C30 | Human | Oral cavity | OSCC | 6.68e-08 | 5.21e-01 | 0.3055 |
| 22884 | WDR37 | C46 | Human | Oral cavity | OSCC | 9.66e-08 | 4.72e-02 | 0.1673 |
| 22884 | WDR37 | C06 | Human | Oral cavity | OSCC | 4.83e-02 | 8.84e-01 | 0.2699 |
| 22884 | WDR37 | EOLP-1 | Human | Oral cavity | EOLP | 1.04e-08 | 3.03e-01 | -0.0202 |
| 22884 | WDR37 | NEOLP-3 | Human | Oral cavity | NEOLP | 5.67e-03 | 2.45e-01 | -0.0191 |
| 22884 | WDR37 | SYSMH1 | Human | Oral cavity | OSCC | 9.85e-04 | -1.11e-02 | 0.1127 |
| 22884 | WDR37 | SYSMH3 | Human | Oral cavity | OSCC | 9.08e-03 | 5.85e-02 | 0.2442 |
| Page: 1 |
| Tissue | Expression Dynamics | Abbreviation |
| Cervix | 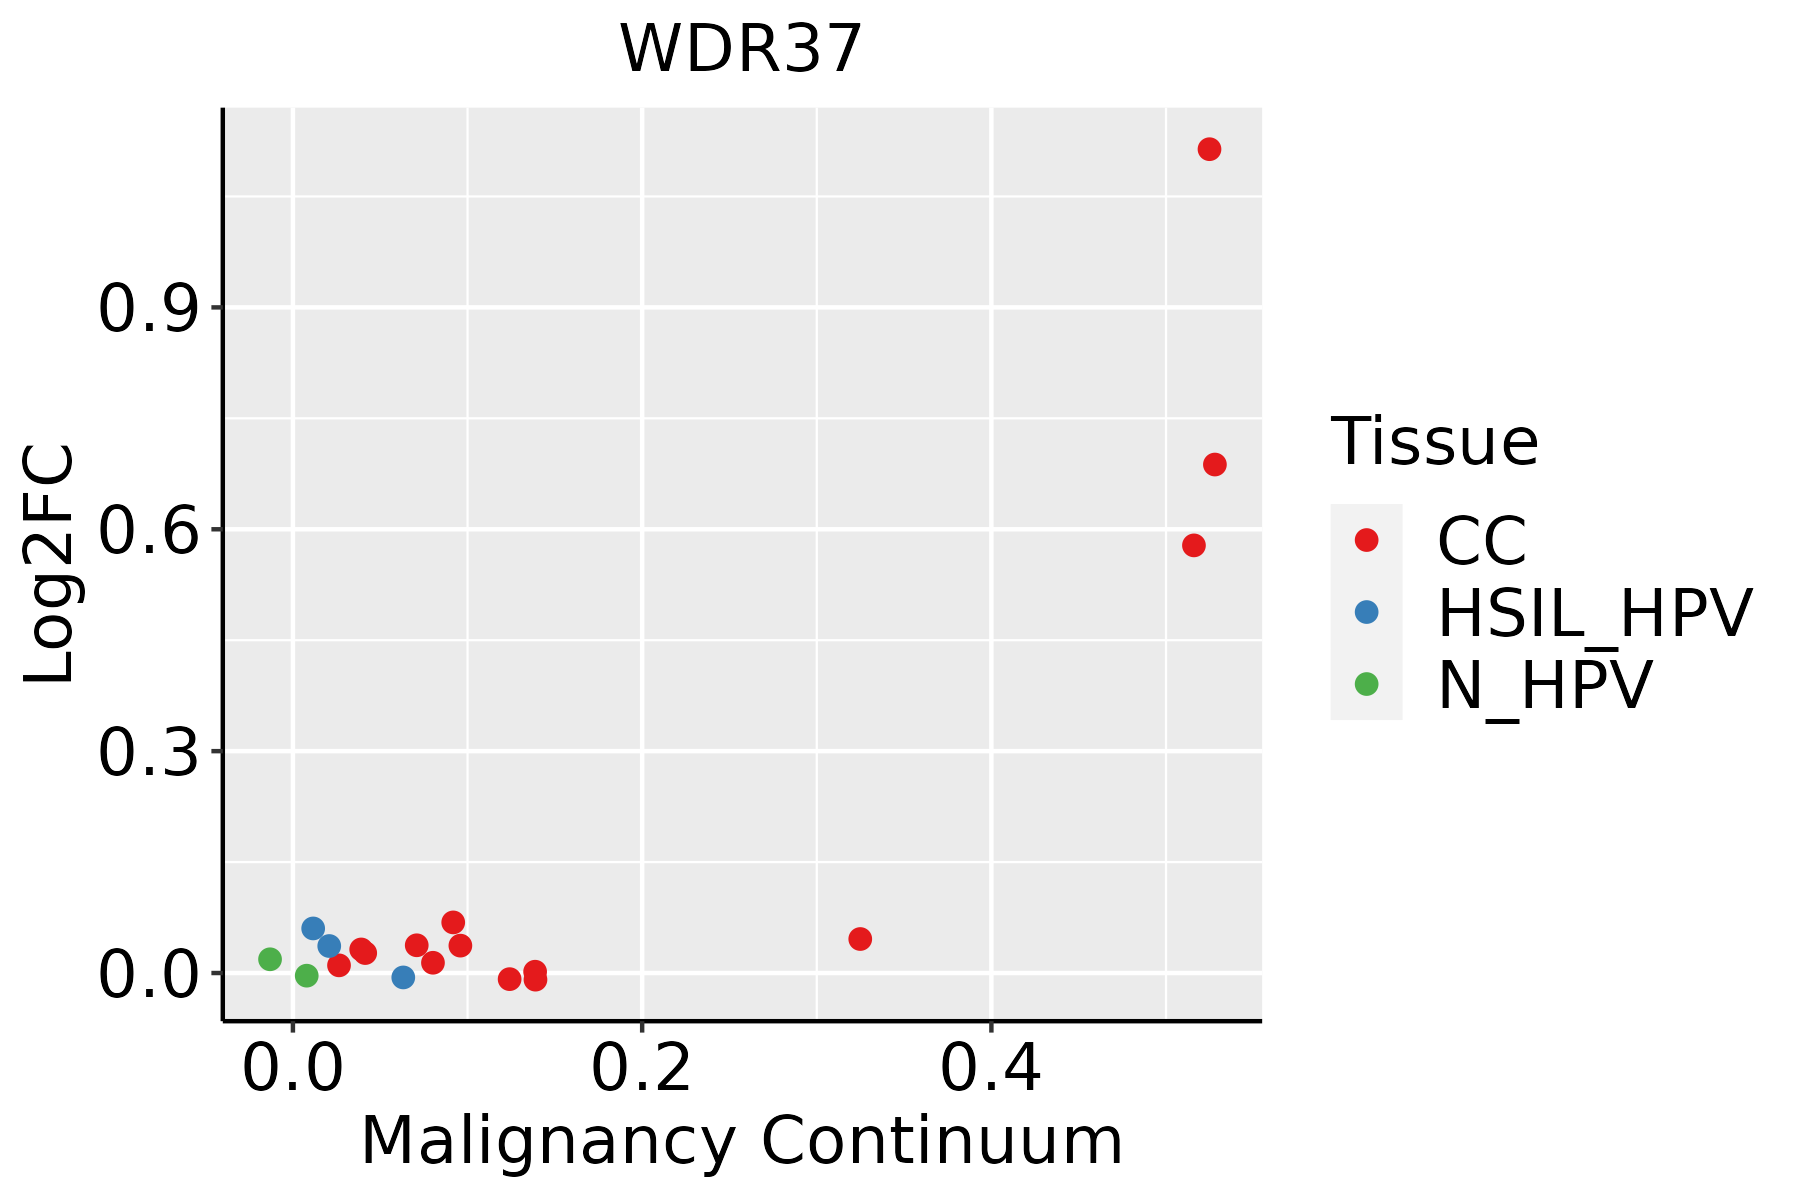 | CC: Cervix cancer |
| HSIL_HPV: HPV-infected high-grade squamous intraepithelial lesions | ||
| N_HPV: HPV-infected normal cervix | ||
| Oral Cavity | 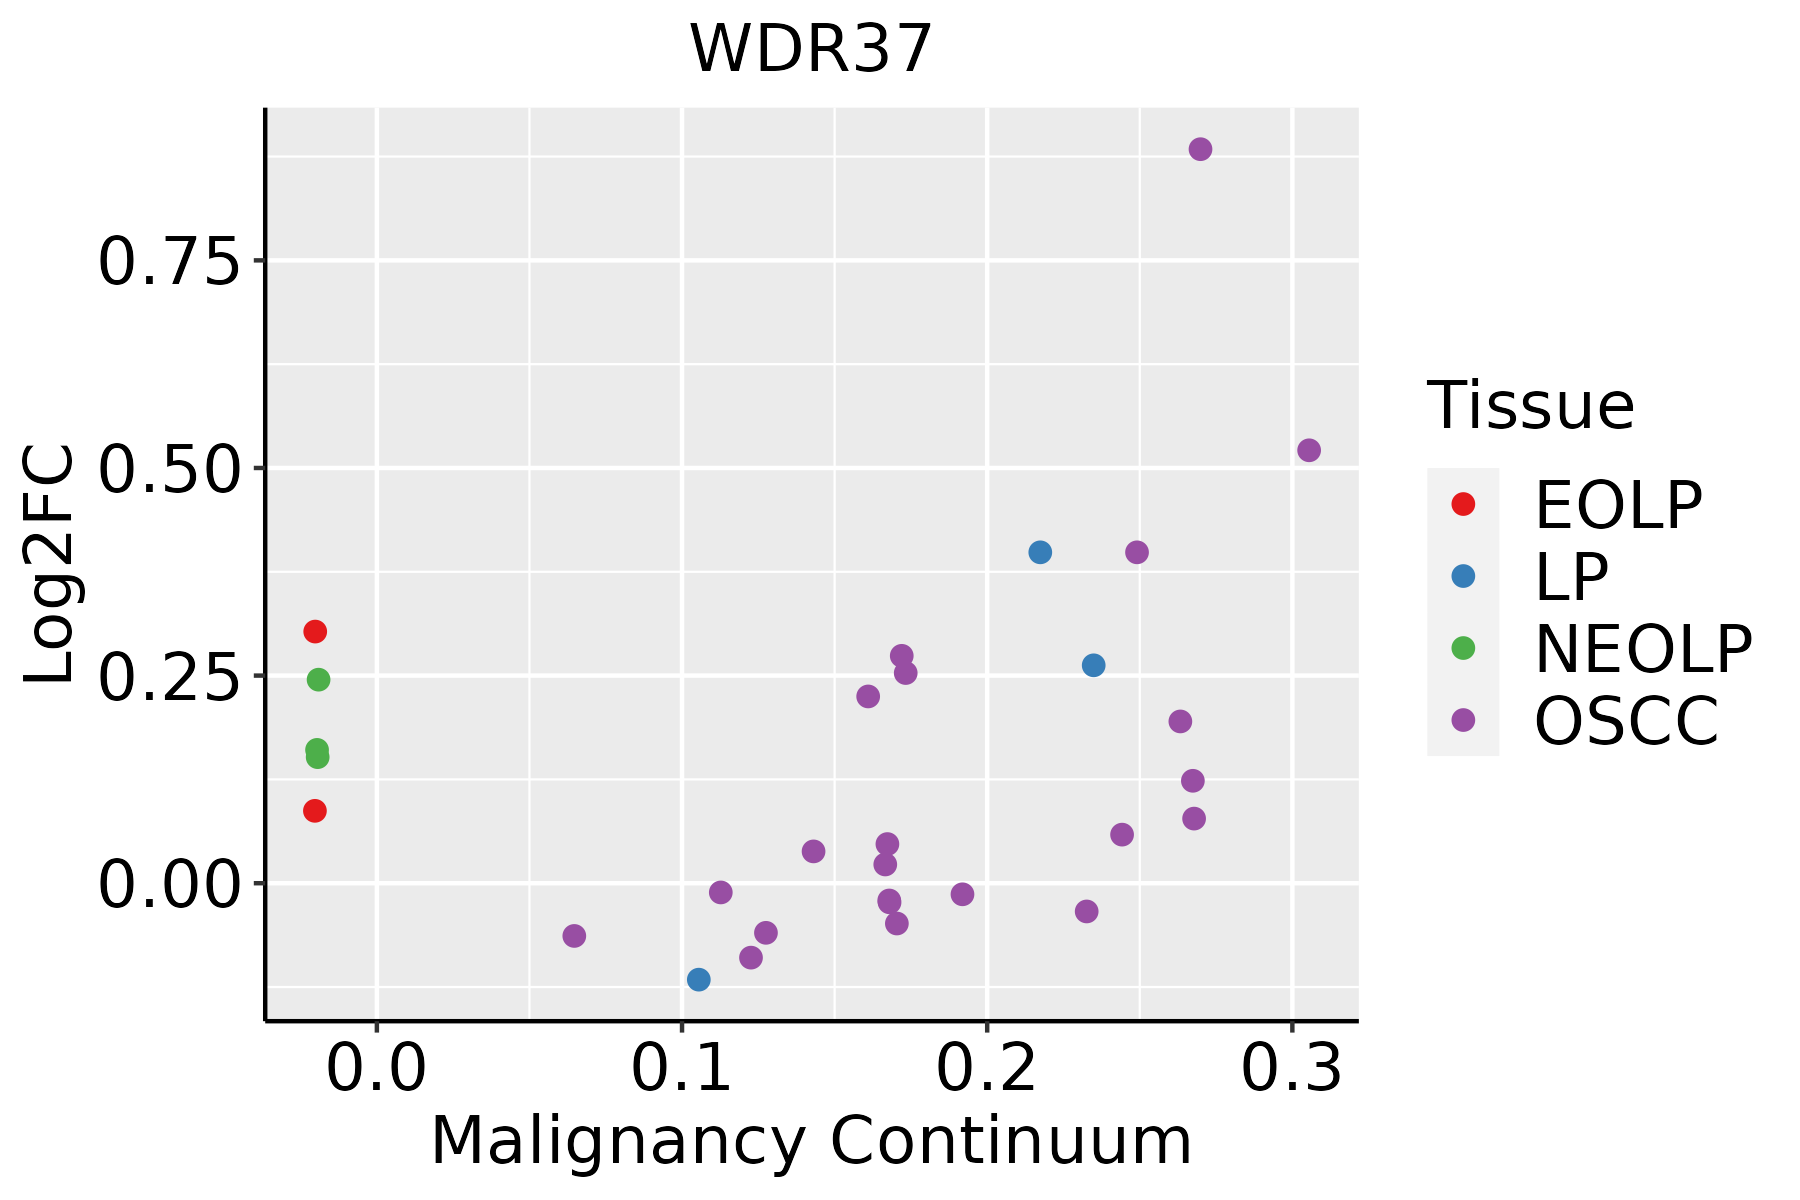 | EOLP: Erosive Oral lichen planus |
| LP: leukoplakia | ||
| NEOLP: Non-erosive oral lichen planus | ||
| OSCC: Oral squamous cell carcinoma |
| ∗log2FC in expression of this searched gene in stem-like cells from each diseased tissue sample relative to stem-like cells in normal samples in each tissue plotted against the malignancy continuum. Samples are colored based on if they are from different disease stage. |
Top |
Malignant transformation related pathway analysis |
| Find out the enriched GO biological processes and KEGG pathways involved in transition from healthy to precancer to cancer |
| Tissue | Disease Stage | Enriched GO biological Processes |
| Colorectum | AD |  |
| Colorectum | SER |  |
| Colorectum | MSS |  |
| Colorectum | MSI-H |  |
| Colorectum | FAP |  |
| ∗Top 15 enriched GO BP terms are showed in the bar plot of each disease state in each tissue. Each row represents a significant GO biological process which is colored according to the -log10(p.adjust). |
| Page: 1 2 3 4 5 6 7 8 9 |
| GO ID | Tissue | Disease Stage | Description | Gene Ratio | Bg Ratio | pvalue | p.adjust | Count |
| Page: 1 |
| Pathway ID | Tissue | Disease Stage | Description | Gene Ratio | Bg Ratio | pvalue | p.adjust | qvalue | Count |
| Page: 1 |
Top |
Cell-cell communication analysis |
| Identification of potential cell-cell interactions between two cell types and their ligand-receptor pairs for different disease states |
| Ligand | Receptor | LRpair | Pathway | Tissue | Disease Stage |
| Page: 1 |
Top |
Single-cell gene regulatory network inference analysis |
| Find out the significant the regulons (TFs) and the target genes of each regulon across cell types for different disease states |
| TF | Cell Type | Tissue | Disease Stage | Target Gene | RSS | Regulon Activity |
| ∗The dot plots of a searched regulon are shown for all cell subpopulations in each disease state of each tissue based on the regulon specific score inferred using pySCENIC and by calculating the average expression. |
| Page: 1 |
Top |
Somatic mutation of malignant transformation related genes |
| Annotation of somatic variants for genes involved in malignant transformation |
| Hugo Symbol | Variant Class | Variant Classification | dbSNP RS | HGVSc | HGVSp | HGVSp Short | SWISSPROT | BIOTYPE | SIFT | PolyPhen | Tumor Sample Barcode | Tissue | Histology | Sex | Age | Stage | Therapy Types | Drugs | Outcome |
| WDR37 | SNV | Missense_Mutation | novel | c.1346N>T | p.Ser449Ile | p.S449I | Q9Y2I8 | protein_coding | deleterious(0.01) | benign(0.028) | TCGA-C8-A274-01 | Breast | breast invasive carcinoma | Female | <65 | I/II | Hormone Therapy | tamoxiphen | SD |
| WDR37 | SNV | Missense_Mutation | rs139912371 | c.980N>T | p.Thr327Met | p.T327M | Q9Y2I8 | protein_coding | deleterious(0) | probably_damaging(0.977) | TCGA-EW-A1IZ-01 | Breast | breast invasive carcinoma | Female | <65 | III/IV | Chemotherapy | taxotere | SD |
| WDR37 | SNV | Missense_Mutation | c.622C>T | p.His208Tyr | p.H208Y | Q9Y2I8 | protein_coding | deleterious(0) | probably_damaging(0.996) | TCGA-EK-A3GK-01 | Cervix | cervical & endocervical cancer | Female | <65 | I/II | Unknown | Unknown | SD | |
| WDR37 | SNV | Missense_Mutation | rs754128557 | c.488N>A | p.Ser163Asn | p.S163N | Q9Y2I8 | protein_coding | tolerated(0.05) | benign(0.043) | TCGA-A6-2686-01 | Colorectum | colon adenocarcinoma | Female | >=65 | I/II | Unknown | Unknown | SD |
| WDR37 | SNV | Missense_Mutation | rs139912371 | c.980N>T | p.Thr327Met | p.T327M | Q9Y2I8 | protein_coding | deleterious(0) | probably_damaging(0.977) | TCGA-A6-6137-01 | Colorectum | colon adenocarcinoma | Male | <65 | III/IV | Chemotherapy | fluorouracil | SD |
| WDR37 | SNV | Missense_Mutation | c.266N>A | p.Arg89His | p.R89H | Q9Y2I8 | protein_coding | deleterious(0) | benign(0.247) | TCGA-AA-A00N-01 | Colorectum | colon adenocarcinoma | Male | >=65 | I/II | Unknown | Unknown | PD | |
| WDR37 | SNV | Missense_Mutation | novel | c.607N>C | p.Asn203His | p.N203H | Q9Y2I8 | protein_coding | deleterious(0.01) | probably_damaging(0.999) | TCGA-AA-A00N-01 | Colorectum | colon adenocarcinoma | Male | >=65 | I/II | Unknown | Unknown | PD |
| WDR37 | SNV | Missense_Mutation | c.847N>A | p.Val283Met | p.V283M | Q9Y2I8 | protein_coding | deleterious(0.01) | probably_damaging(0.98) | TCGA-CM-6162-01 | Colorectum | colon adenocarcinoma | Female | <65 | III/IV | Chemotherapy | oxaliplatin | SD | |
| WDR37 | SNV | Missense_Mutation | c.1217G>A | p.Arg406His | p.R406H | Q9Y2I8 | protein_coding | deleterious(0) | probably_damaging(0.962) | TCGA-D5-6930-01 | Colorectum | colon adenocarcinoma | Male | >=65 | I/II | Unknown | Unknown | SD | |
| WDR37 | SNV | Missense_Mutation | c.532G>A | p.Asp178Asn | p.D178N | Q9Y2I8 | protein_coding | deleterious(0) | possibly_damaging(0.845) | TCGA-AF-2687-01 | Colorectum | rectum adenocarcinoma | Male | <65 | III/IV | Chemotherapy | xeloda | PD |
| Page: 1 2 3 4 5 |
Top |
Related drugs of malignant transformation related genes |
| Identification of chemicals and drugs interact with genes involved in malignant transfromation |
| (DGIdb 4.0) |
| Entrez ID | Symbol | Category | Interaction Types | Drug Claim Name | Drug Name | PMIDs |
| Page: 1 |

Copyright 2023-Present -The University of Texas Health Science Center at Houston |