
|
|||||
|
 | |
| |
| |
| |
| |
| |
|
Gene: WDR33 |
Gene summary for WDR33 |
| Gene information | Species | Human | Gene symbol | WDR33 | Gene ID | 55339 |
| Gene name | WD repeat domain 33 | |
| Gene Alias | NET14 | |
| Cytomap | 2q14.3 | |
| Gene Type | protein-coding | GO ID | GO:0000003 | UniProtAcc | Q9C0J8 |
Top |
Malignant transformation analysis |
| Identification of the aberrant gene expression in precancerous and cancerous lesions by comparing the gene expression of stem-like cells in diseased tissues with normal stem cells |
| Entrez ID | Symbol | Replicates | Species | Organ | Tissue | Adj P-value | Log2FC | Malignancy |
| 55339 | WDR33 | LZE2T | Human | Esophagus | ESCC | 4.45e-03 | 5.40e-01 | 0.082 |
| 55339 | WDR33 | LZE4T | Human | Esophagus | ESCC | 1.06e-20 | 6.05e-01 | 0.0811 |
| 55339 | WDR33 | LZE7T | Human | Esophagus | ESCC | 3.53e-05 | 5.96e-01 | 0.0667 |
| 55339 | WDR33 | LZE8T | Human | Esophagus | ESCC | 1.05e-05 | 2.60e-01 | 0.067 |
| 55339 | WDR33 | LZE20T | Human | Esophagus | ESCC | 5.04e-06 | 3.22e-01 | 0.0662 |
| 55339 | WDR33 | LZE22D1 | Human | Esophagus | HGIN | 6.27e-03 | -1.87e-02 | 0.0595 |
| 55339 | WDR33 | LZE24T | Human | Esophagus | ESCC | 1.37e-12 | 5.50e-01 | 0.0596 |
| 55339 | WDR33 | LZE6T | Human | Esophagus | ESCC | 7.00e-04 | 3.16e-01 | 0.0845 |
| 55339 | WDR33 | P1T-E | Human | Esophagus | ESCC | 1.41e-10 | 5.12e-01 | 0.0875 |
| 55339 | WDR33 | P2T-E | Human | Esophagus | ESCC | 2.32e-33 | 7.10e-01 | 0.1177 |
| 55339 | WDR33 | P4T-E | Human | Esophagus | ESCC | 1.59e-44 | 1.11e+00 | 0.1323 |
| 55339 | WDR33 | P5T-E | Human | Esophagus | ESCC | 9.93e-43 | 8.44e-01 | 0.1327 |
| 55339 | WDR33 | P8T-E | Human | Esophagus | ESCC | 1.55e-31 | 4.95e-01 | 0.0889 |
| 55339 | WDR33 | P9T-E | Human | Esophagus | ESCC | 1.31e-14 | 2.78e-01 | 0.1131 |
| 55339 | WDR33 | P10T-E | Human | Esophagus | ESCC | 1.59e-59 | 1.13e+00 | 0.116 |
| 55339 | WDR33 | P11T-E | Human | Esophagus | ESCC | 2.81e-12 | 7.62e-01 | 0.1426 |
| 55339 | WDR33 | P12T-E | Human | Esophagus | ESCC | 4.52e-72 | 1.25e+00 | 0.1122 |
| 55339 | WDR33 | P15T-E | Human | Esophagus | ESCC | 8.78e-52 | 1.22e+00 | 0.1149 |
| 55339 | WDR33 | P16T-E | Human | Esophagus | ESCC | 1.32e-40 | 7.88e-01 | 0.1153 |
| 55339 | WDR33 | P17T-E | Human | Esophagus | ESCC | 5.22e-12 | 2.84e-01 | 0.1278 |
| Page: 1 2 3 4 5 6 7 |
| Tissue | Expression Dynamics | Abbreviation |
| Esophagus | 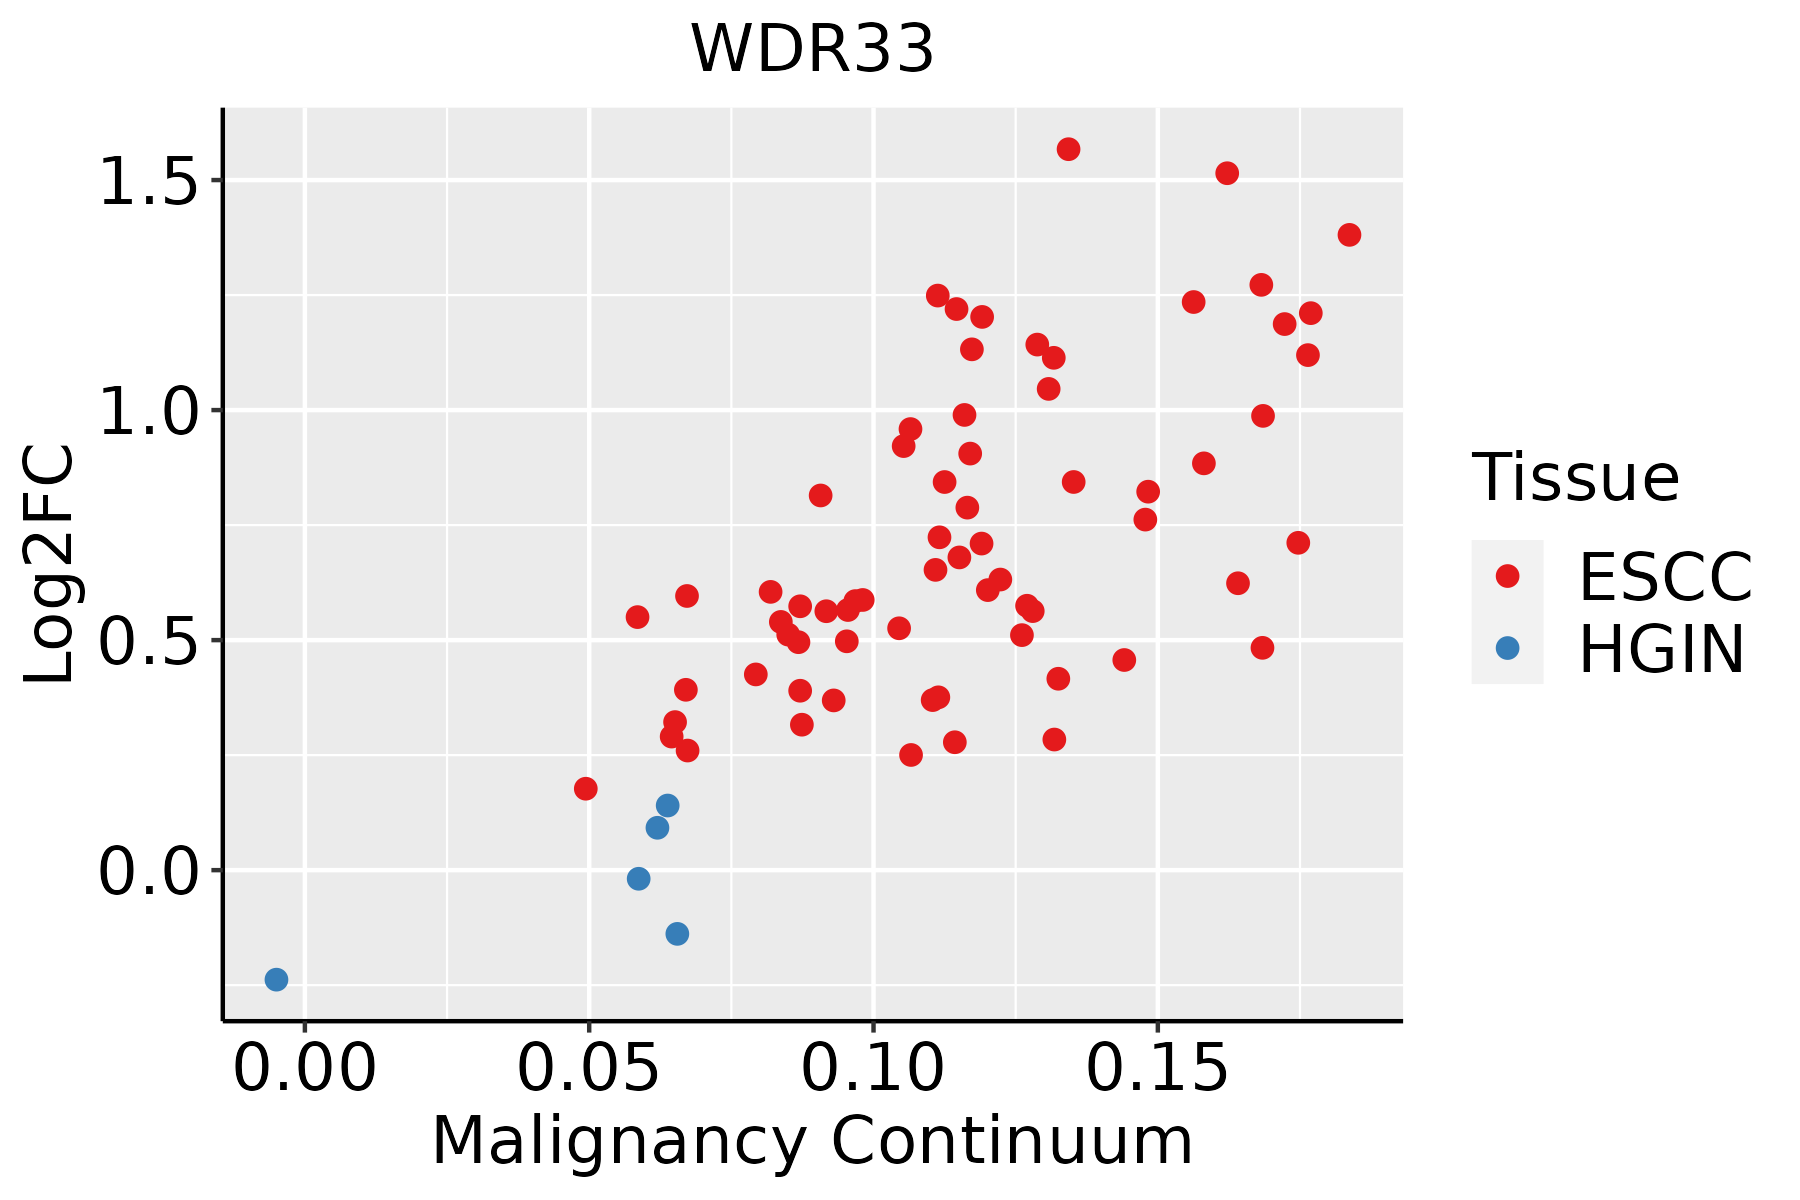 | ESCC: Esophageal squamous cell carcinoma |
| HGIN: High-grade intraepithelial neoplasias | ||
| LGIN: Low-grade intraepithelial neoplasias | ||
| Liver | 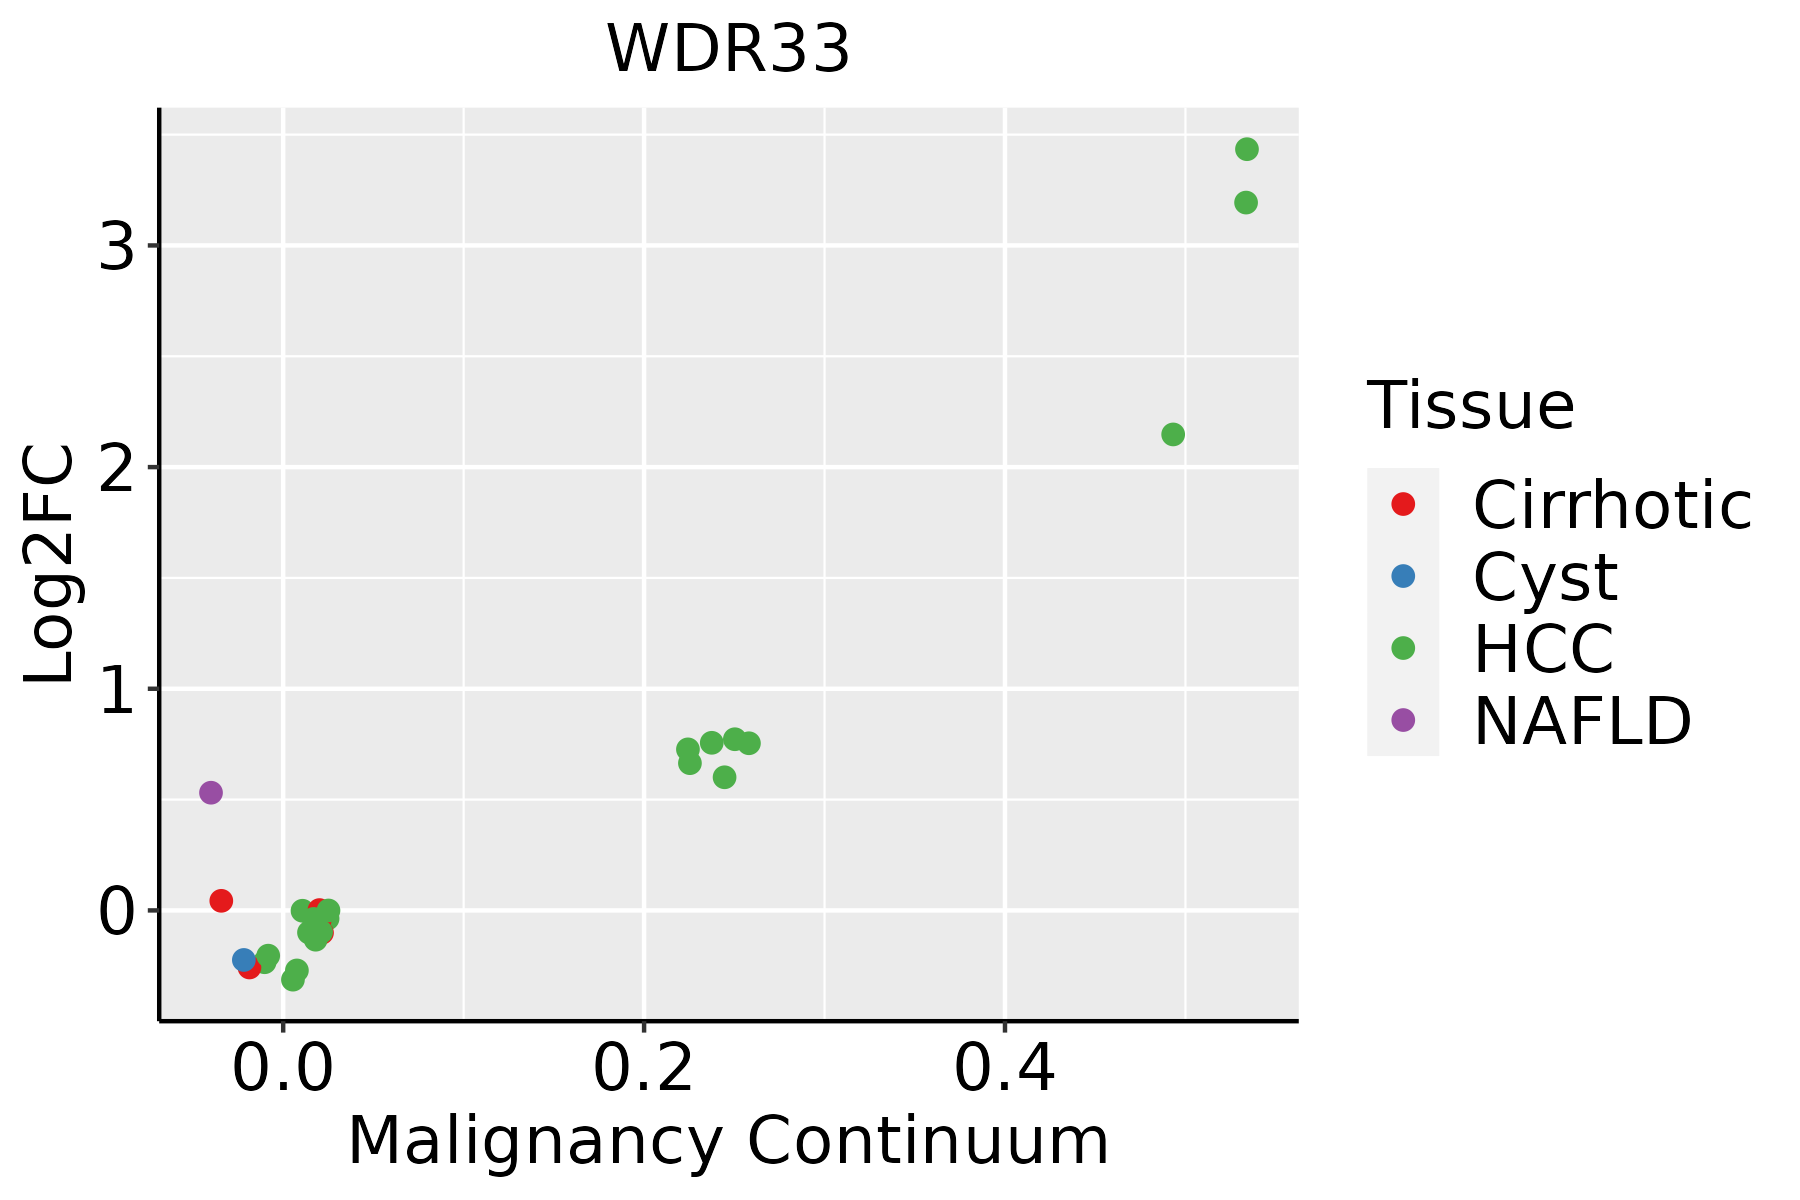 | HCC: Hepatocellular carcinoma |
| NAFLD: Non-alcoholic fatty liver disease | ||
| Lung | 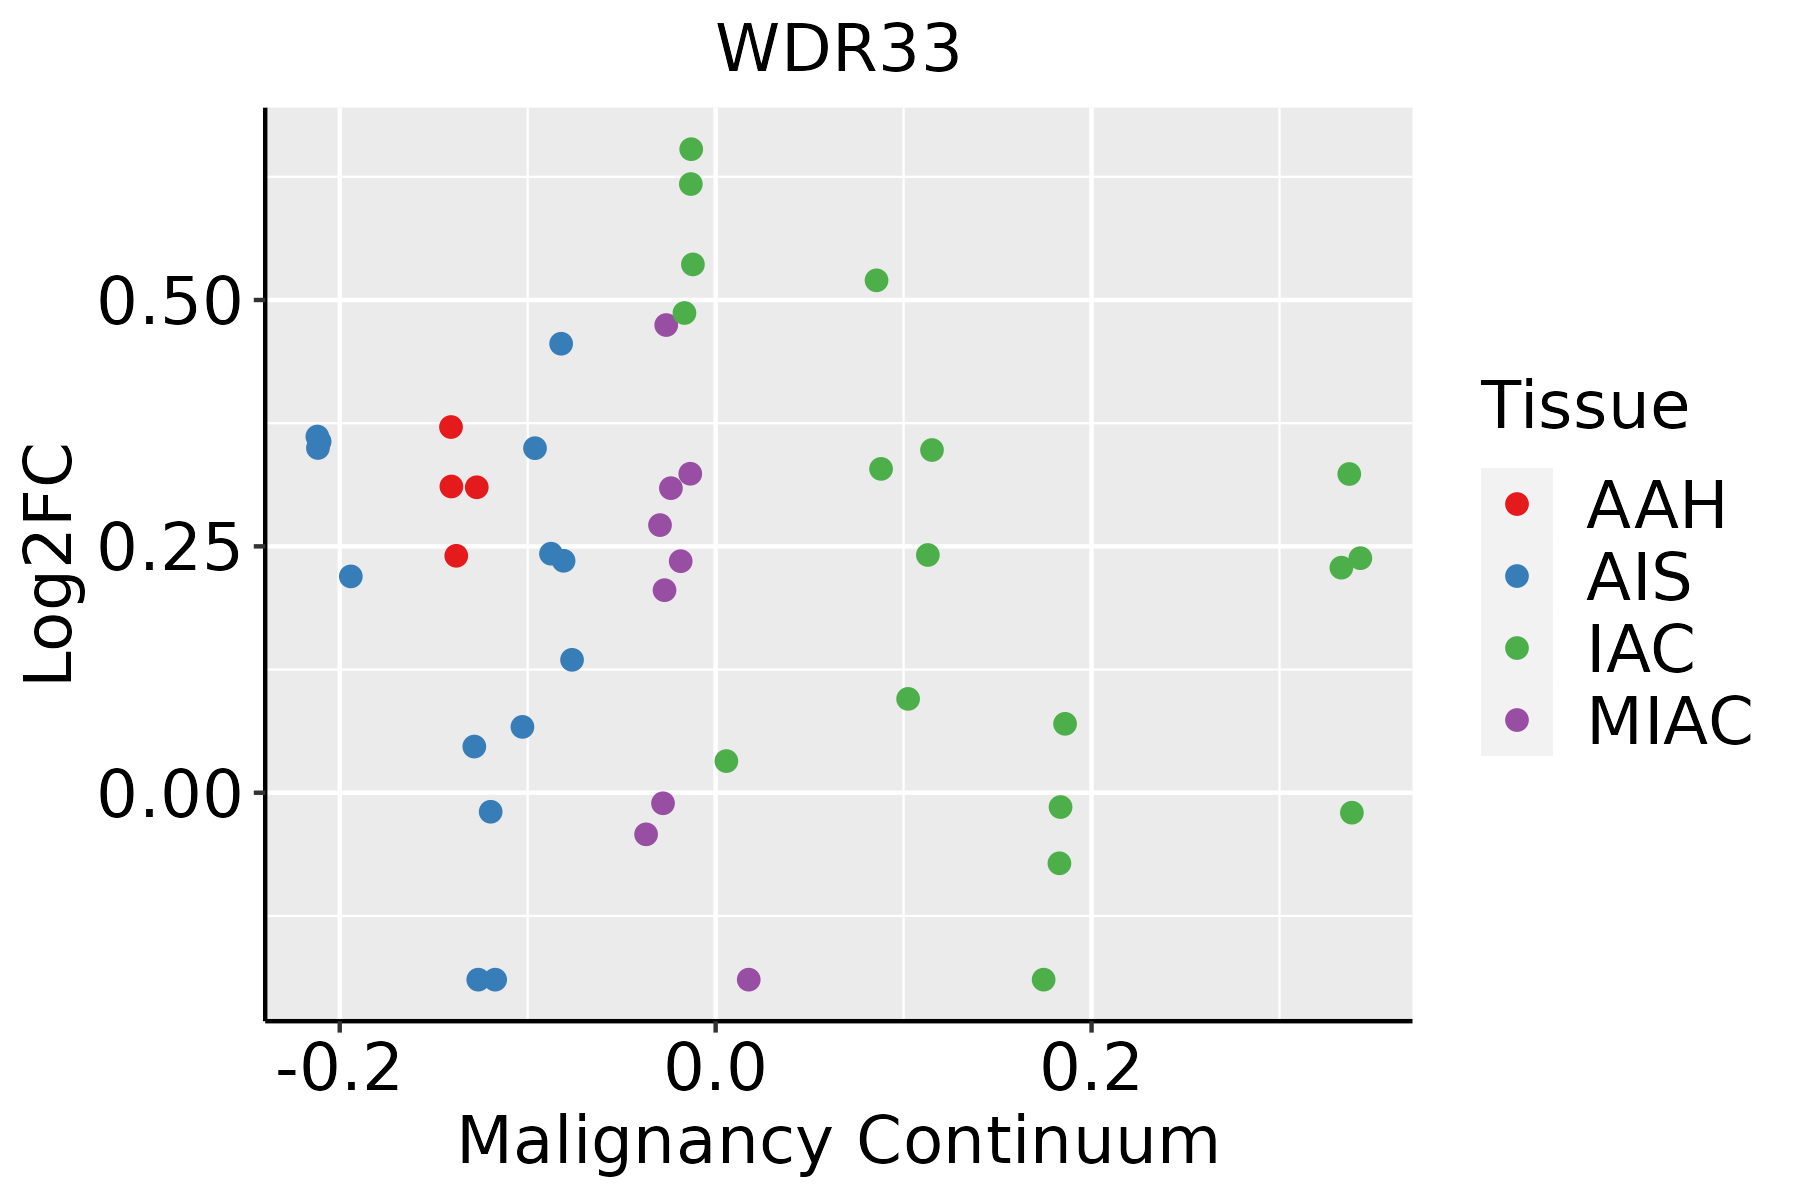 | AAH: Atypical adenomatous hyperplasia |
| AIS: Adenocarcinoma in situ | ||
| IAC: Invasive lung adenocarcinoma | ||
| MIA: Minimally invasive adenocarcinoma | ||
| Oral Cavity | 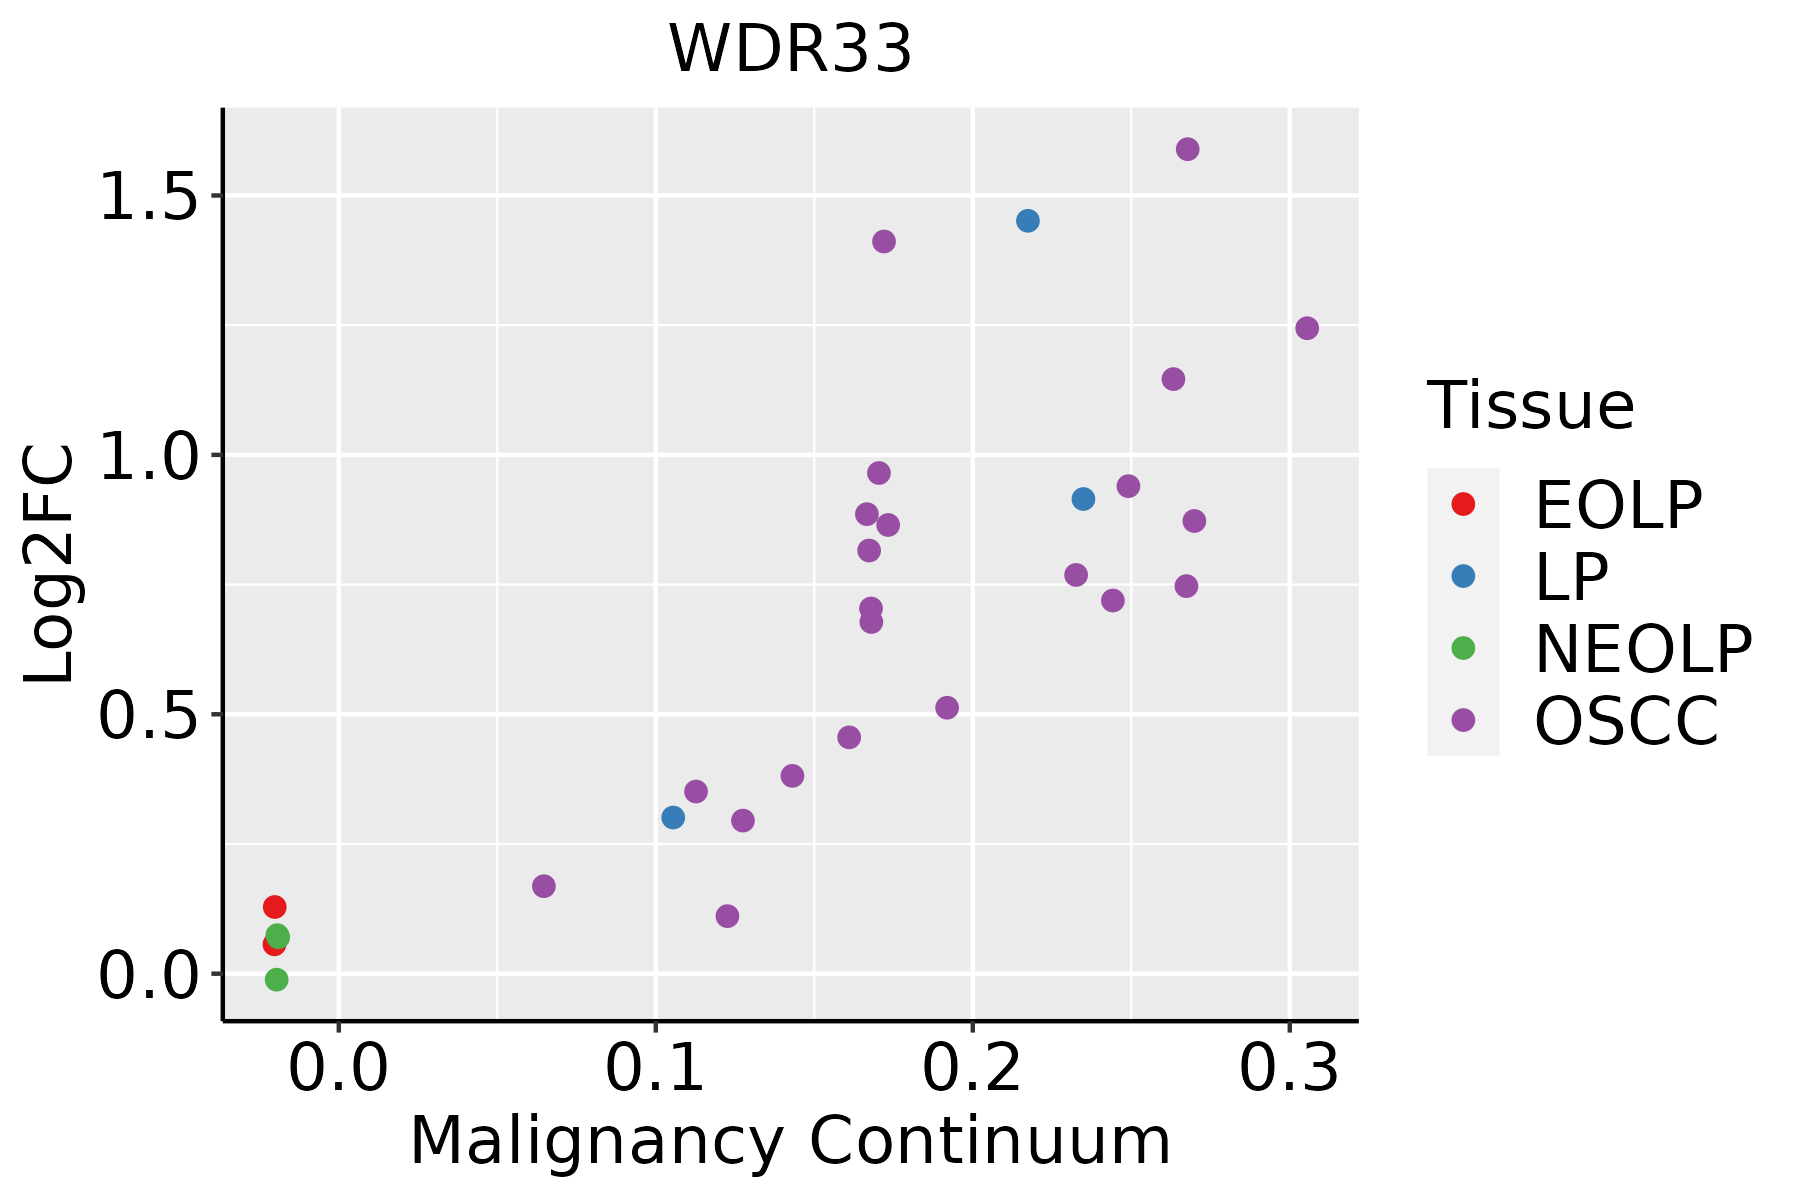 | EOLP: Erosive Oral lichen planus |
| LP: leukoplakia | ||
| NEOLP: Non-erosive oral lichen planus | ||
| OSCC: Oral squamous cell carcinoma | ||
| Skin | 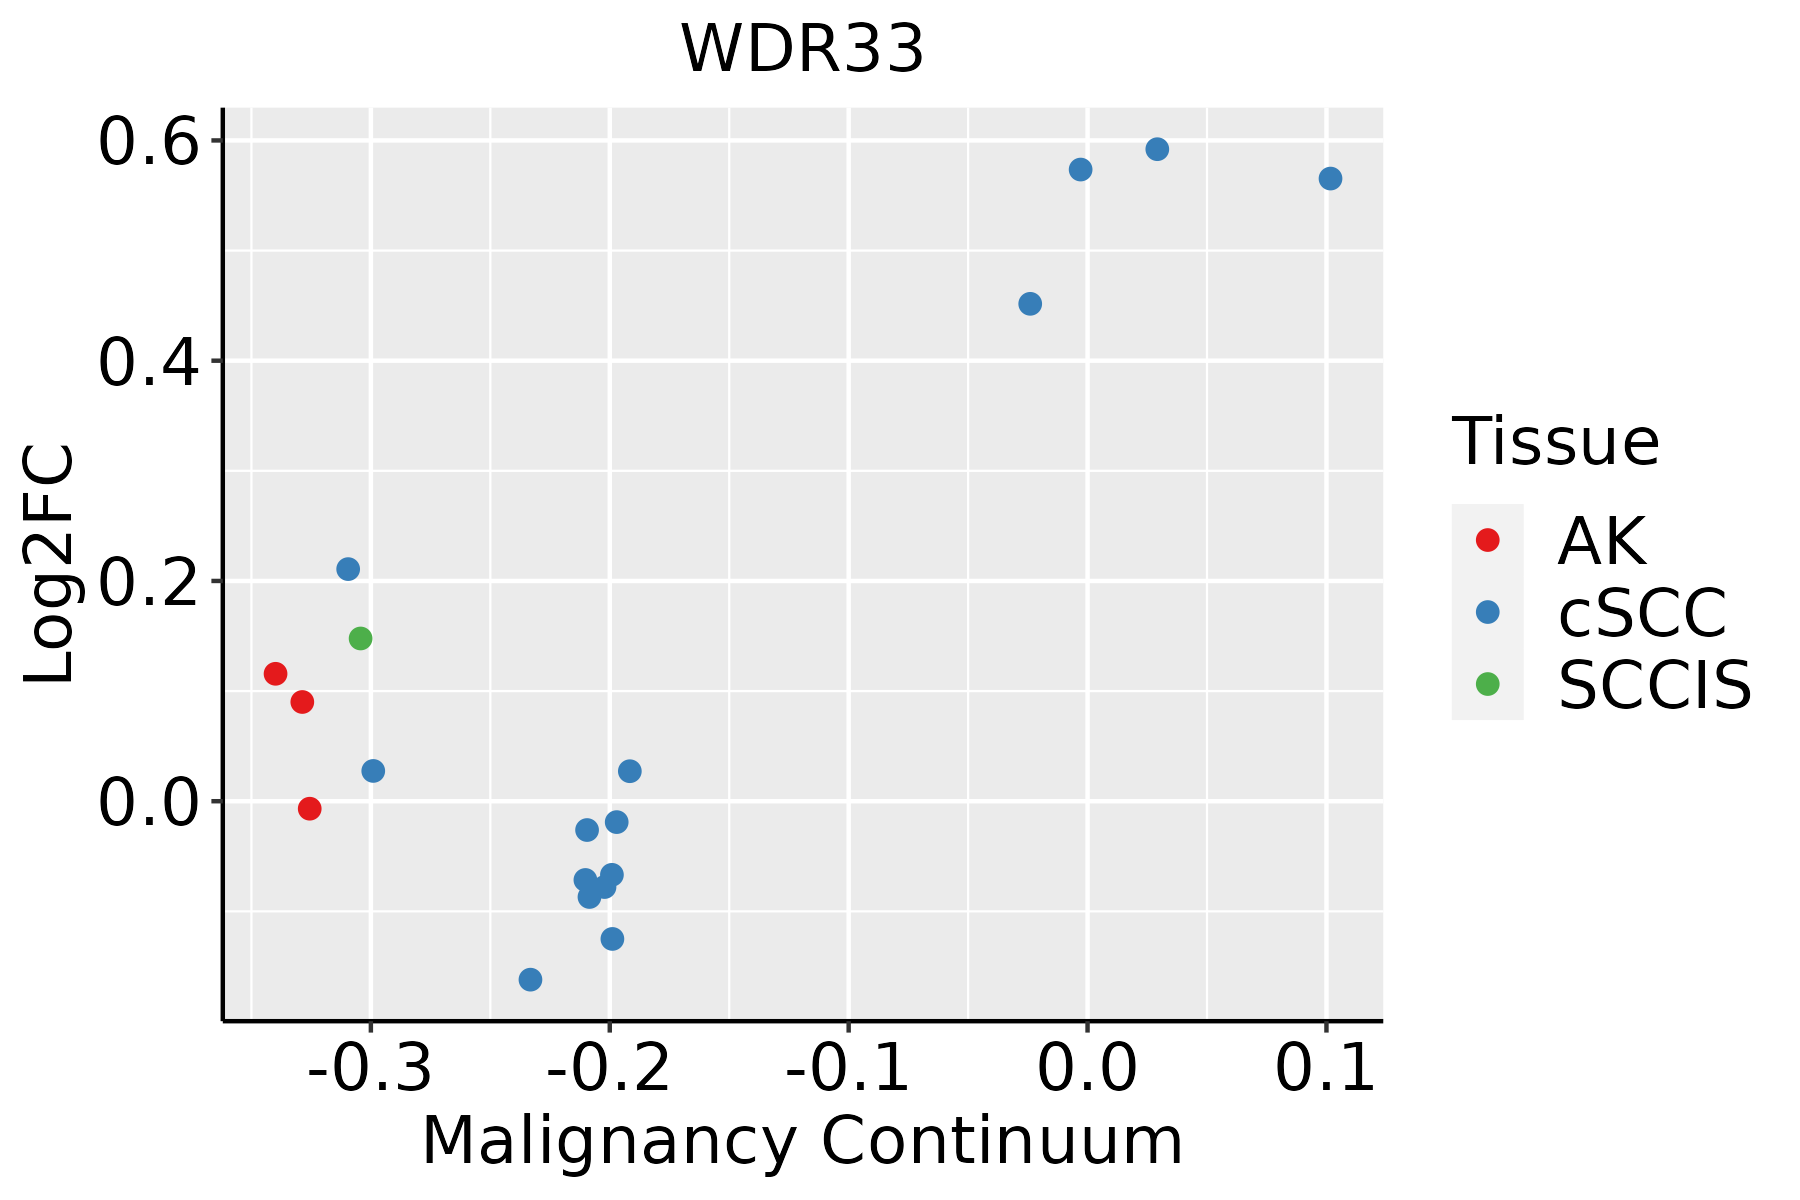 | AK: Actinic keratosis |
| cSCC: Cutaneous squamous cell carcinoma | ||
| SCCIS:squamous cell carcinoma in situ | ||
| Thyroid | 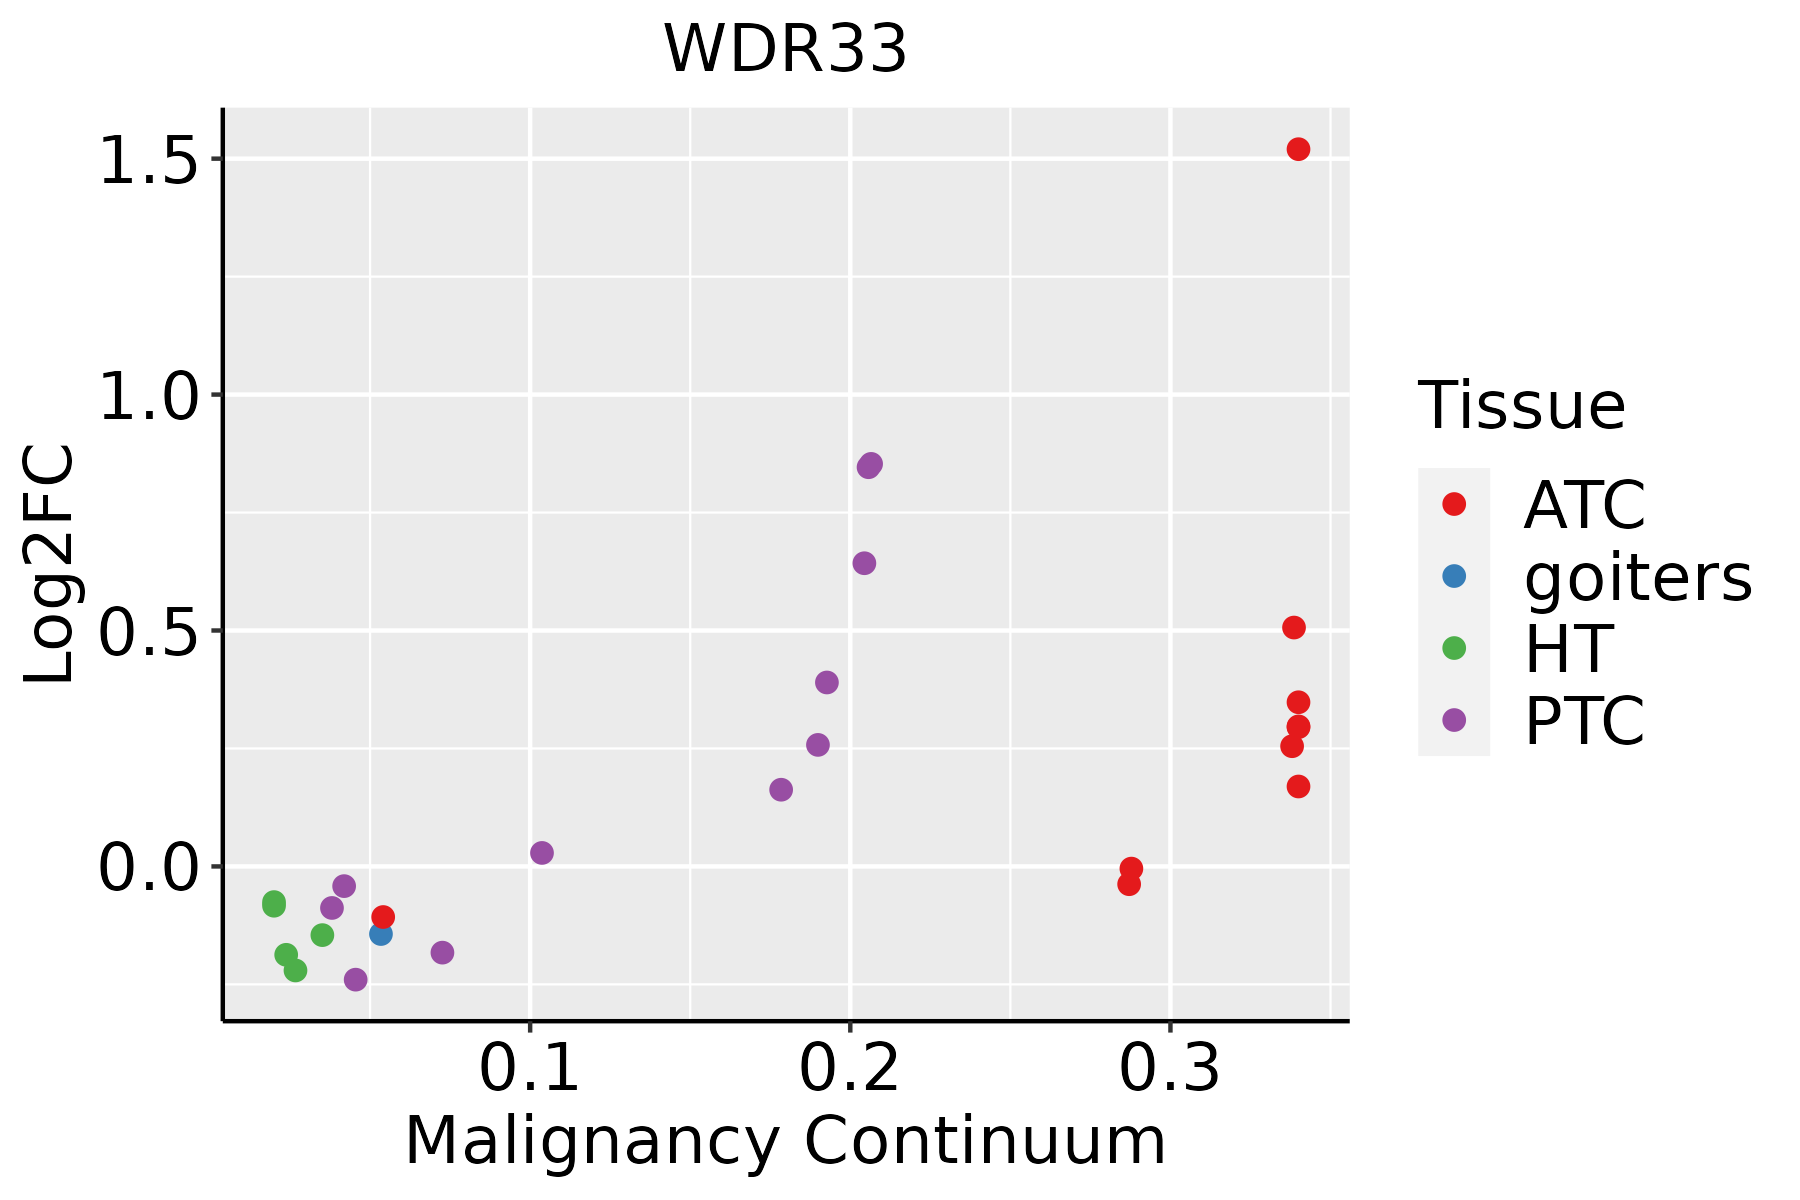 | ATC: Anaplastic thyroid cancer |
| HT: Hashimoto's thyroiditis | ||
| PTC: Papillary thyroid cancer |
| ∗log2FC in expression of this searched gene in stem-like cells from each diseased tissue sample relative to stem-like cells in normal samples in each tissue plotted against the malignancy continuum. Samples are colored based on if they are from different disease stage. |
Top |
Malignant transformation related pathway analysis |
| Find out the enriched GO biological processes and KEGG pathways involved in transition from healthy to precancer to cancer |
| Tissue | Disease Stage | Enriched GO biological Processes |
| Colorectum | AD |  |
| Colorectum | SER |  |
| Colorectum | MSS |  |
| Colorectum | MSI-H |  |
| Colorectum | FAP |  |
| ∗Top 15 enriched GO BP terms are showed in the bar plot of each disease state in each tissue. Each row represents a significant GO biological process which is colored according to the -log10(p.adjust). |
| Page: 1 2 3 4 5 6 7 8 9 |
| GO ID | Tissue | Disease Stage | Description | Gene Ratio | Bg Ratio | pvalue | p.adjust | Count |
| GO:00311243 | Esophagus | HGIN | mRNA 3'-end processing | 18/2587 | 62/18723 | 1.37e-03 | 1.61e-02 | 18 |
| GO:003112412 | Esophagus | ESCC | mRNA 3'-end processing | 47/8552 | 62/18723 | 1.29e-06 | 1.58e-05 | 47 |
| GO:00311233 | Esophagus | ESCC | RNA 3'-end processing | 76/8552 | 116/18723 | 1.25e-05 | 1.15e-04 | 76 |
| GO:00063012 | Esophagus | ESCC | postreplication repair | 26/8552 | 31/18723 | 1.32e-05 | 1.21e-04 | 26 |
| GO:00063783 | Esophagus | ESCC | mRNA polyadenylation | 33/8552 | 44/18723 | 7.30e-05 | 5.49e-04 | 33 |
| GO:00436313 | Esophagus | ESCC | RNA polyadenylation | 33/8552 | 45/18723 | 1.54e-04 | 1.02e-03 | 33 |
| GO:0006301 | Liver | Cirrhotic | postreplication repair | 15/4634 | 31/18723 | 3.68e-03 | 2.02e-02 | 15 |
| GO:0031123 | Liver | Cirrhotic | RNA 3'-end processing | 42/4634 | 116/18723 | 3.85e-03 | 2.10e-02 | 42 |
| GO:0031124 | Liver | Cirrhotic | mRNA 3'-end processing | 25/4634 | 62/18723 | 4.90e-03 | 2.56e-02 | 25 |
| GO:00311241 | Liver | HCC | mRNA 3'-end processing | 50/7958 | 62/18723 | 8.44e-10 | 2.60e-08 | 50 |
| GO:00311231 | Liver | HCC | RNA 3'-end processing | 81/7958 | 116/18723 | 2.27e-09 | 6.32e-08 | 81 |
| GO:0006378 | Liver | HCC | mRNA polyadenylation | 35/7958 | 44/18723 | 5.70e-07 | 9.03e-06 | 35 |
| GO:0043631 | Liver | HCC | RNA polyadenylation | 35/7958 | 45/18723 | 1.51e-06 | 2.15e-05 | 35 |
| GO:00311242 | Oral cavity | OSCC | mRNA 3'-end processing | 49/7305 | 62/18723 | 1.40e-10 | 4.14e-09 | 49 |
| GO:00311232 | Oral cavity | OSCC | RNA 3'-end processing | 75/7305 | 116/18723 | 1.93e-08 | 3.79e-07 | 75 |
| GO:00063782 | Oral cavity | OSCC | mRNA polyadenylation | 34/7305 | 44/18723 | 2.63e-07 | 4.10e-06 | 34 |
| GO:00436312 | Oral cavity | OSCC | RNA polyadenylation | 34/7305 | 45/18723 | 6.73e-07 | 9.53e-06 | 34 |
| GO:00063011 | Oral cavity | OSCC | postreplication repair | 20/7305 | 31/18723 | 3.57e-03 | 1.49e-02 | 20 |
| GO:003112311 | Oral cavity | LP | RNA 3'-end processing | 48/4623 | 116/18723 | 5.51e-05 | 7.58e-04 | 48 |
| GO:003112411 | Oral cavity | LP | mRNA 3'-end processing | 29/4623 | 62/18723 | 1.28e-04 | 1.49e-03 | 29 |
| Page: 1 2 |
| Pathway ID | Tissue | Disease Stage | Description | Gene Ratio | Bg Ratio | pvalue | p.adjust | qvalue | Count |
| hsa0301524 | Esophagus | ESCC | mRNA surveillance pathway | 72/4205 | 97/8465 | 6.12e-07 | 4.10e-06 | 2.10e-06 | 72 |
| hsa0301534 | Esophagus | ESCC | mRNA surveillance pathway | 72/4205 | 97/8465 | 6.12e-07 | 4.10e-06 | 2.10e-06 | 72 |
| hsa030154 | Liver | Cirrhotic | mRNA surveillance pathway | 46/2530 | 97/8465 | 1.92e-04 | 1.30e-03 | 8.03e-04 | 46 |
| hsa0301511 | Liver | Cirrhotic | mRNA surveillance pathway | 46/2530 | 97/8465 | 1.92e-04 | 1.30e-03 | 8.03e-04 | 46 |
| hsa0301521 | Liver | HCC | mRNA surveillance pathway | 66/4020 | 97/8465 | 3.16e-05 | 1.88e-04 | 1.04e-04 | 66 |
| hsa0301531 | Liver | HCC | mRNA surveillance pathway | 66/4020 | 97/8465 | 3.16e-05 | 1.88e-04 | 1.04e-04 | 66 |
| hsa030158 | Oral cavity | OSCC | mRNA surveillance pathway | 75/3704 | 97/8465 | 1.30e-11 | 2.01e-10 | 1.02e-10 | 75 |
| hsa0301513 | Oral cavity | OSCC | mRNA surveillance pathway | 75/3704 | 97/8465 | 1.30e-11 | 2.01e-10 | 1.02e-10 | 75 |
| hsa0301523 | Oral cavity | LP | mRNA surveillance pathway | 50/2418 | 97/8465 | 1.39e-06 | 1.50e-05 | 9.66e-06 | 50 |
| hsa0301533 | Oral cavity | LP | mRNA surveillance pathway | 50/2418 | 97/8465 | 1.39e-06 | 1.50e-05 | 9.66e-06 | 50 |
| Page: 1 |
Top |
Cell-cell communication analysis |
| Identification of potential cell-cell interactions between two cell types and their ligand-receptor pairs for different disease states |
| Ligand | Receptor | LRpair | Pathway | Tissue | Disease Stage |
| Page: 1 |
Top |
Single-cell gene regulatory network inference analysis |
| Find out the significant the regulons (TFs) and the target genes of each regulon across cell types for different disease states |
| TF | Cell Type | Tissue | Disease Stage | Target Gene | RSS | Regulon Activity |
| ∗The dot plots of a searched regulon are shown for all cell subpopulations in each disease state of each tissue based on the regulon specific score inferred using pySCENIC and by calculating the average expression. |
| Page: 1 |
Top |
Somatic mutation of malignant transformation related genes |
| Annotation of somatic variants for genes involved in malignant transformation |
| Hugo Symbol | Variant Class | Variant Classification | dbSNP RS | HGVSc | HGVSp | HGVSp Short | SWISSPROT | BIOTYPE | SIFT | PolyPhen | Tumor Sample Barcode | Tissue | Histology | Sex | Age | Stage | Therapy Types | Drugs | Outcome |
| WDR33 | SNV | Missense_Mutation | c.2603N>G | p.Ser868Cys | p.S868C | Q9C0J8 | protein_coding | deleterious_low_confidence(0.04) | benign(0.253) | TCGA-A2-A0SY-01 | Breast | breast invasive carcinoma | Female | <65 | III/IV | Hormone Therapy | arimidex | SD | |
| WDR33 | SNV | Missense_Mutation | c.250N>T | p.Pro84Ser | p.P84S | Q9C0J8 | protein_coding | deleterious(0.01) | probably_damaging(0.994) | TCGA-A2-A25E-01 | Breast | breast invasive carcinoma | Female | <65 | III/IV | Chemotherapy | cytoxan | PD | |
| WDR33 | SNV | Missense_Mutation | novel | c.2213N>C | p.Gln738Pro | p.Q738P | Q9C0J8 | protein_coding | tolerated_low_confidence(0.07) | benign(0) | TCGA-A2-A3KD-01 | Breast | breast invasive carcinoma | Female | <65 | III/IV | Chemotherapy | taxotere | SD |
| WDR33 | SNV | Missense_Mutation | c.3962N>G | p.Ser1321Cys | p.S1321C | Q9C0J8 | protein_coding | deleterious_low_confidence(0.01) | possibly_damaging(0.79) | TCGA-A8-A09G-01 | Breast | breast invasive carcinoma | Female | >=65 | III/IV | Unknown | Unknown | SD | |
| WDR33 | SNV | Missense_Mutation | c.3142N>A | p.Gly1048Arg | p.G1048R | Q9C0J8 | protein_coding | deleterious_low_confidence(0.01) | benign(0.069) | TCGA-AC-A23H-01 | Breast | breast invasive carcinoma | Female | >=65 | I/II | Unknown | Unknown | PD | |
| WDR33 | SNV | Missense_Mutation | c.3923N>A | p.Arg1308Gln | p.R1308Q | Q9C0J8 | protein_coding | deleterious_low_confidence(0) | benign(0.441) | TCGA-C8-A130-01 | Breast | breast invasive carcinoma | Female | <65 | III/IV | Unknown | Unknown | SD | |
| WDR33 | SNV | Missense_Mutation | c.3649N>C | p.Ser1217Pro | p.S1217P | Q9C0J8 | protein_coding | tolerated_low_confidence(0.59) | benign(0.012) | TCGA-D8-A1XQ-01 | Breast | breast invasive carcinoma | Female | >=65 | I/II | Unknown | Unknown | SD | |
| WDR33 | SNV | Missense_Mutation | novel | c.611N>A | p.Ala204Glu | p.A204E | Q9C0J8 | protein_coding | deleterious(0.01) | probably_damaging(0.982) | TCGA-E2-A1IE-01 | Breast | breast invasive carcinoma | Female | <65 | I/II | Chemotherapy | doxorubicin | PD |
| WDR33 | SNV | Missense_Mutation | novel | c.1524G>C | p.Trp508Cys | p.W508C | Q9C0J8 | protein_coding | deleterious(0) | probably_damaging(0.994) | TCGA-E2-A1II-01 | Breast | breast invasive carcinoma | Female | <65 | I/II | Chemotherapy | doxorubicin | SD |
| WDR33 | SNV | Missense_Mutation | c.257C>A | p.Ala86Glu | p.A86E | Q9C0J8 | protein_coding | deleterious(0.02) | possibly_damaging(0.879) | TCGA-E9-A247-01 | Breast | breast invasive carcinoma | Female | <65 | I/II | Hormone Therapy | tamoxiphen | SD |
| Page: 1 2 3 4 5 6 7 8 9 10 11 12 13 14 |
Top |
Related drugs of malignant transformation related genes |
| Identification of chemicals and drugs interact with genes involved in malignant transfromation |
| (DGIdb 4.0) |
| Entrez ID | Symbol | Category | Interaction Types | Drug Claim Name | Drug Name | PMIDs |
| Page: 1 |

Copyright 2023-Present -The University of Texas Health Science Center at Houston |