
|
|||||
|
 | |
| |
| |
| |
| |
| |
|
Gene: WDR24 |
Gene summary for WDR24 |
| Gene information | Species | Human | Gene symbol | WDR24 | Gene ID | 84219 |
| Gene name | WD repeat domain 24 | |
| Gene Alias | C16orf21 | |
| Cytomap | 16p13.3 | |
| Gene Type | protein-coding | GO ID | GO:0006914 | UniProtAcc | Q96S15 |
Top |
Malignant transformation analysis |
| Identification of the aberrant gene expression in precancerous and cancerous lesions by comparing the gene expression of stem-like cells in diseased tissues with normal stem cells |
| Entrez ID | Symbol | Replicates | Species | Organ | Tissue | Adj P-value | Log2FC | Malignancy |
| 84219 | WDR24 | LZE20T | Human | Esophagus | ESCC | 1.14e-06 | 1.78e-01 | 0.0662 |
| 84219 | WDR24 | LZE24T | Human | Esophagus | ESCC | 7.60e-06 | 1.41e-01 | 0.0596 |
| 84219 | WDR24 | P1T-E | Human | Esophagus | ESCC | 1.25e-07 | 3.73e-01 | 0.0875 |
| 84219 | WDR24 | P2T-E | Human | Esophagus | ESCC | 1.47e-14 | 2.27e-01 | 0.1177 |
| 84219 | WDR24 | P4T-E | Human | Esophagus | ESCC | 6.83e-06 | 1.34e-01 | 0.1323 |
| 84219 | WDR24 | P5T-E | Human | Esophagus | ESCC | 2.84e-24 | 4.16e-01 | 0.1327 |
| 84219 | WDR24 | P8T-E | Human | Esophagus | ESCC | 3.89e-12 | 2.26e-01 | 0.0889 |
| 84219 | WDR24 | P9T-E | Human | Esophagus | ESCC | 1.67e-04 | 1.20e-01 | 0.1131 |
| 84219 | WDR24 | P10T-E | Human | Esophagus | ESCC | 1.80e-02 | 7.42e-02 | 0.116 |
| 84219 | WDR24 | P11T-E | Human | Esophagus | ESCC | 4.76e-03 | 2.29e-01 | 0.1426 |
| 84219 | WDR24 | P12T-E | Human | Esophagus | ESCC | 2.20e-17 | 2.92e-01 | 0.1122 |
| 84219 | WDR24 | P15T-E | Human | Esophagus | ESCC | 3.18e-12 | 2.55e-01 | 0.1149 |
| 84219 | WDR24 | P16T-E | Human | Esophagus | ESCC | 1.60e-05 | 6.43e-02 | 0.1153 |
| 84219 | WDR24 | P20T-E | Human | Esophagus | ESCC | 2.82e-04 | 1.12e-01 | 0.1124 |
| 84219 | WDR24 | P22T-E | Human | Esophagus | ESCC | 1.68e-02 | 9.81e-02 | 0.1236 |
| 84219 | WDR24 | P23T-E | Human | Esophagus | ESCC | 6.94e-10 | 2.13e-01 | 0.108 |
| 84219 | WDR24 | P24T-E | Human | Esophagus | ESCC | 2.92e-05 | 9.73e-02 | 0.1287 |
| 84219 | WDR24 | P26T-E | Human | Esophagus | ESCC | 9.14e-05 | 7.61e-02 | 0.1276 |
| 84219 | WDR24 | P27T-E | Human | Esophagus | ESCC | 1.34e-05 | 9.61e-02 | 0.1055 |
| 84219 | WDR24 | P28T-E | Human | Esophagus | ESCC | 1.96e-05 | 1.31e-01 | 0.1149 |
| Page: 1 2 3 |
| Tissue | Expression Dynamics | Abbreviation |
| Esophagus | 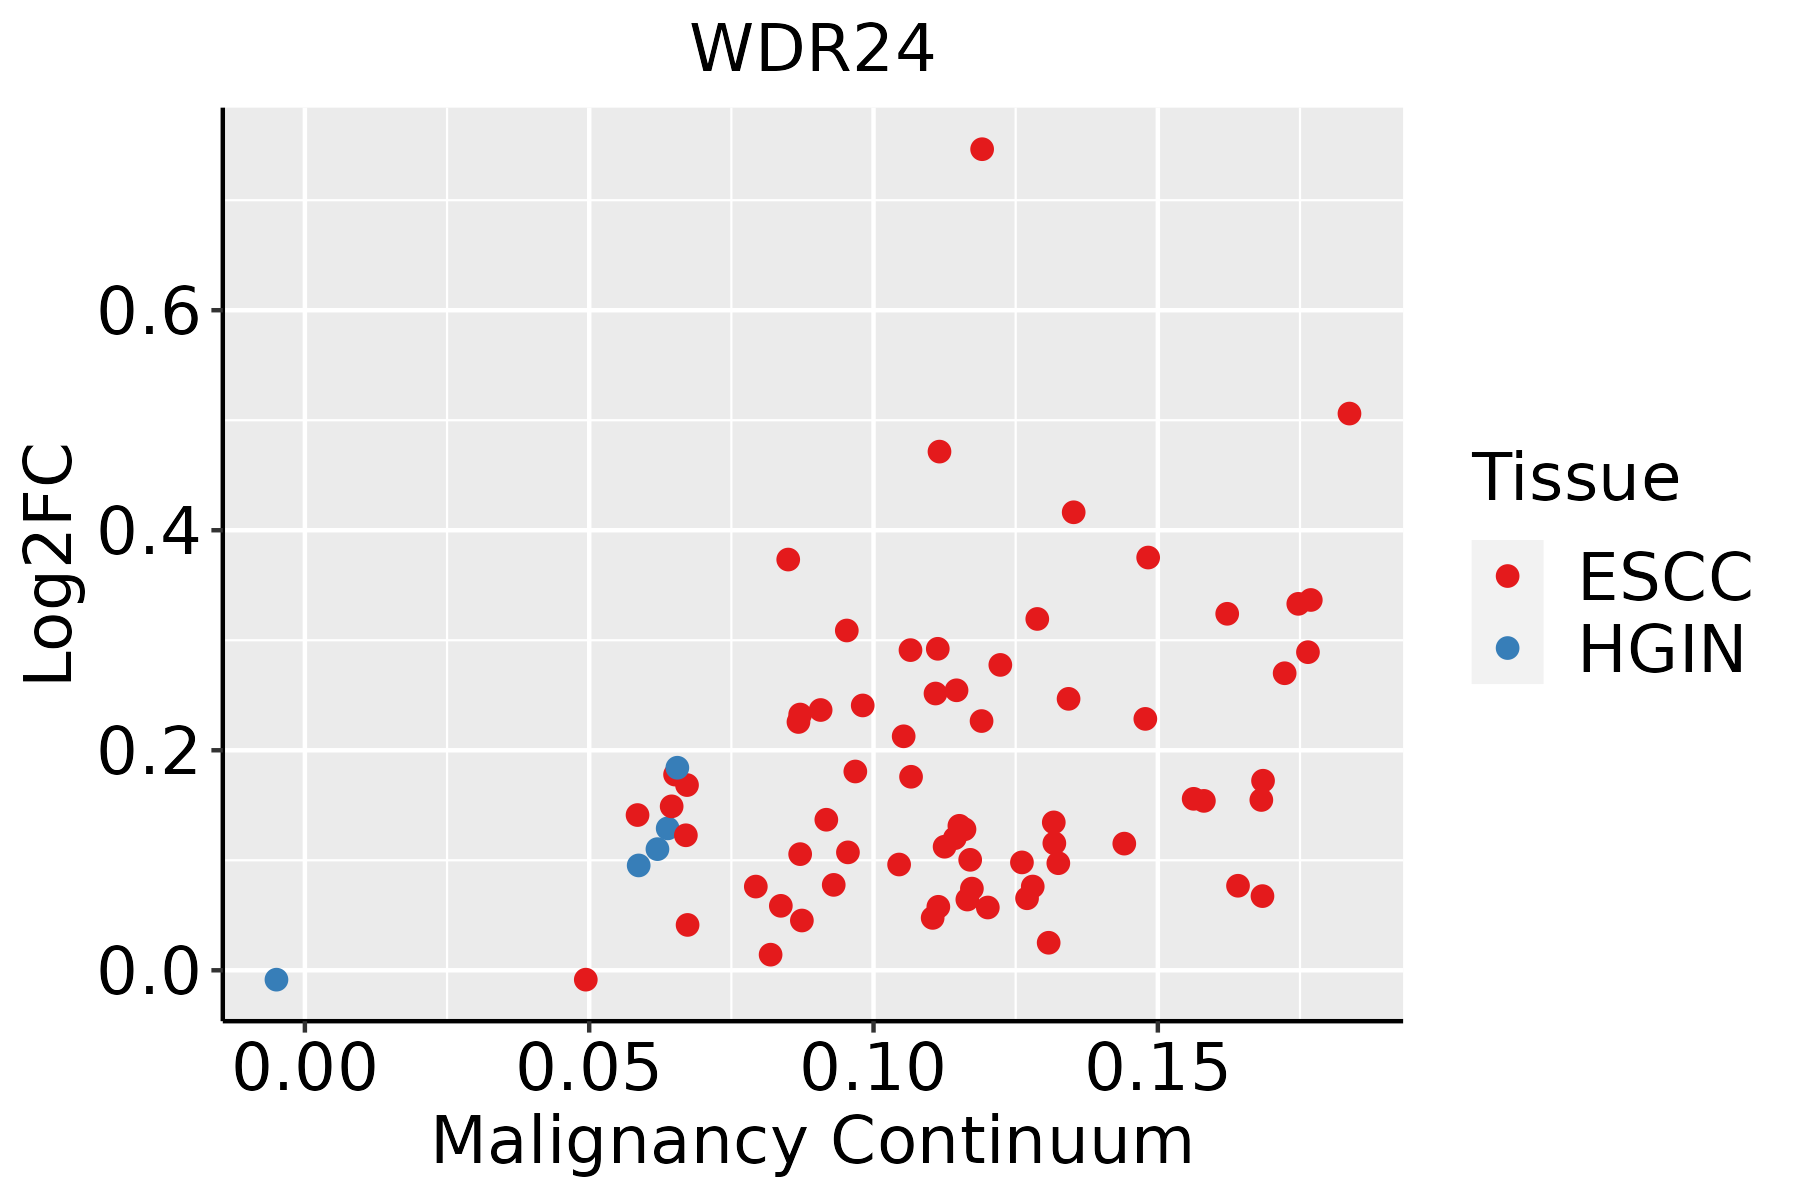 | ESCC: Esophageal squamous cell carcinoma |
| HGIN: High-grade intraepithelial neoplasias | ||
| LGIN: Low-grade intraepithelial neoplasias | ||
| Oral Cavity | 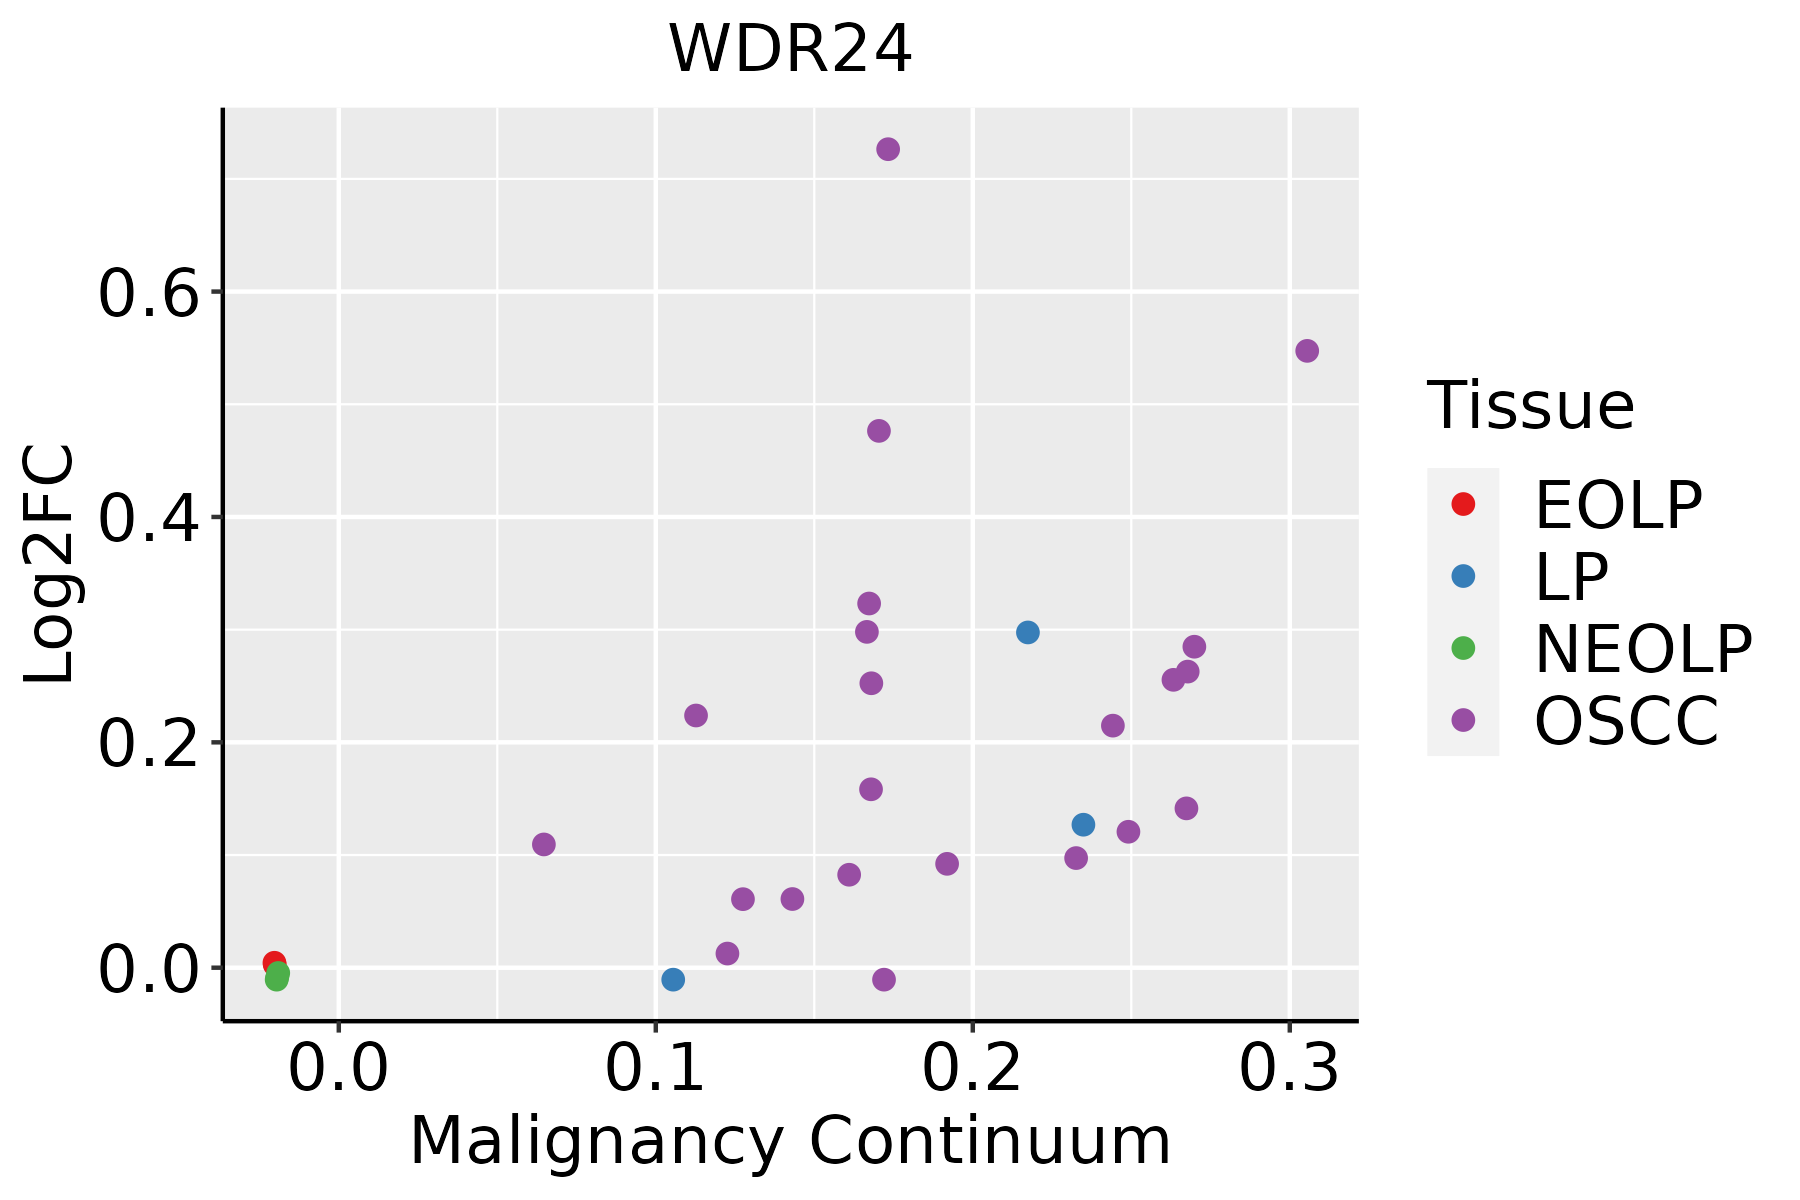 | EOLP: Erosive Oral lichen planus |
| LP: leukoplakia | ||
| NEOLP: Non-erosive oral lichen planus | ||
| OSCC: Oral squamous cell carcinoma |
| ∗log2FC in expression of this searched gene in stem-like cells from each diseased tissue sample relative to stem-like cells in normal samples in each tissue plotted against the malignancy continuum. Samples are colored based on if they are from different disease stage. |
Top |
Malignant transformation related pathway analysis |
| Find out the enriched GO biological processes and KEGG pathways involved in transition from healthy to precancer to cancer |
| Tissue | Disease Stage | Enriched GO biological Processes |
| Colorectum | AD |  |
| Colorectum | SER |  |
| Colorectum | MSS |  |
| Colorectum | MSI-H |  |
| Colorectum | FAP |  |
| ∗Top 15 enriched GO BP terms are showed in the bar plot of each disease state in each tissue. Each row represents a significant GO biological process which is colored according to the -log10(p.adjust). |
| Page: 1 2 3 4 5 6 7 8 9 |
| GO ID | Tissue | Disease Stage | Description | Gene Ratio | Bg Ratio | pvalue | p.adjust | Count |
| GO:001050617 | Esophagus | ESCC | regulation of autophagy | 220/8552 | 317/18723 | 6.72e-18 | 6.36e-16 | 220 |
| GO:0071496111 | Esophagus | ESCC | cellular response to external stimulus | 215/8552 | 320/18723 | 4.29e-15 | 2.43e-13 | 215 |
| GO:0031668111 | Esophagus | ESCC | cellular response to extracellular stimulus | 168/8552 | 246/18723 | 4.93e-13 | 2.23e-11 | 168 |
| GO:0031669110 | Esophagus | ESCC | cellular response to nutrient levels | 148/8552 | 215/18723 | 4.58e-12 | 1.76e-10 | 148 |
| GO:0031667111 | Esophagus | ESCC | response to nutrient levels | 289/8552 | 474/18723 | 9.25e-12 | 3.47e-10 | 289 |
| GO:0009267110 | Esophagus | ESCC | cellular response to starvation | 110/8552 | 156/18723 | 2.63e-10 | 7.37e-09 | 110 |
| GO:004259419 | Esophagus | ESCC | response to starvation | 133/8552 | 197/18723 | 4.31e-10 | 1.14e-08 | 133 |
| GO:19909284 | Esophagus | ESCC | response to amino acid starvation | 37/8552 | 49/18723 | 2.05e-05 | 1.78e-04 | 37 |
| GO:00319294 | Esophagus | ESCC | TOR signaling | 79/8552 | 126/18723 | 8.57e-05 | 6.21e-04 | 79 |
| GO:00341984 | Esophagus | ESCC | cellular response to amino acid starvation | 34/8552 | 46/18723 | 9.39e-05 | 6.70e-04 | 34 |
| GO:00320061 | Esophagus | ESCC | regulation of TOR signaling | 63/8552 | 104/18723 | 1.55e-03 | 7.29e-03 | 63 |
| GO:00320082 | Esophagus | ESCC | positive regulation of TOR signaling | 31/8552 | 47/18723 | 4.01e-03 | 1.62e-02 | 31 |
| GO:001050610 | Oral cavity | OSCC | regulation of autophagy | 198/7305 | 317/18723 | 1.63e-17 | 1.51e-15 | 198 |
| GO:007149620 | Oral cavity | OSCC | cellular response to external stimulus | 186/7305 | 320/18723 | 2.56e-12 | 1.05e-10 | 186 |
| GO:003166819 | Oral cavity | OSCC | cellular response to extracellular stimulus | 141/7305 | 246/18723 | 3.99e-09 | 8.95e-08 | 141 |
| GO:003166720 | Oral cavity | OSCC | response to nutrient levels | 245/7305 | 474/18723 | 1.02e-08 | 2.10e-07 | 245 |
| GO:003166918 | Oral cavity | OSCC | cellular response to nutrient levels | 121/7305 | 215/18723 | 1.96e-07 | 3.17e-06 | 121 |
| GO:004259416 | Oral cavity | OSCC | response to starvation | 111/7305 | 197/18723 | 5.68e-07 | 8.19e-06 | 111 |
| GO:000926717 | Oral cavity | OSCC | cellular response to starvation | 91/7305 | 156/18723 | 7.55e-07 | 1.06e-05 | 91 |
| GO:19909283 | Oral cavity | OSCC | response to amino acid starvation | 33/7305 | 49/18723 | 5.49e-05 | 4.54e-04 | 33 |
| Page: 1 2 |
| Pathway ID | Tissue | Disease Stage | Description | Gene Ratio | Bg Ratio | pvalue | p.adjust | qvalue | Count |
| hsa041505 | Esophagus | ESCC | mTOR signaling pathway | 98/4205 | 156/8465 | 5.81e-04 | 1.95e-03 | 9.97e-04 | 98 |
| hsa0415013 | Esophagus | ESCC | mTOR signaling pathway | 98/4205 | 156/8465 | 5.81e-04 | 1.95e-03 | 9.97e-04 | 98 |
| hsa041504 | Oral cavity | OSCC | mTOR signaling pathway | 90/3704 | 156/8465 | 2.87e-04 | 9.15e-04 | 4.66e-04 | 90 |
| hsa0415012 | Oral cavity | OSCC | mTOR signaling pathway | 90/3704 | 156/8465 | 2.87e-04 | 9.15e-04 | 4.66e-04 | 90 |
| Page: 1 |
Top |
Cell-cell communication analysis |
| Identification of potential cell-cell interactions between two cell types and their ligand-receptor pairs for different disease states |
| Ligand | Receptor | LRpair | Pathway | Tissue | Disease Stage |
| Page: 1 |
Top |
Single-cell gene regulatory network inference analysis |
| Find out the significant the regulons (TFs) and the target genes of each regulon across cell types for different disease states |
| TF | Cell Type | Tissue | Disease Stage | Target Gene | RSS | Regulon Activity |
| ∗The dot plots of a searched regulon are shown for all cell subpopulations in each disease state of each tissue based on the regulon specific score inferred using pySCENIC and by calculating the average expression. |
| Page: 1 |
Top |
Somatic mutation of malignant transformation related genes |
| Annotation of somatic variants for genes involved in malignant transformation |
| Hugo Symbol | Variant Class | Variant Classification | dbSNP RS | HGVSc | HGVSp | HGVSp Short | SWISSPROT | BIOTYPE | SIFT | PolyPhen | Tumor Sample Barcode | Tissue | Histology | Sex | Age | Stage | Therapy Types | Drugs | Outcome |
| WDR24 | SNV | Missense_Mutation | novel | c.824A>T | p.Asp275Val | p.D275V | Q96S15 | protein_coding | deleterious(0) | probably_damaging(0.999) | TCGA-AC-A5EH-01 | Breast | breast invasive carcinoma | Female | >=65 | I/II | Unknown | Unknown | SD |
| WDR24 | SNV | Missense_Mutation | c.593G>A | p.Arg198Gln | p.R198Q | Q96S15 | protein_coding | deleterious(0.01) | possibly_damaging(0.483) | TCGA-AR-A0U2-01 | Breast | breast invasive carcinoma | Female | <65 | III/IV | Hormone Therapy | tamoxiphen | PD | |
| WDR24 | deletion | Frame_Shift_Del | novel | c.1982delG | p.Gly661ValfsTer39 | p.G661Vfs*39 | Q96S15 | protein_coding | TCGA-D8-A27V-01 | Breast | breast invasive carcinoma | Female | <65 | I/II | Hormone Therapy | tamoxiphen | SD | ||
| WDR24 | SNV | Missense_Mutation | novel | c.205C>T | p.Arg69Cys | p.R69C | Q96S15 | protein_coding | deleterious(0) | probably_damaging(0.968) | TCGA-2W-A8YY-01 | Cervix | cervical & endocervical cancer | Female | <65 | I/II | Chemotherapy | cisplatin | CR |
| WDR24 | SNV | Missense_Mutation | rs375731444 | c.1087N>A | p.Glu363Lys | p.E363K | Q96S15 | protein_coding | tolerated(0.42) | benign(0.042) | TCGA-C5-A3HD-01 | Cervix | cervical & endocervical cancer | Female | <65 | I/II | Chemotherapy | cisplatin | SD |
| WDR24 | SNV | Missense_Mutation | c.445G>C | p.Asp149His | p.D149H | Q96S15 | protein_coding | deleterious(0) | probably_damaging(0.999) | TCGA-IR-A3LH-01 | Cervix | cervical & endocervical cancer | Female | <65 | I/II | Chemotherapy | cisplatin | CR | |
| WDR24 | SNV | Missense_Mutation | novel | c.1781N>T | p.Ser594Phe | p.S594F | Q96S15 | protein_coding | deleterious(0.03) | probably_damaging(0.997) | TCGA-MA-AA41-01 | Cervix | cervical & endocervical cancer | Female | <65 | I/II | Unknown | Unknown | SD |
| WDR24 | SNV | Missense_Mutation | rs377491057 | c.1496G>A | p.Arg499Gln | p.R499Q | Q96S15 | protein_coding | tolerated(0.24) | benign(0.091) | TCGA-AA-3511-01 | Colorectum | colon adenocarcinoma | Male | <65 | I/II | Unknown | Unknown | PD |
| WDR24 | SNV | Missense_Mutation | novel | c.499N>T | p.Arg167Trp | p.R167W | Q96S15 | protein_coding | deleterious(0) | probably_damaging(0.999) | TCGA-AA-3949-01 | Colorectum | colon adenocarcinoma | Female | >=65 | III/IV | Unknown | Unknown | SD |
| WDR24 | SNV | Missense_Mutation | rs561673037 | c.1117C>T | p.Arg373Trp | p.R373W | Q96S15 | protein_coding | deleterious(0) | probably_damaging(0.93) | TCGA-AZ-6601-01 | Colorectum | colon adenocarcinoma | Male | >=65 | I/II | Unknown | Unknown | PD |
| Page: 1 2 3 4 5 6 7 |
Top |
Related drugs of malignant transformation related genes |
| Identification of chemicals and drugs interact with genes involved in malignant transfromation |
| (DGIdb 4.0) |
| Entrez ID | Symbol | Category | Interaction Types | Drug Claim Name | Drug Name | PMIDs |
| Page: 1 |

Copyright 2023-Present -The University of Texas Health Science Center at Houston |