
|
|||||
|
 | |
| |
| |
| |
| |
| |
|
Gene: WDR20 |
Gene summary for WDR20 |
| Gene information | Species | Human | Gene symbol | WDR20 | Gene ID | 91833 |
| Gene name | WD repeat domain 20 | |
| Gene Alias | Bun107 | |
| Cytomap | 14q32.31 | |
| Gene Type | protein-coding | GO ID | GO:0005575 | UniProtAcc | Q8TBZ3 |
Top |
Malignant transformation analysis |
| Identification of the aberrant gene expression in precancerous and cancerous lesions by comparing the gene expression of stem-like cells in diseased tissues with normal stem cells |
| Entrez ID | Symbol | Replicates | Species | Organ | Tissue | Adj P-value | Log2FC | Malignancy |
| 91833 | WDR20 | CCI_1 | Human | Cervix | CC | 1.59e-06 | 5.68e-01 | 0.528 |
| 91833 | WDR20 | CCI_2 | Human | Cervix | CC | 3.53e-04 | 6.09e-01 | 0.5249 |
| 91833 | WDR20 | CCI_3 | Human | Cervix | CC | 2.53e-02 | 4.15e-01 | 0.516 |
| 91833 | WDR20 | LZE2T | Human | Esophagus | ESCC | 3.05e-03 | 3.00e-01 | 0.082 |
| 91833 | WDR20 | LZE4T | Human | Esophagus | ESCC | 3.68e-13 | 2.64e-01 | 0.0811 |
| 91833 | WDR20 | LZE7T | Human | Esophagus | ESCC | 3.32e-03 | 1.51e-01 | 0.0667 |
| 91833 | WDR20 | LZE8T | Human | Esophagus | ESCC | 8.13e-04 | 7.06e-02 | 0.067 |
| 91833 | WDR20 | LZE20T | Human | Esophagus | ESCC | 3.58e-04 | 1.57e-01 | 0.0662 |
| 91833 | WDR20 | LZE24T | Human | Esophagus | ESCC | 1.87e-07 | 3.53e-01 | 0.0596 |
| 91833 | WDR20 | P1T-E | Human | Esophagus | ESCC | 3.41e-04 | 1.22e-01 | 0.0875 |
| 91833 | WDR20 | P2T-E | Human | Esophagus | ESCC | 1.20e-16 | 2.22e-01 | 0.1177 |
| 91833 | WDR20 | P4T-E | Human | Esophagus | ESCC | 3.44e-18 | 3.70e-01 | 0.1323 |
| 91833 | WDR20 | P5T-E | Human | Esophagus | ESCC | 2.01e-08 | 2.14e-01 | 0.1327 |
| 91833 | WDR20 | P8T-E | Human | Esophagus | ESCC | 2.62e-21 | 4.32e-01 | 0.0889 |
| 91833 | WDR20 | P9T-E | Human | Esophagus | ESCC | 7.63e-15 | 1.78e-01 | 0.1131 |
| 91833 | WDR20 | P10T-E | Human | Esophagus | ESCC | 5.78e-28 | 4.06e-01 | 0.116 |
| 91833 | WDR20 | P11T-E | Human | Esophagus | ESCC | 5.12e-14 | 3.53e-01 | 0.1426 |
| 91833 | WDR20 | P12T-E | Human | Esophagus | ESCC | 6.78e-47 | 7.93e-01 | 0.1122 |
| 91833 | WDR20 | P15T-E | Human | Esophagus | ESCC | 4.82e-37 | 8.45e-01 | 0.1149 |
| 91833 | WDR20 | P16T-E | Human | Esophagus | ESCC | 3.21e-17 | 2.70e-01 | 0.1153 |
| Page: 1 2 3 4 |
| Tissue | Expression Dynamics | Abbreviation |
| Cervix | 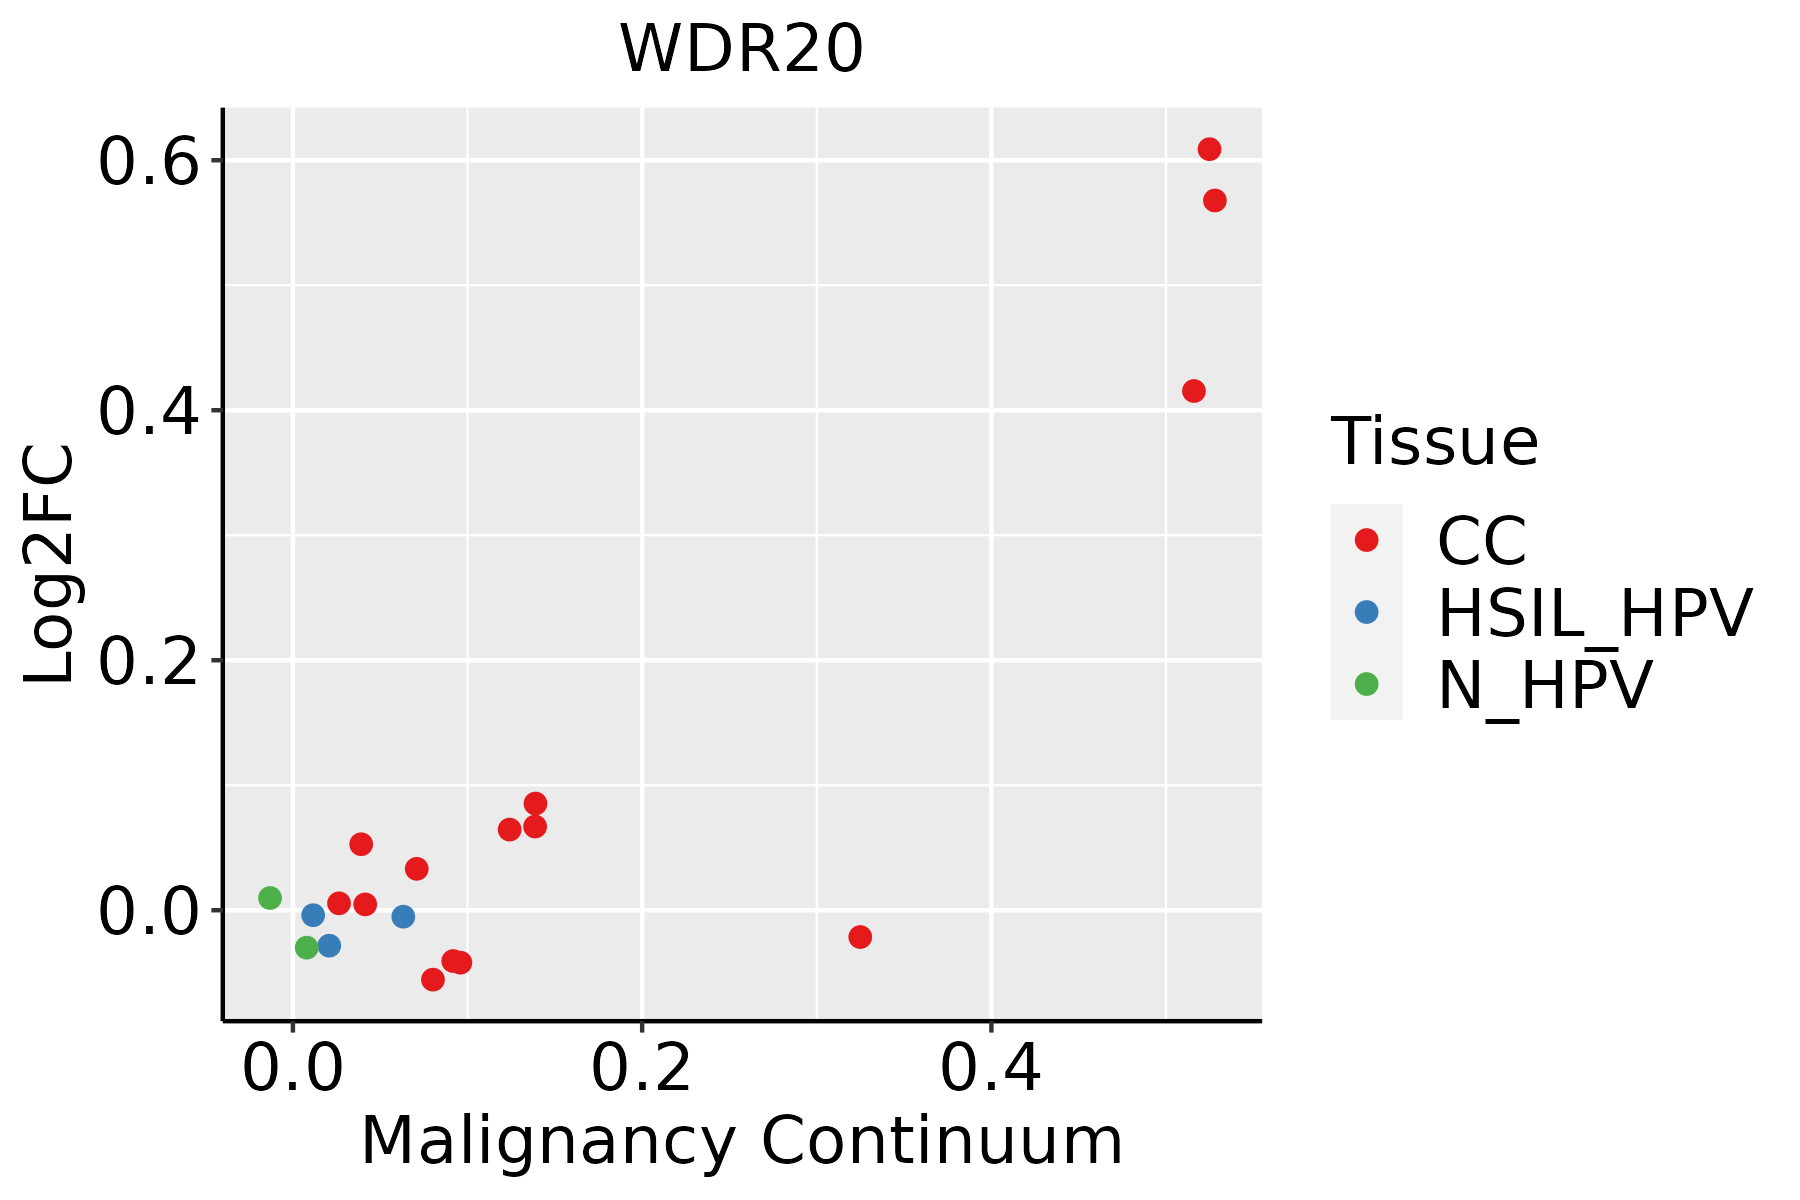 | CC: Cervix cancer |
| HSIL_HPV: HPV-infected high-grade squamous intraepithelial lesions | ||
| N_HPV: HPV-infected normal cervix | ||
| Esophagus |  | ESCC: Esophageal squamous cell carcinoma |
| HGIN: High-grade intraepithelial neoplasias | ||
| LGIN: Low-grade intraepithelial neoplasias | ||
| Oral Cavity | 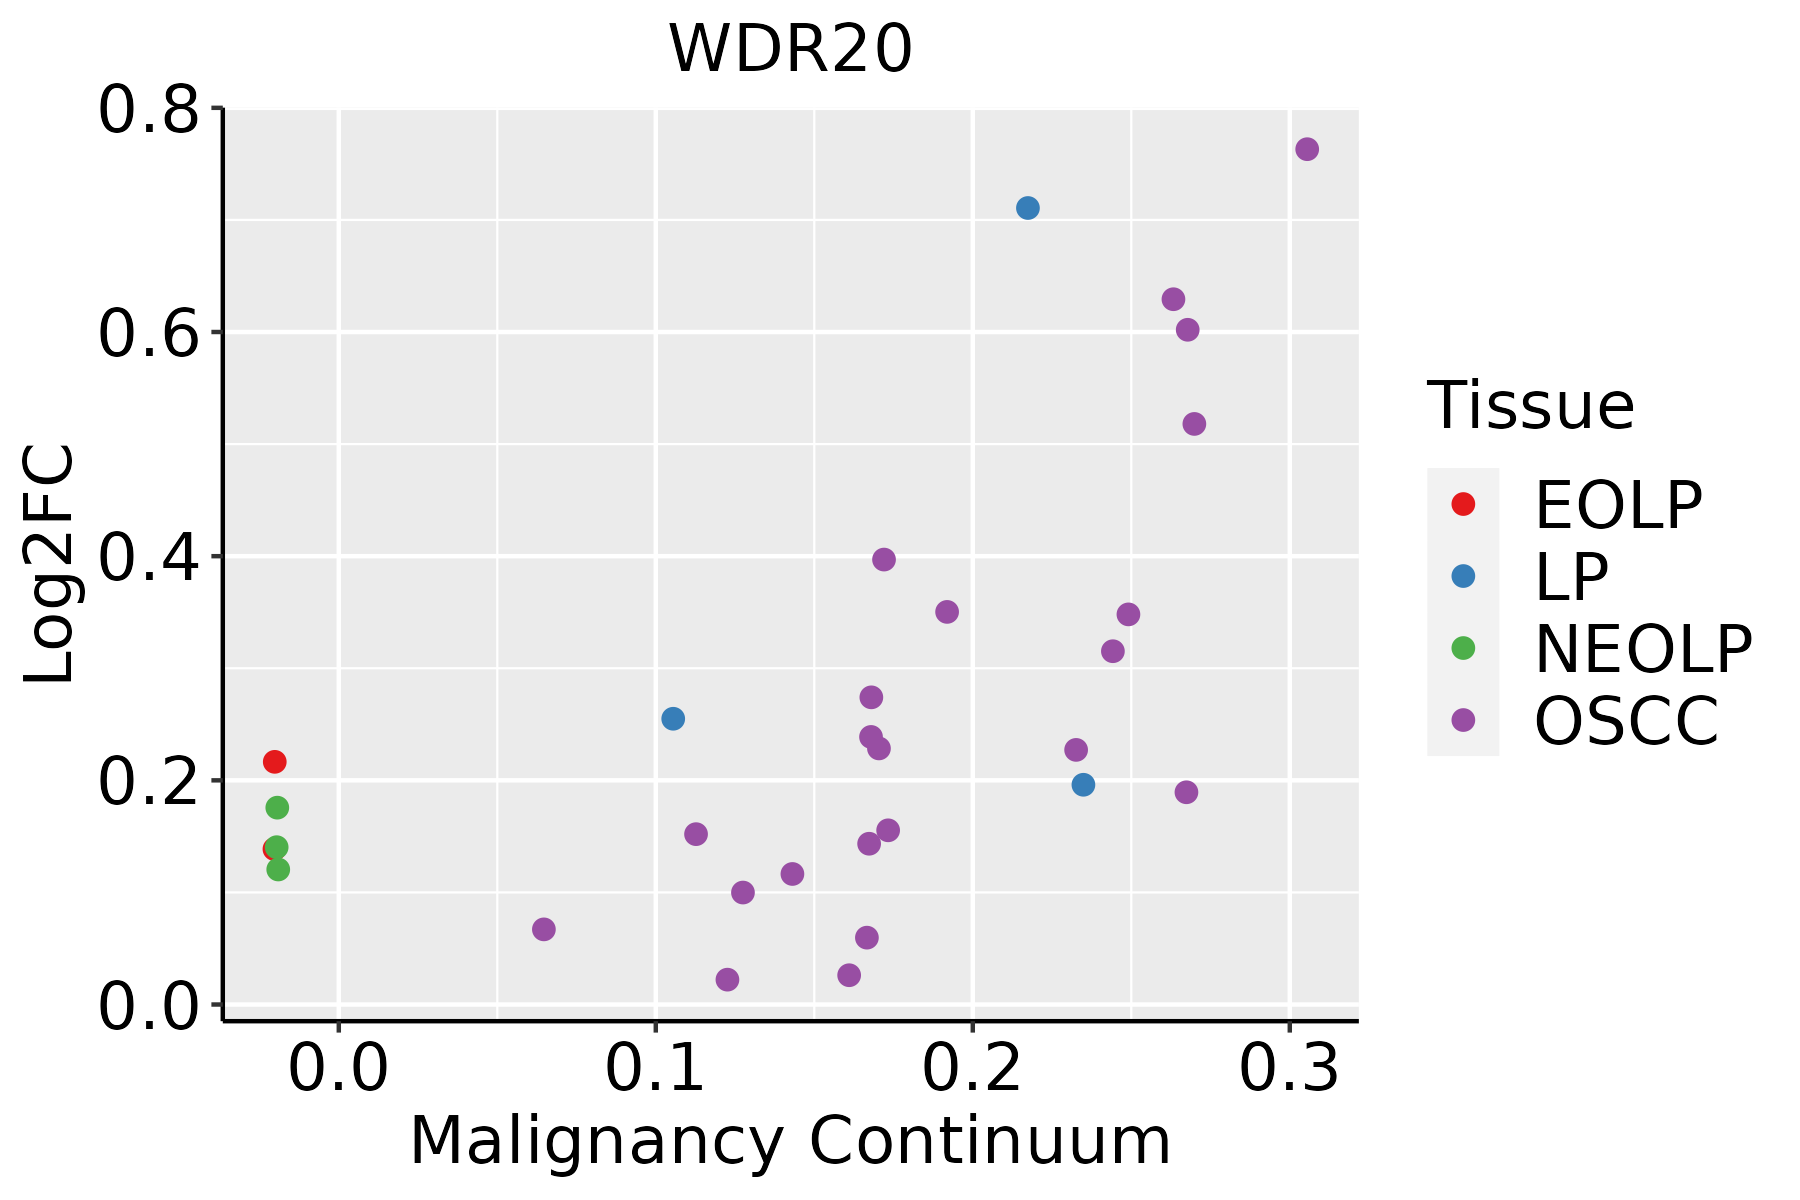 | EOLP: Erosive Oral lichen planus |
| LP: leukoplakia | ||
| NEOLP: Non-erosive oral lichen planus | ||
| OSCC: Oral squamous cell carcinoma |
| ∗log2FC in expression of this searched gene in stem-like cells from each diseased tissue sample relative to stem-like cells in normal samples in each tissue plotted against the malignancy continuum. Samples are colored based on if they are from different disease stage. |
Top |
Malignant transformation related pathway analysis |
| Find out the enriched GO biological processes and KEGG pathways involved in transition from healthy to precancer to cancer |
| Tissue | Disease Stage | Enriched GO biological Processes |
| Colorectum | AD |  |
| Colorectum | SER |  |
| Colorectum | MSS |  |
| Colorectum | MSI-H |  |
| Colorectum | FAP |  |
| ∗Top 15 enriched GO BP terms are showed in the bar plot of each disease state in each tissue. Each row represents a significant GO biological process which is colored according to the -log10(p.adjust). |
| Page: 1 2 3 4 5 6 7 8 9 |
| GO ID | Tissue | Disease Stage | Description | Gene Ratio | Bg Ratio | pvalue | p.adjust | Count |
| Page: 1 |
| Pathway ID | Tissue | Disease Stage | Description | Gene Ratio | Bg Ratio | pvalue | p.adjust | qvalue | Count |
| Page: 1 |
Top |
Cell-cell communication analysis |
| Identification of potential cell-cell interactions between two cell types and their ligand-receptor pairs for different disease states |
| Ligand | Receptor | LRpair | Pathway | Tissue | Disease Stage |
| Page: 1 |
Top |
Single-cell gene regulatory network inference analysis |
| Find out the significant the regulons (TFs) and the target genes of each regulon across cell types for different disease states |
| TF | Cell Type | Tissue | Disease Stage | Target Gene | RSS | Regulon Activity |
| ∗The dot plots of a searched regulon are shown for all cell subpopulations in each disease state of each tissue based on the regulon specific score inferred using pySCENIC and by calculating the average expression. |
| Page: 1 |
Top |
Somatic mutation of malignant transformation related genes |
| Annotation of somatic variants for genes involved in malignant transformation |
| Hugo Symbol | Variant Class | Variant Classification | dbSNP RS | HGVSc | HGVSp | HGVSp Short | SWISSPROT | BIOTYPE | SIFT | PolyPhen | Tumor Sample Barcode | Tissue | Histology | Sex | Age | Stage | Therapy Types | Drugs | Outcome |
| WDR20 | SNV | Missense_Mutation | c.680G>A | p.Gly227Glu | p.G227E | protein_coding | deleterious(0) | probably_damaging(1) | TCGA-AR-A1AV-01 | Breast | breast invasive carcinoma | Male | >=65 | I/II | Chemotherapy | cytoxan | SD | ||
| WDR20 | SNV | Missense_Mutation | novel | c.156N>A | p.Phe52Leu | p.F52L | protein_coding | tolerated(0.18) | benign(0.019) | TCGA-UL-AAZ6-01 | Breast | breast invasive carcinoma | Female | >=65 | I/II | Chemotherapy | herceptin | SD | |
| WDR20 | insertion | In_Frame_Ins | novel | c.1334_1335insATCAGTTACTCTGGCCTTTGCCTCCTTTCTGGTGCC | p.Asn445delinsLysSerValThrLeuAlaPheAlaSerPheLeuValPro | p.N445delinsKSVTLAFASFLVP | protein_coding | TCGA-A8-A0A1-01 | Breast | breast invasive carcinoma | Female | >=65 | I/II | Hormone Therapy | tamoxiphen | SD | |||
| WDR20 | insertion | Frame_Shift_Ins | novel | c.6_7insTATTGTAAAATACGTGTTTTCAATGTAAAAT | p.Thr3TyrfsTer22 | p.T3Yfs*22 | protein_coding | TCGA-AO-A03R-01 | Breast | breast invasive carcinoma | Female | <65 | I/II | Chemotherapy | doxorubicin | SD | |||
| WDR20 | insertion | Nonsense_Mutation | novel | c.1810_1811insGATCTGGATAGGAATTAAATAGATGAAGTGGAGGGTTTGCTCCCACACTGGCTT | p.Ala604delinsGlySerGlyTerGluLeuAsnArgTerSerGlyGlyPheAlaProThrLeuAlaSer | p.A604delinsGSG*ELNR*SGGFAPTLAS | protein_coding | TCGA-B6-A0I6-01 | Breast | breast invasive carcinoma | Female | <65 | I/II | Unknown | Unknown | PD | |||
| WDR20 | SNV | Missense_Mutation | c.772N>T | p.Ala258Ser | p.A258S | protein_coding | tolerated(0.09) | benign(0.077) | TCGA-AY-6197-01 | Colorectum | colon adenocarcinoma | Male | <65 | I/II | Unknown | Unknown | SD | ||
| WDR20 | SNV | Missense_Mutation | c.1786G>A | p.Gly596Ser | p.G596S | protein_coding | tolerated(0.78) | probably_damaging(0.999) | TCGA-CM-5861-01 | Colorectum | colon adenocarcinoma | Female | <65 | I/II | Unknown | Unknown | PD | ||
| WDR20 | SNV | Missense_Mutation | novel | c.1487C>T | p.Ser496Leu | p.S496L | protein_coding | deleterious(0.01) | benign(0.138) | TCGA-A5-A0G2-01 | Endometrium | uterine corpus endometrioid carcinoma | Female | <65 | III/IV | Unknown | Unknown | SD | |
| WDR20 | SNV | Missense_Mutation | novel | c.1589C>T | p.Thr530Ile | p.T530I | protein_coding | tolerated(0.16) | benign(0.361) | TCGA-AJ-A2QO-01 | Endometrium | uterine corpus endometrioid carcinoma | Female | >=65 | I/II | Unknown | Unknown | SD | |
| WDR20 | SNV | Missense_Mutation | c.1011G>T | p.Trp337Cys | p.W337C | protein_coding | deleterious(0) | probably_damaging(1) | TCGA-AP-A051-01 | Endometrium | uterine corpus endometrioid carcinoma | Female | >=65 | I/II | Unknown | Unknown | SD |
| Page: 1 2 3 4 |
Top |
Related drugs of malignant transformation related genes |
| Identification of chemicals and drugs interact with genes involved in malignant transfromation |
| (DGIdb 4.0) |
| Entrez ID | Symbol | Category | Interaction Types | Drug Claim Name | Drug Name | PMIDs |
| Page: 1 |

Copyright 2023-Present -The University of Texas Health Science Center at Houston |