
|
|||||
|
 | |
| |
| |
| |
| |
| |
|
Gene: WDR13 |
Gene summary for WDR13 |
| Gene information | Species | Human | Gene symbol | WDR13 | Gene ID | 64743 |
| Gene name | WD repeat domain 13 | |
| Gene Alias | MG21 | |
| Cytomap | Xp11.23 | |
| Gene Type | protein-coding | GO ID | GO:0008150 | UniProtAcc | Q9H1Z4 |
Top |
Malignant transformation analysis |
| Identification of the aberrant gene expression in precancerous and cancerous lesions by comparing the gene expression of stem-like cells in diseased tissues with normal stem cells |
| Entrez ID | Symbol | Replicates | Species | Organ | Tissue | Adj P-value | Log2FC | Malignancy |
| 64743 | WDR13 | LZE4T | Human | Esophagus | ESCC | 9.13e-16 | 2.79e-01 | 0.0811 |
| 64743 | WDR13 | LZE7T | Human | Esophagus | ESCC | 1.99e-02 | 2.45e-01 | 0.0667 |
| 64743 | WDR13 | LZE8T | Human | Esophagus | ESCC | 1.53e-08 | 1.26e-01 | 0.067 |
| 64743 | WDR13 | LZE20T | Human | Esophagus | ESCC | 1.30e-05 | 2.00e-01 | 0.0662 |
| 64743 | WDR13 | LZE24T | Human | Esophagus | ESCC | 1.23e-14 | 3.36e-01 | 0.0596 |
| 64743 | WDR13 | LZE22D3 | Human | Esophagus | HGIN | 1.21e-03 | 4.15e-01 | 0.0653 |
| 64743 | WDR13 | P1T-E | Human | Esophagus | ESCC | 5.80e-04 | 2.12e-01 | 0.0875 |
| 64743 | WDR13 | P2T-E | Human | Esophagus | ESCC | 5.40e-34 | 5.36e-01 | 0.1177 |
| 64743 | WDR13 | P4T-E | Human | Esophagus | ESCC | 1.54e-12 | 3.11e-01 | 0.1323 |
| 64743 | WDR13 | P5T-E | Human | Esophagus | ESCC | 7.75e-15 | 2.28e-01 | 0.1327 |
| 64743 | WDR13 | P8T-E | Human | Esophagus | ESCC | 9.23e-20 | 2.99e-01 | 0.0889 |
| 64743 | WDR13 | P9T-E | Human | Esophagus | ESCC | 4.05e-20 | 4.12e-01 | 0.1131 |
| 64743 | WDR13 | P10T-E | Human | Esophagus | ESCC | 5.57e-19 | 2.07e-01 | 0.116 |
| 64743 | WDR13 | P11T-E | Human | Esophagus | ESCC | 3.79e-19 | 6.37e-01 | 0.1426 |
| 64743 | WDR13 | P12T-E | Human | Esophagus | ESCC | 8.39e-17 | 2.58e-01 | 0.1122 |
| 64743 | WDR13 | P15T-E | Human | Esophagus | ESCC | 1.27e-13 | 2.59e-01 | 0.1149 |
| 64743 | WDR13 | P16T-E | Human | Esophagus | ESCC | 1.02e-31 | 4.88e-01 | 0.1153 |
| 64743 | WDR13 | P17T-E | Human | Esophagus | ESCC | 6.48e-10 | 5.44e-01 | 0.1278 |
| 64743 | WDR13 | P19T-E | Human | Esophagus | ESCC | 7.22e-11 | 9.42e-01 | 0.1662 |
| 64743 | WDR13 | P20T-E | Human | Esophagus | ESCC | 3.08e-16 | 2.72e-01 | 0.1124 |
| Page: 1 2 3 4 5 6 7 |
| Tissue | Expression Dynamics | Abbreviation |
| Esophagus | 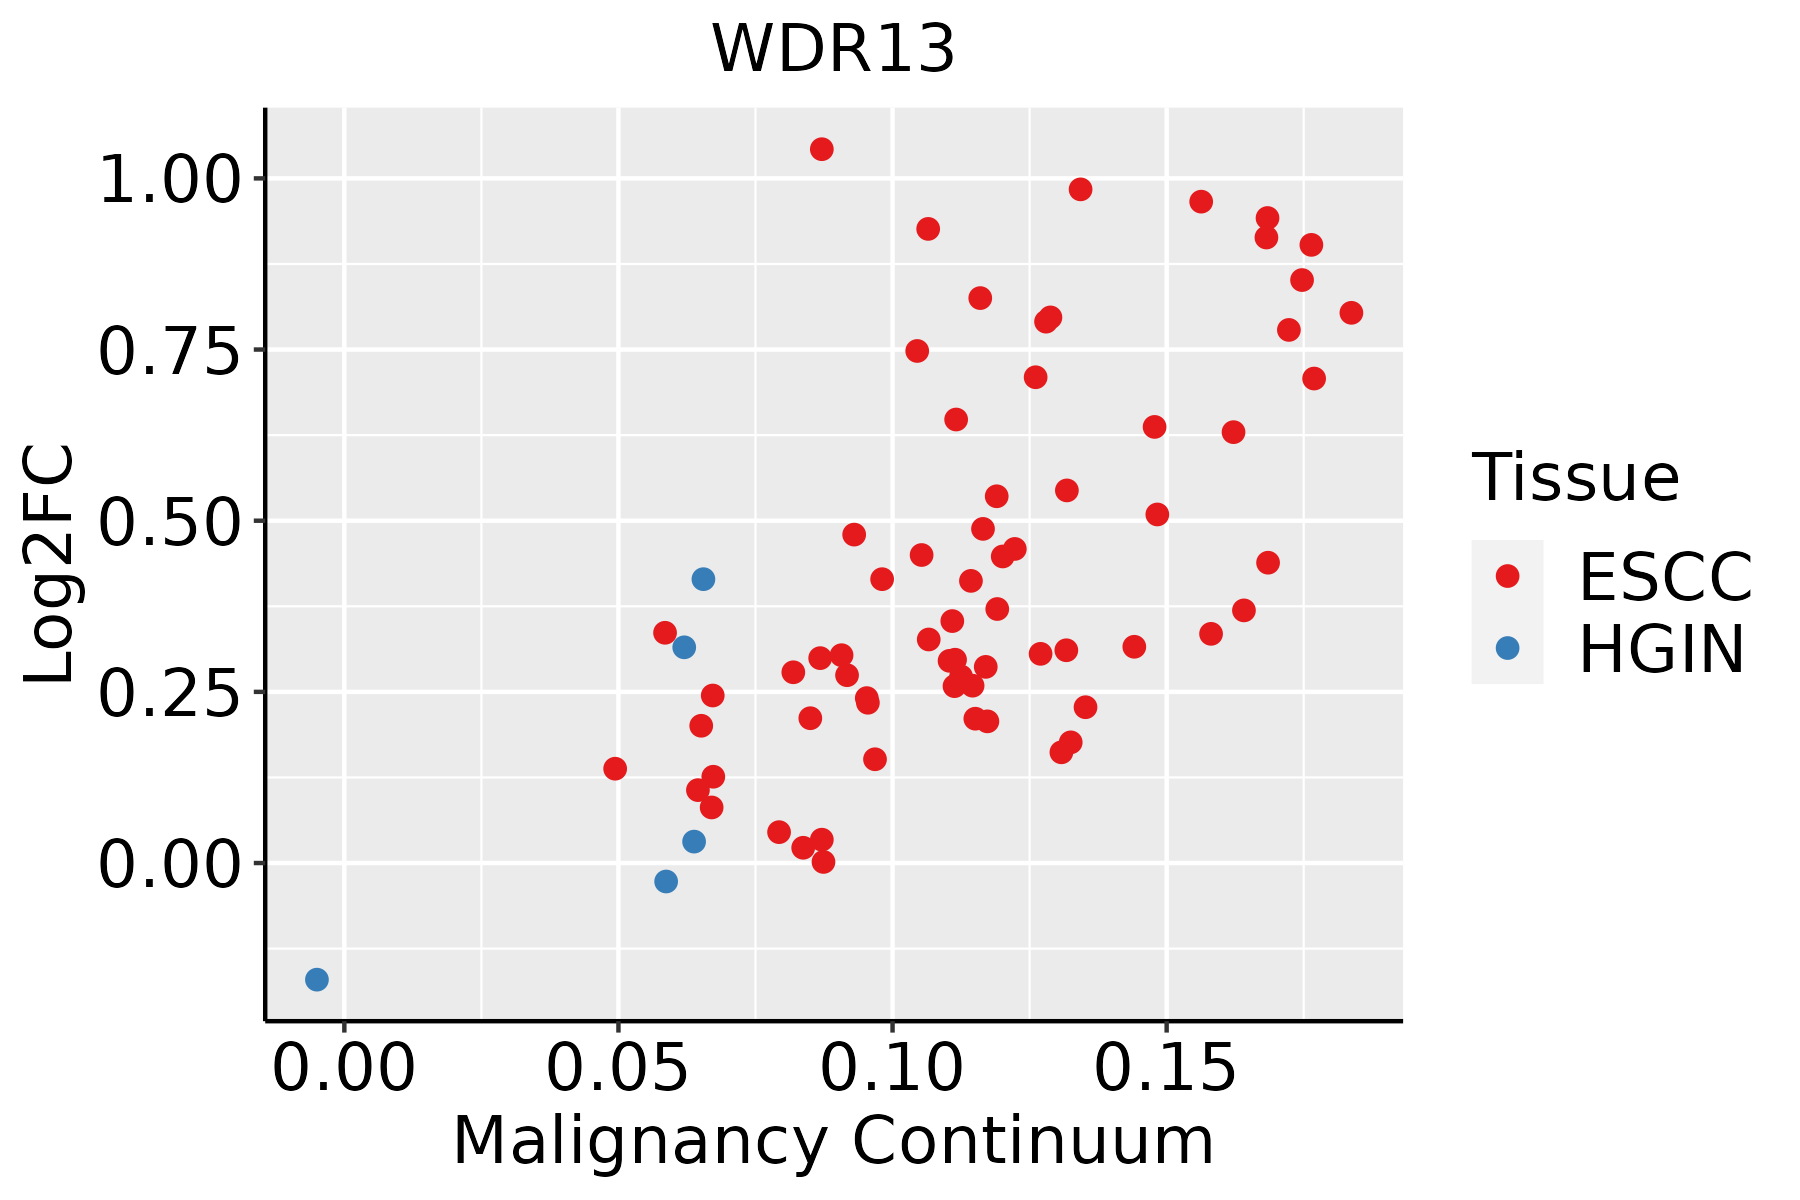 | ESCC: Esophageal squamous cell carcinoma |
| HGIN: High-grade intraepithelial neoplasias | ||
| LGIN: Low-grade intraepithelial neoplasias | ||
| Liver | 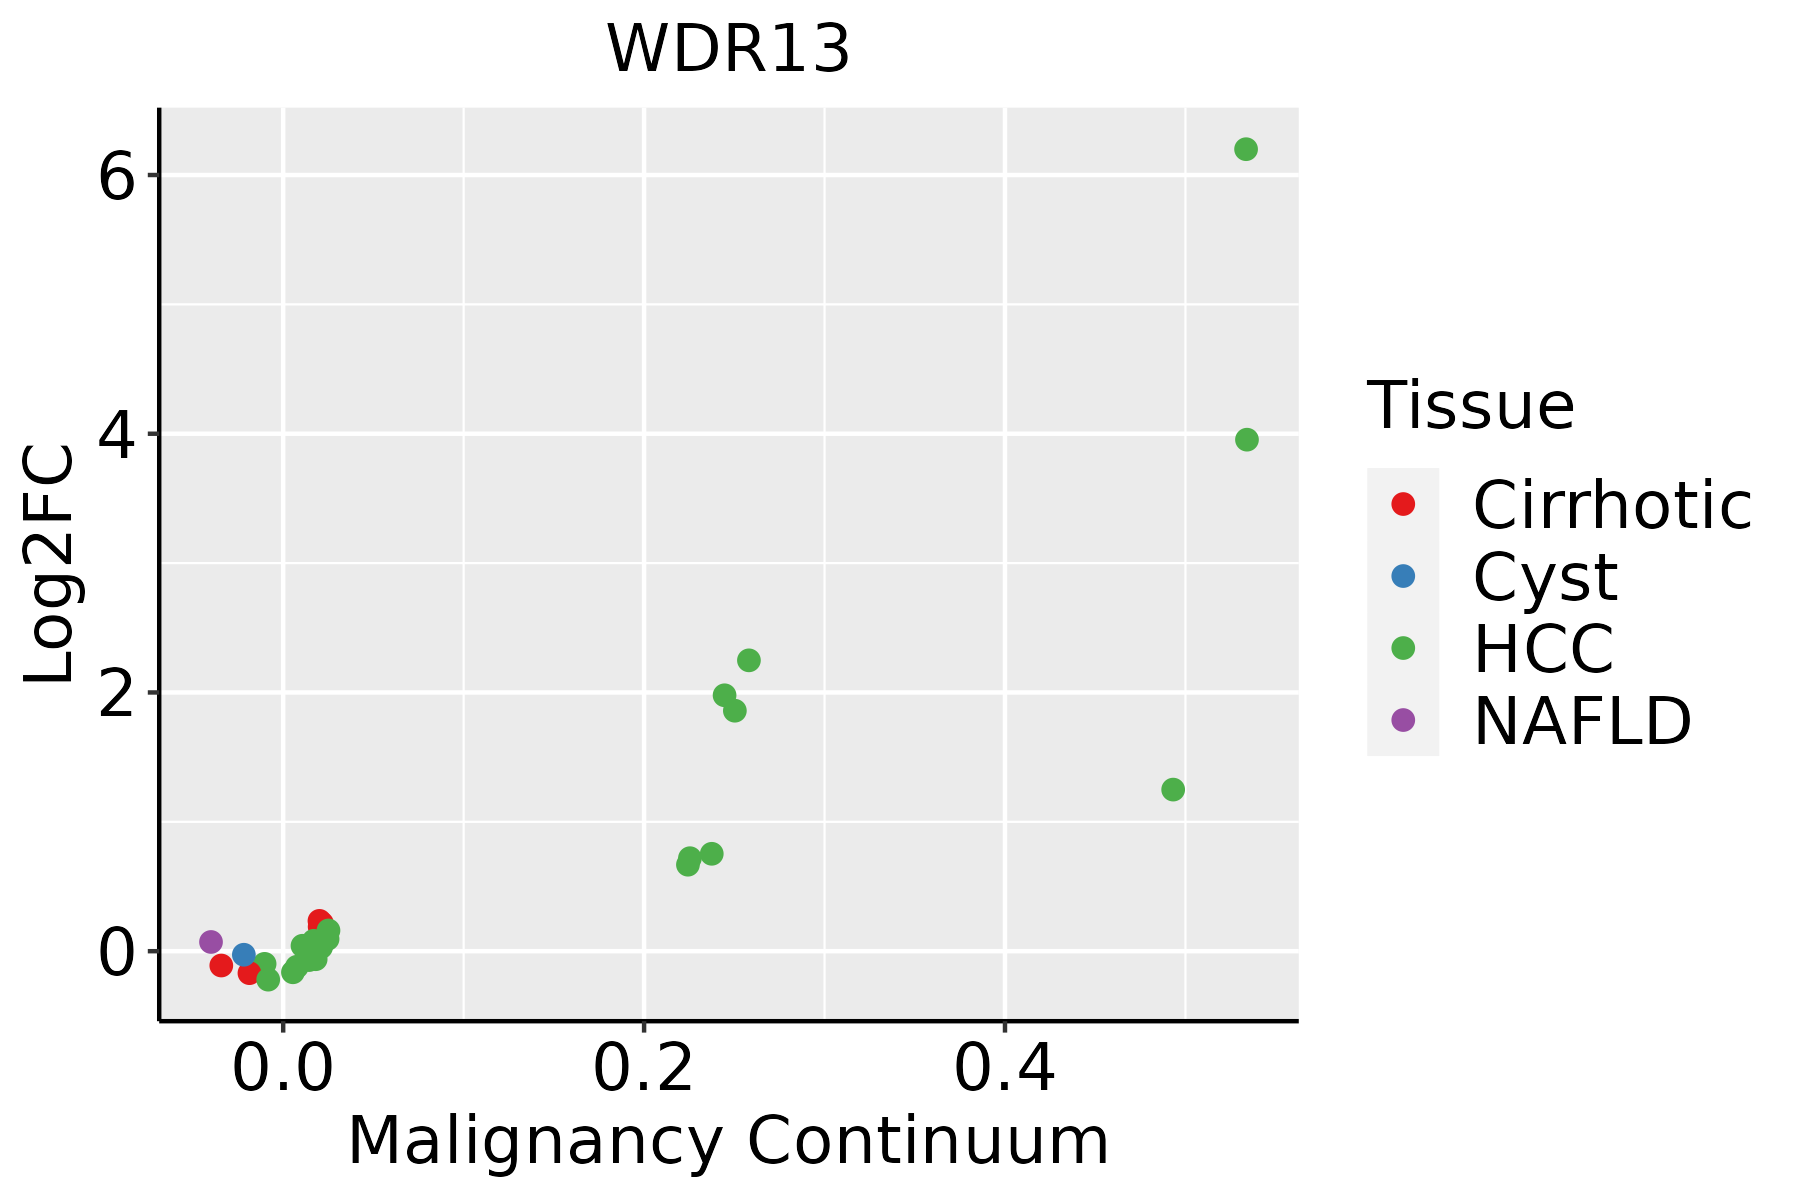 | HCC: Hepatocellular carcinoma |
| NAFLD: Non-alcoholic fatty liver disease | ||
| Oral Cavity | 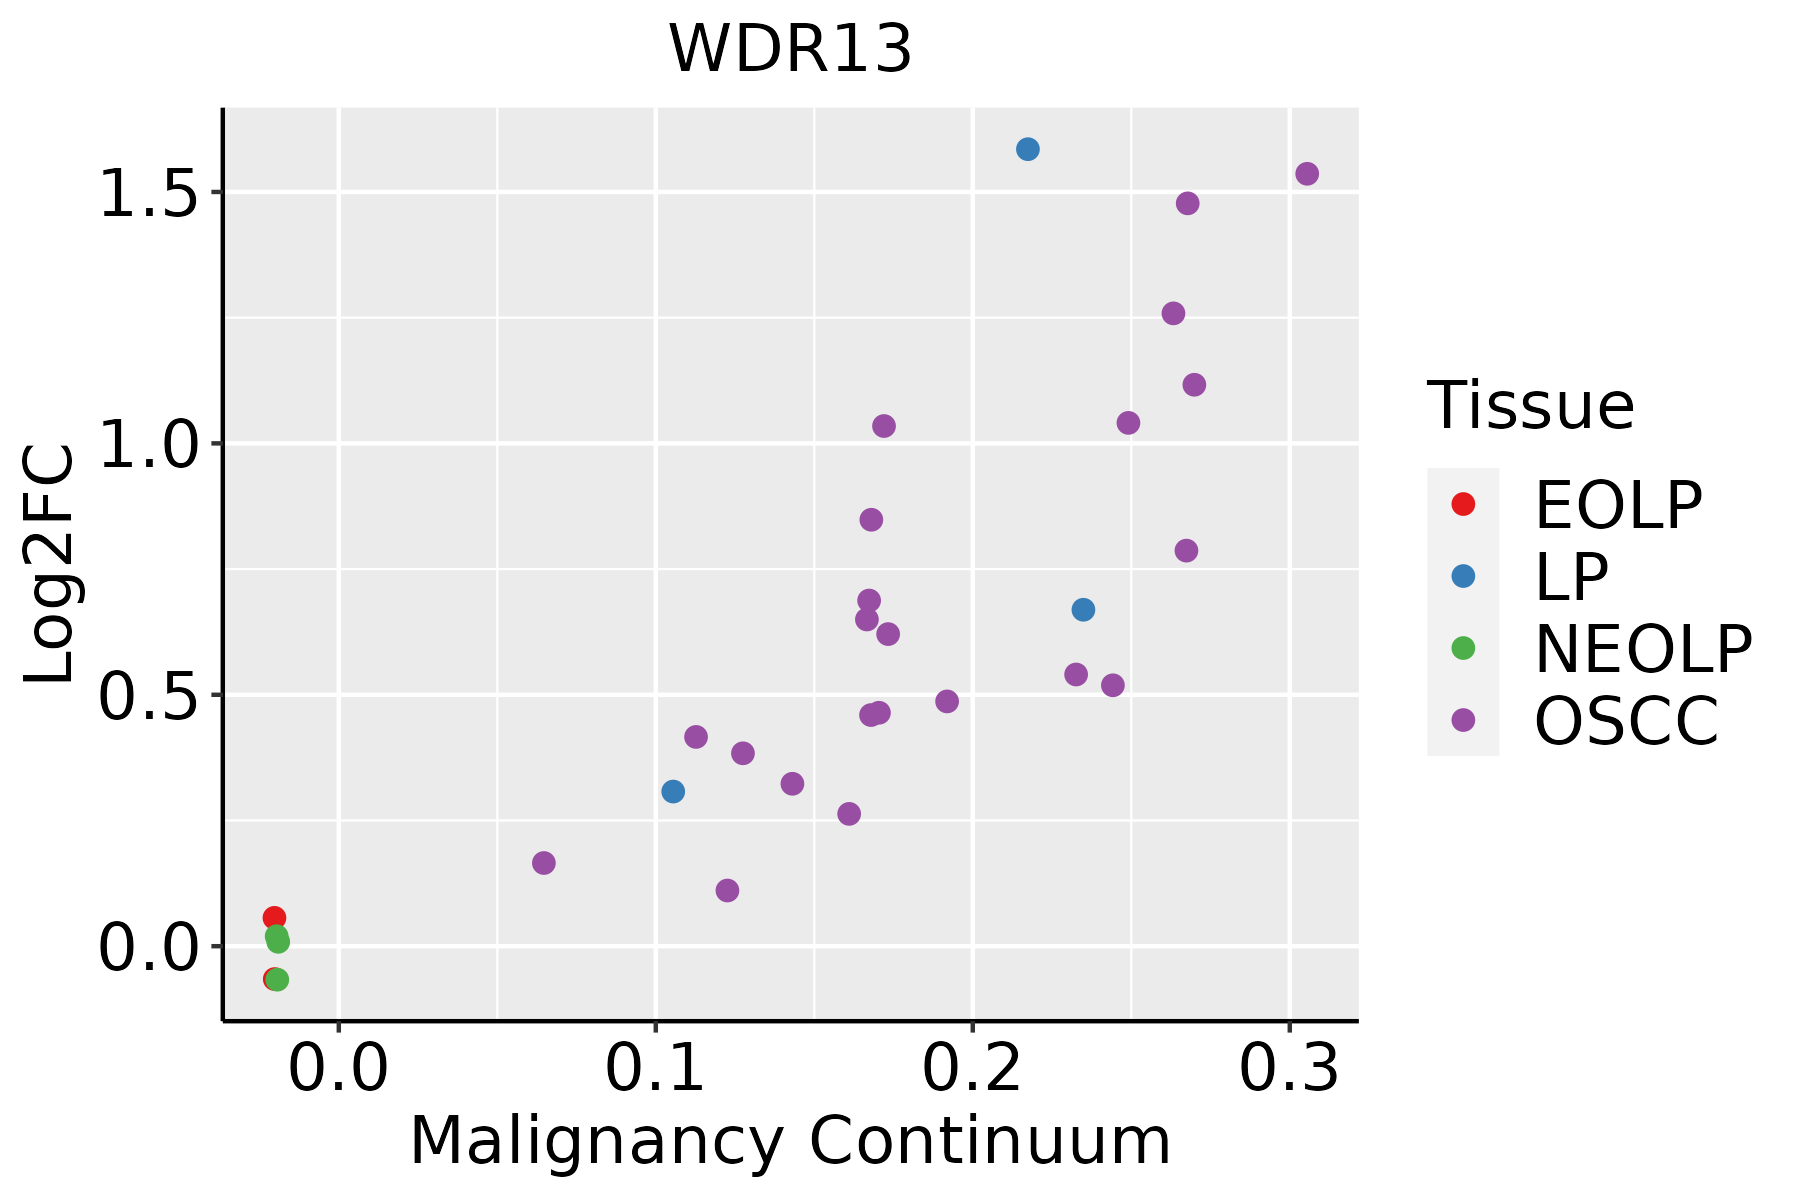 | EOLP: Erosive Oral lichen planus |
| LP: leukoplakia | ||
| NEOLP: Non-erosive oral lichen planus | ||
| OSCC: Oral squamous cell carcinoma | ||
| Skin |  | AK: Actinic keratosis |
| cSCC: Cutaneous squamous cell carcinoma | ||
| SCCIS:squamous cell carcinoma in situ | ||
| Thyroid |  | ATC: Anaplastic thyroid cancer |
| HT: Hashimoto's thyroiditis | ||
| PTC: Papillary thyroid cancer |
| ∗log2FC in expression of this searched gene in stem-like cells from each diseased tissue sample relative to stem-like cells in normal samples in each tissue plotted against the malignancy continuum. Samples are colored based on if they are from different disease stage. |
Top |
Malignant transformation related pathway analysis |
| Find out the enriched GO biological processes and KEGG pathways involved in transition from healthy to precancer to cancer |
| Tissue | Disease Stage | Enriched GO biological Processes |
| Colorectum | AD |  |
| Colorectum | SER |  |
| Colorectum | MSS |  |
| Colorectum | MSI-H |  |
| Colorectum | FAP |  |
| ∗Top 15 enriched GO BP terms are showed in the bar plot of each disease state in each tissue. Each row represents a significant GO biological process which is colored according to the -log10(p.adjust). |
| Page: 1 2 3 4 5 6 7 8 9 |
| GO ID | Tissue | Disease Stage | Description | Gene Ratio | Bg Ratio | pvalue | p.adjust | Count |
| GO:005067318 | Esophagus | ESCC | epithelial cell proliferation | 238/8552 | 437/18723 | 1.19e-04 | 8.20e-04 | 238 |
| GO:005067817 | Esophagus | ESCC | regulation of epithelial cell proliferation | 206/8552 | 381/18723 | 5.51e-04 | 3.02e-03 | 206 |
| GO:00443423 | Esophagus | ESCC | type B pancreatic cell proliferation | 15/8552 | 21/18723 | 1.54e-02 | 4.96e-02 | 15 |
| GO:005067310 | Oral cavity | OSCC | epithelial cell proliferation | 212/7305 | 437/18723 | 2.82e-05 | 2.61e-04 | 212 |
| GO:005067810 | Oral cavity | OSCC | regulation of epithelial cell proliferation | 180/7305 | 381/18723 | 5.88e-04 | 3.35e-03 | 180 |
| GO:005067324 | Skin | cSCC | epithelial cell proliferation | 144/4864 | 437/18723 | 6.07e-04 | 4.38e-03 | 144 |
| GO:004434211 | Skin | cSCC | type B pancreatic cell proliferation | 11/4864 | 21/18723 | 8.71e-03 | 4.01e-02 | 11 |
| GO:0050673111 | Thyroid | ATC | epithelial cell proliferation | 174/6293 | 437/18723 | 3.49e-03 | 1.55e-02 | 174 |
| GO:0050678110 | Thyroid | ATC | regulation of epithelial cell proliferation | 151/6293 | 381/18723 | 7.47e-03 | 2.92e-02 | 151 |
| Page: 1 |
| Pathway ID | Tissue | Disease Stage | Description | Gene Ratio | Bg Ratio | pvalue | p.adjust | qvalue | Count |
| Page: 1 |
Top |
Cell-cell communication analysis |
| Identification of potential cell-cell interactions between two cell types and their ligand-receptor pairs for different disease states |
| Ligand | Receptor | LRpair | Pathway | Tissue | Disease Stage |
| Page: 1 |
Top |
Single-cell gene regulatory network inference analysis |
| Find out the significant the regulons (TFs) and the target genes of each regulon across cell types for different disease states |
| TF | Cell Type | Tissue | Disease Stage | Target Gene | RSS | Regulon Activity |
| ∗The dot plots of a searched regulon are shown for all cell subpopulations in each disease state of each tissue based on the regulon specific score inferred using pySCENIC and by calculating the average expression. |
| Page: 1 |
Top |
Somatic mutation of malignant transformation related genes |
| Annotation of somatic variants for genes involved in malignant transformation |
| Hugo Symbol | Variant Class | Variant Classification | dbSNP RS | HGVSc | HGVSp | HGVSp Short | SWISSPROT | BIOTYPE | SIFT | PolyPhen | Tumor Sample Barcode | Tissue | Histology | Sex | Age | Stage | Therapy Types | Drugs | Outcome |
| WDR13 | SNV | Missense_Mutation | c.541N>A | p.Ala181Thr | p.A181T | Q9H1Z4 | protein_coding | deleterious(0) | probably_damaging(0.988) | TCGA-A2-A3Y0-01 | Breast | breast invasive carcinoma | Female | <65 | I/II | Chemotherapy | adriamycin | CR | |
| WDR13 | SNV | Missense_Mutation | novel | c.455C>T | p.Thr152Met | p.T152M | Q9H1Z4 | protein_coding | tolerated(0.09) | possibly_damaging(0.812) | TCGA-AR-A2LK-01 | Breast | breast invasive carcinoma | Female | <65 | III/IV | Hormone Therapy | anastrozole | PD |
| WDR13 | SNV | Missense_Mutation | c.718N>G | p.Thr240Ala | p.T240A | Q9H1Z4 | protein_coding | deleterious(0.05) | benign(0.03) | TCGA-E2-A15M-01 | Breast | breast invasive carcinoma | Female | >=65 | I/II | Hormone Therapy | arimidex | SD | |
| WDR13 | SNV | Missense_Mutation | novel | c.1166N>G | p.Asn389Ser | p.N389S | Q9H1Z4 | protein_coding | tolerated(0.53) | benign(0.358) | TCGA-E2-A570-01 | Breast | breast invasive carcinoma | Female | <65 | I/II | Hormone Therapy | anastrozole | SD |
| WDR13 | SNV | Missense_Mutation | c.962C>T | p.Ala321Val | p.A321V | Q9H1Z4 | protein_coding | tolerated(0.12) | possibly_damaging(0.532) | TCGA-E9-A1N9-01 | Breast | breast invasive carcinoma | Female | <65 | I/II | Chemotherapy | doxorubicin | SD | |
| WDR13 | deletion | Frame_Shift_Del | novel | c.319delN | p.His108ThrfsTer16 | p.H108Tfs*16 | Q9H1Z4 | protein_coding | TCGA-A7-A0D9-01 | Breast | breast invasive carcinoma | Female | <65 | I/II | Chemotherapy | taxotere | SD | ||
| WDR13 | SNV | Missense_Mutation | rs782786399 | c.631C>T | p.Arg211Cys | p.R211C | Q9H1Z4 | protein_coding | tolerated(0.33) | benign(0) | TCGA-MY-A5BE-01 | Cervix | cervical & endocervical cancer | Female | <65 | I/II | Unknown | Unknown | SD |
| WDR13 | SNV | Missense_Mutation | novel | c.97N>T | p.Arg33Trp | p.R33W | Q9H1Z4 | protein_coding | deleterious(0) | probably_damaging(0.994) | TCGA-AA-3549-01 | Colorectum | colon adenocarcinoma | Male | >=65 | I/II | Unknown | Unknown | SD |
| WDR13 | SNV | Missense_Mutation | novel | c.247N>A | p.Val83Ile | p.V83I | Q9H1Z4 | protein_coding | tolerated(0.43) | benign(0.005) | TCGA-AA-3854-01 | Colorectum | colon adenocarcinoma | Female | >=65 | I/II | Unknown | Unknown | SD |
| WDR13 | SNV | Missense_Mutation | rs782245413 | c.535N>T | p.Arg179Cys | p.R179C | Q9H1Z4 | protein_coding | deleterious(0) | possibly_damaging(0.498) | TCGA-AA-3949-01 | Colorectum | colon adenocarcinoma | Female | >=65 | III/IV | Unknown | Unknown | SD |
| Page: 1 2 3 4 5 6 7 8 |
Top |
Related drugs of malignant transformation related genes |
| Identification of chemicals and drugs interact with genes involved in malignant transfromation |
| (DGIdb 4.0) |
| Entrez ID | Symbol | Category | Interaction Types | Drug Claim Name | Drug Name | PMIDs |
| Page: 1 |

Copyright 2023-Present -The University of Texas Health Science Center at Houston |