
|
|||||
|
 | |
| |
| |
| |
| |
| |
|
Gene: WDR11 |
Gene summary for WDR11 |
| Gene information | Species | Human | Gene symbol | WDR11 | Gene ID | 55717 |
| Gene name | WD repeat domain 11 | |
| Gene Alias | BRWD2 | |
| Cytomap | 10q26.12 | |
| Gene Type | protein-coding | GO ID | GO:0006810 | UniProtAcc | Q9BZH6 |
Top |
Malignant transformation analysis |
| Identification of the aberrant gene expression in precancerous and cancerous lesions by comparing the gene expression of stem-like cells in diseased tissues with normal stem cells |
| Entrez ID | Symbol | Replicates | Species | Organ | Tissue | Adj P-value | Log2FC | Malignancy |
| 55717 | WDR11 | LZE4T | Human | Esophagus | ESCC | 3.67e-03 | 1.20e-01 | 0.0811 |
| 55717 | WDR11 | LZE7T | Human | Esophagus | ESCC | 3.98e-03 | 1.69e-01 | 0.0667 |
| 55717 | WDR11 | LZE20T | Human | Esophagus | ESCC | 9.20e-03 | 1.24e-01 | 0.0662 |
| 55717 | WDR11 | LZE24T | Human | Esophagus | ESCC | 3.96e-07 | 2.68e-01 | 0.0596 |
| 55717 | WDR11 | P1T-E | Human | Esophagus | ESCC | 2.47e-05 | 2.51e-01 | 0.0875 |
| 55717 | WDR11 | P2T-E | Human | Esophagus | ESCC | 1.34e-25 | 3.33e-01 | 0.1177 |
| 55717 | WDR11 | P4T-E | Human | Esophagus | ESCC | 1.43e-11 | 2.42e-01 | 0.1323 |
| 55717 | WDR11 | P5T-E | Human | Esophagus | ESCC | 2.99e-12 | 2.05e-01 | 0.1327 |
| 55717 | WDR11 | P8T-E | Human | Esophagus | ESCC | 1.11e-18 | 3.09e-01 | 0.0889 |
| 55717 | WDR11 | P9T-E | Human | Esophagus | ESCC | 4.29e-05 | 1.27e-01 | 0.1131 |
| 55717 | WDR11 | P10T-E | Human | Esophagus | ESCC | 3.32e-10 | 1.27e-01 | 0.116 |
| 55717 | WDR11 | P11T-E | Human | Esophagus | ESCC | 1.97e-05 | 3.40e-01 | 0.1426 |
| 55717 | WDR11 | P12T-E | Human | Esophagus | ESCC | 6.41e-23 | 3.84e-01 | 0.1122 |
| 55717 | WDR11 | P15T-E | Human | Esophagus | ESCC | 9.27e-12 | 2.94e-01 | 0.1149 |
| 55717 | WDR11 | P16T-E | Human | Esophagus | ESCC | 1.09e-21 | 2.24e-01 | 0.1153 |
| 55717 | WDR11 | P17T-E | Human | Esophagus | ESCC | 1.84e-04 | 1.76e-01 | 0.1278 |
| 55717 | WDR11 | P19T-E | Human | Esophagus | ESCC | 2.62e-02 | 1.88e-01 | 0.1662 |
| 55717 | WDR11 | P20T-E | Human | Esophagus | ESCC | 1.56e-05 | 1.52e-01 | 0.1124 |
| 55717 | WDR11 | P21T-E | Human | Esophagus | ESCC | 4.15e-19 | 2.66e-01 | 0.1617 |
| 55717 | WDR11 | P22T-E | Human | Esophagus | ESCC | 1.10e-13 | 1.15e-01 | 0.1236 |
| Page: 1 2 3 4 5 |
| Tissue | Expression Dynamics | Abbreviation |
| Esophagus |  | ESCC: Esophageal squamous cell carcinoma |
| HGIN: High-grade intraepithelial neoplasias | ||
| LGIN: Low-grade intraepithelial neoplasias | ||
| Oral Cavity | 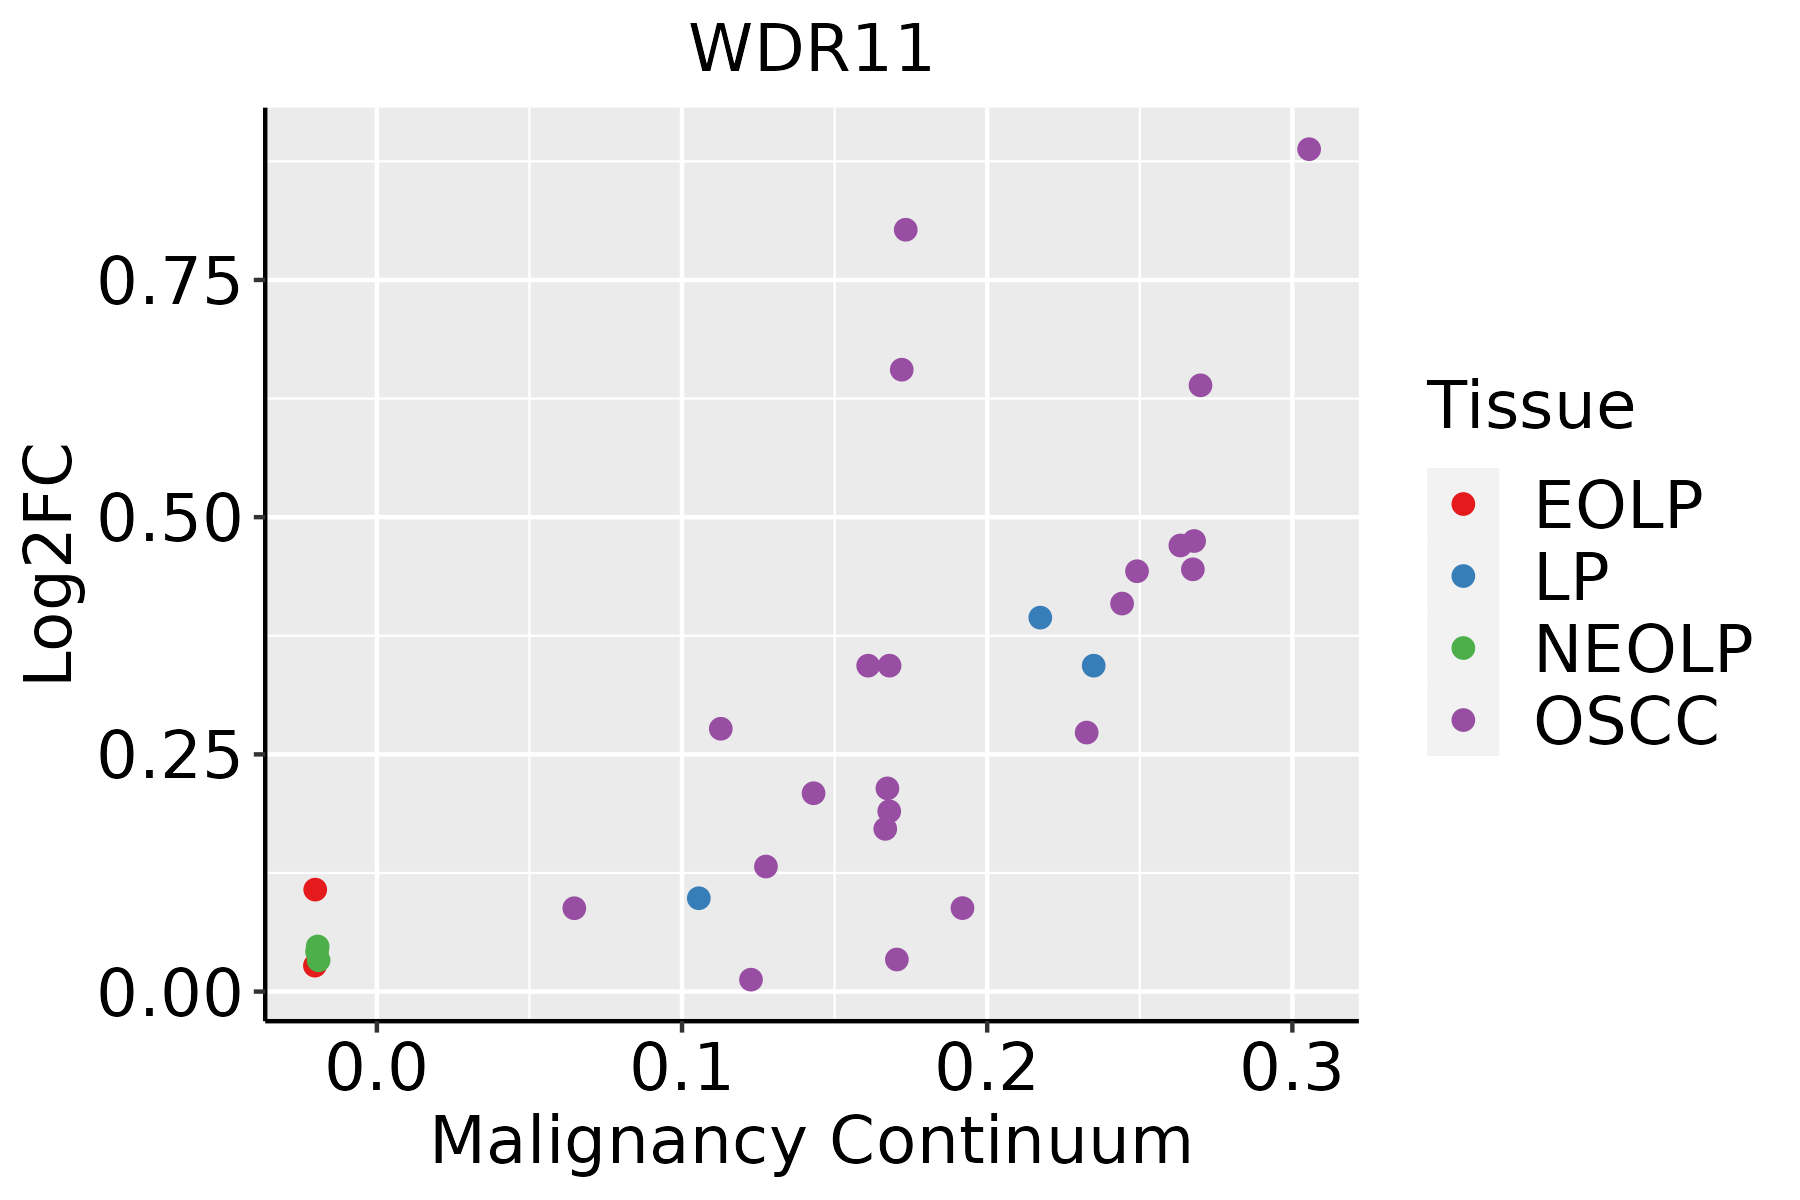 | EOLP: Erosive Oral lichen planus |
| LP: leukoplakia | ||
| NEOLP: Non-erosive oral lichen planus | ||
| OSCC: Oral squamous cell carcinoma | ||
| Skin | 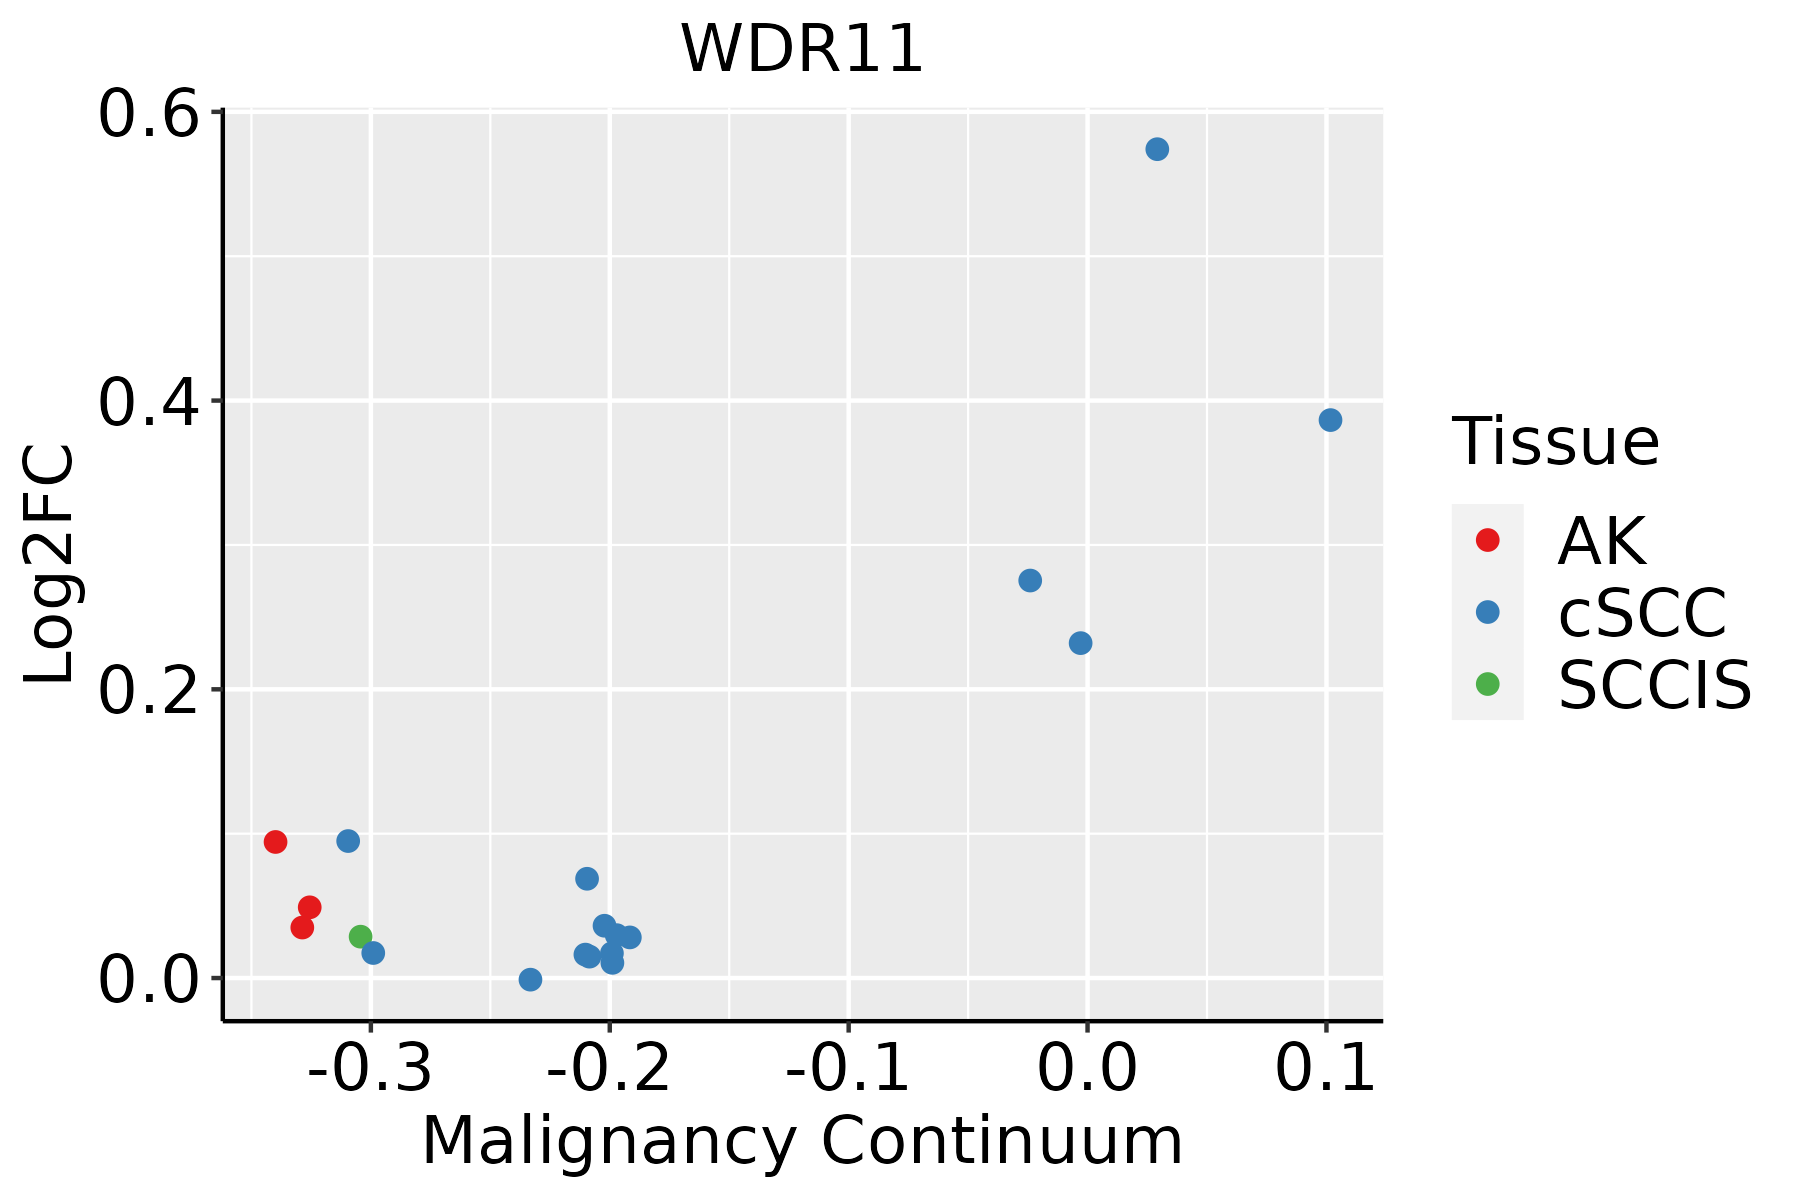 | AK: Actinic keratosis |
| cSCC: Cutaneous squamous cell carcinoma | ||
| SCCIS:squamous cell carcinoma in situ | ||
| Thyroid |  | ATC: Anaplastic thyroid cancer |
| HT: Hashimoto's thyroiditis | ||
| PTC: Papillary thyroid cancer |
| ∗log2FC in expression of this searched gene in stem-like cells from each diseased tissue sample relative to stem-like cells in normal samples in each tissue plotted against the malignancy continuum. Samples are colored based on if they are from different disease stage. |
Top |
Malignant transformation related pathway analysis |
| Find out the enriched GO biological processes and KEGG pathways involved in transition from healthy to precancer to cancer |
| Tissue | Disease Stage | Enriched GO biological Processes |
| Colorectum | AD |  |
| Colorectum | SER |  |
| Colorectum | MSS |  |
| Colorectum | MSI-H |  |
| Colorectum | FAP |  |
| ∗Top 15 enriched GO BP terms are showed in the bar plot of each disease state in each tissue. Each row represents a significant GO biological process which is colored according to the -log10(p.adjust). |
| Page: 1 2 3 4 5 6 7 8 9 |
| GO ID | Tissue | Disease Stage | Description | Gene Ratio | Bg Ratio | pvalue | p.adjust | Count |
| GO:005165617 | Esophagus | ESCC | establishment of organelle localization | 273/8552 | 390/18723 | 9.13e-23 | 1.81e-20 | 273 |
| GO:005165016 | Esophagus | ESCC | establishment of vesicle localization | 114/8552 | 161/18723 | 8.20e-11 | 2.53e-09 | 114 |
| GO:005164815 | Esophagus | ESCC | vesicle localization | 119/8552 | 177/18723 | 5.16e-09 | 1.08e-07 | 119 |
| GO:00069038 | Esophagus | ESCC | vesicle targeting | 38/8552 | 45/18723 | 8.42e-08 | 1.43e-06 | 38 |
| GO:00352647 | Esophagus | ESCC | multicellular organism growth | 80/8552 | 132/18723 | 3.84e-04 | 2.22e-03 | 80 |
| GO:00990222 | Esophagus | ESCC | vesicle tethering | 10/8552 | 11/18723 | 2.54e-03 | 1.08e-02 | 10 |
| GO:005165610 | Oral cavity | OSCC | establishment of organelle localization | 239/7305 | 390/18723 | 2.46e-19 | 3.31e-17 | 239 |
| GO:00069037 | Oral cavity | OSCC | vesicle targeting | 38/7305 | 45/18723 | 4.49e-10 | 1.19e-08 | 38 |
| GO:00516509 | Oral cavity | OSCC | establishment of vesicle localization | 101/7305 | 161/18723 | 8.79e-10 | 2.17e-08 | 101 |
| GO:00516489 | Oral cavity | OSCC | vesicle localization | 105/7305 | 177/18723 | 3.30e-08 | 6.30e-07 | 105 |
| GO:0099022 | Oral cavity | OSCC | vesicle tethering | 10/7305 | 11/18723 | 5.78e-04 | 3.30e-03 | 10 |
| GO:00352646 | Oral cavity | OSCC | multicellular organism growth | 65/7305 | 132/18723 | 1.06e-02 | 3.60e-02 | 65 |
| GO:005165624 | Skin | cSCC | establishment of organelle localization | 178/4864 | 390/18723 | 2.18e-17 | 2.32e-15 | 178 |
| GO:00069039 | Skin | cSCC | vesicle targeting | 28/4864 | 45/18723 | 3.26e-07 | 6.57e-06 | 28 |
| GO:005165018 | Skin | cSCC | establishment of vesicle localization | 70/4864 | 161/18723 | 1.02e-06 | 1.82e-05 | 70 |
| GO:005164816 | Skin | cSCC | vesicle localization | 73/4864 | 177/18723 | 6.36e-06 | 8.92e-05 | 73 |
| GO:00990223 | Skin | cSCC | vesicle tethering | 8/4864 | 11/18723 | 1.56e-03 | 9.60e-03 | 8 |
| GO:005165620 | Thyroid | PTC | establishment of organelle localization | 193/5968 | 390/18723 | 2.21e-13 | 1.15e-11 | 193 |
| GO:005165019 | Thyroid | PTC | establishment of vesicle localization | 89/5968 | 161/18723 | 6.38e-10 | 1.97e-08 | 89 |
| GO:005164817 | Thyroid | PTC | vesicle localization | 94/5968 | 177/18723 | 3.54e-09 | 9.45e-08 | 94 |
| Page: 1 2 |
| Pathway ID | Tissue | Disease Stage | Description | Gene Ratio | Bg Ratio | pvalue | p.adjust | qvalue | Count |
| Page: 1 |
Top |
Cell-cell communication analysis |
| Identification of potential cell-cell interactions between two cell types and their ligand-receptor pairs for different disease states |
| Ligand | Receptor | LRpair | Pathway | Tissue | Disease Stage |
| Page: 1 |
Top |
Single-cell gene regulatory network inference analysis |
| Find out the significant the regulons (TFs) and the target genes of each regulon across cell types for different disease states |
| TF | Cell Type | Tissue | Disease Stage | Target Gene | RSS | Regulon Activity |
| ∗The dot plots of a searched regulon are shown for all cell subpopulations in each disease state of each tissue based on the regulon specific score inferred using pySCENIC and by calculating the average expression. |
| Page: 1 |
Top |
Somatic mutation of malignant transformation related genes |
| Annotation of somatic variants for genes involved in malignant transformation |
| Hugo Symbol | Variant Class | Variant Classification | dbSNP RS | HGVSc | HGVSp | HGVSp Short | SWISSPROT | BIOTYPE | SIFT | PolyPhen | Tumor Sample Barcode | Tissue | Histology | Sex | Age | Stage | Therapy Types | Drugs | Outcome |
| WDR11 | SNV | Missense_Mutation | c.2252G>C | p.Trp751Ser | p.W751S | Q9BZH6 | protein_coding | tolerated(0.16) | benign(0.054) | TCGA-A8-A092-01 | Breast | breast invasive carcinoma | Female | <65 | III/IV | Chemotherapy | paclitaxel | CR | |
| WDR11 | SNV | Missense_Mutation | c.820G>C | p.Glu274Gln | p.E274Q | Q9BZH6 | protein_coding | deleterious(0.04) | probably_damaging(0.986) | TCGA-AC-A23H-01 | Breast | breast invasive carcinoma | Female | >=65 | I/II | Unknown | Unknown | PD | |
| WDR11 | SNV | Missense_Mutation | novel | c.2273N>T | p.Ala758Val | p.A758V | Q9BZH6 | protein_coding | deleterious(0) | probably_damaging(0.985) | TCGA-AN-A046-01 | Breast | breast invasive carcinoma | Female | >=65 | I/II | Unknown | Unknown | SD |
| WDR11 | SNV | Missense_Mutation | rs771463947 | c.686N>G | p.Lys229Arg | p.K229R | Q9BZH6 | protein_coding | tolerated(0.48) | benign(0.129) | TCGA-E2-A1IN-01 | Breast | breast invasive carcinoma | Female | <65 | I/II | Hormone Therapy | arimidex | SD |
| WDR11 | SNV | Missense_Mutation | c.1837N>G | p.Ile613Val | p.I613V | Q9BZH6 | protein_coding | tolerated(1) | benign(0) | TCGA-EW-A1IZ-01 | Breast | breast invasive carcinoma | Female | <65 | III/IV | Chemotherapy | taxotere | SD | |
| WDR11 | insertion | Frame_Shift_Ins | novel | c.3504_3505insTTAATATTATGTTTCAA | p.Thr1169LeufsTer25 | p.T1169Lfs*25 | Q9BZH6 | protein_coding | TCGA-B6-A0IA-01 | Breast | breast invasive carcinoma | Female | <65 | I/II | Unknown | Unknown | SD | ||
| WDR11 | SNV | Missense_Mutation | novel | c.844A>G | p.Ile282Val | p.I282V | Q9BZH6 | protein_coding | tolerated(0.27) | benign(0.001) | TCGA-2W-A8YY-01 | Cervix | cervical & endocervical cancer | Female | <65 | I/II | Chemotherapy | cisplatin | CR |
| WDR11 | SNV | Missense_Mutation | novel | c.1906N>C | p.Glu636Gln | p.E636Q | Q9BZH6 | protein_coding | tolerated(0.06) | probably_damaging(0.979) | TCGA-HM-A4S6-01 | Cervix | cervical & endocervical cancer | Female | <65 | III/IV | Chemotherapy | cisplatin | CR |
| WDR11 | SNV | Missense_Mutation | rs771733026 | c.3125C>T | p.Ser1042Leu | p.S1042L | Q9BZH6 | protein_coding | tolerated(0.08) | benign(0) | TCGA-UC-A7PF-01 | Cervix | cervical & endocervical cancer | Female | <65 | I/II | Unknown | Unknown | SD |
| WDR11 | SNV | Missense_Mutation | c.2422N>G | p.Lys808Glu | p.K808E | Q9BZH6 | protein_coding | tolerated(0.05) | probably_damaging(0.98) | TCGA-AA-3492-01 | Colorectum | colon adenocarcinoma | Female | >=65 | I/II | Unknown | Unknown | SD |
| Page: 1 2 3 4 5 6 7 8 9 |
Top |
Related drugs of malignant transformation related genes |
| Identification of chemicals and drugs interact with genes involved in malignant transfromation |
| (DGIdb 4.0) |
| Entrez ID | Symbol | Category | Interaction Types | Drug Claim Name | Drug Name | PMIDs |
| Page: 1 |

Copyright 2023-Present -The University of Texas Health Science Center at Houston |