
|
|||||
|
 | |
| |
| |
| |
| |
| |
|
Gene: WDPCP |
Gene summary for WDPCP |
| Gene information | Species | Human | Gene symbol | WDPCP | Gene ID | 51057 |
| Gene name | WD repeat containing planar cell polarity effector | |
| Gene Alias | BBS15 | |
| Cytomap | 2p15 | |
| Gene Type | protein-coding | GO ID | GO:0000902 | UniProtAcc | O95876 |
Top |
Malignant transformation analysis |
| Identification of the aberrant gene expression in precancerous and cancerous lesions by comparing the gene expression of stem-like cells in diseased tissues with normal stem cells |
| Entrez ID | Symbol | Replicates | Species | Organ | Tissue | Adj P-value | Log2FC | Malignancy |
| 51057 | WDPCP | CCI_1 | Human | Cervix | CC | 4.67e-14 | 1.17e+00 | 0.528 |
| 51057 | WDPCP | CCI_2 | Human | Cervix | CC | 1.24e-06 | 7.84e-01 | 0.5249 |
| 51057 | WDPCP | CCI_3 | Human | Cervix | CC | 5.04e-29 | 1.25e+00 | 0.516 |
| 51057 | WDPCP | AEH-subject1 | Human | Endometrium | AEH | 1.06e-06 | 2.98e-01 | -0.3059 |
| 51057 | WDPCP | AEH-subject2 | Human | Endometrium | AEH | 9.99e-05 | 2.74e-01 | -0.2525 |
| 51057 | WDPCP | AEH-subject3 | Human | Endometrium | AEH | 5.10e-03 | 2.31e-01 | -0.2576 |
| 51057 | WDPCP | AEH-subject4 | Human | Endometrium | AEH | 1.85e-16 | 5.26e-01 | -0.2657 |
| 51057 | WDPCP | AEH-subject5 | Human | Endometrium | AEH | 8.95e-10 | 4.00e-01 | -0.2953 |
| 51057 | WDPCP | EEC-subject1 | Human | Endometrium | EEC | 1.08e-04 | 3.05e-01 | -0.2682 |
| 51057 | WDPCP | EEC-subject2 | Human | Endometrium | EEC | 3.94e-06 | 3.24e-01 | -0.2607 |
| 51057 | WDPCP | EEC-subject4 | Human | Endometrium | EEC | 1.52e-09 | 4.36e-01 | -0.2571 |
| 51057 | WDPCP | EEC-subject5 | Human | Endometrium | EEC | 2.10e-05 | 3.11e-01 | -0.249 |
| 51057 | WDPCP | RNA-P17T-P17T-4 | Human | Lung | IAC | 3.57e-04 | 5.09e-01 | 0.343 |
| 51057 | WDPCP | RNA-P17T-P17T-6 | Human | Lung | IAC | 2.27e-02 | 6.00e-01 | 0.3385 |
| 51057 | WDPCP | RNA-P25T1-P25T1-1 | Human | Lung | AIS | 1.17e-07 | 3.96e-01 | -0.2116 |
| 51057 | WDPCP | RNA-P25T1-P25T1-2 | Human | Lung | AIS | 1.67e-04 | 6.00e-01 | -0.1941 |
| 51057 | WDPCP | RNA-P25T1-P25T1-4 | Human | Lung | AIS | 2.00e-03 | 3.93e-01 | -0.2119 |
| 51057 | WDPCP | RNA-P6T2-P6T2-1 | Human | Lung | IAC | 1.75e-07 | 3.59e-01 | -0.0166 |
| 51057 | WDPCP | RNA-P6T2-P6T2-2 | Human | Lung | IAC | 5.03e-13 | 4.86e-01 | -0.0132 |
| 51057 | WDPCP | RNA-P6T2-P6T2-3 | Human | Lung | IAC | 6.01e-20 | 5.74e-01 | -0.013 |
| Page: 1 2 |
| Tissue | Expression Dynamics | Abbreviation |
| Cervix | 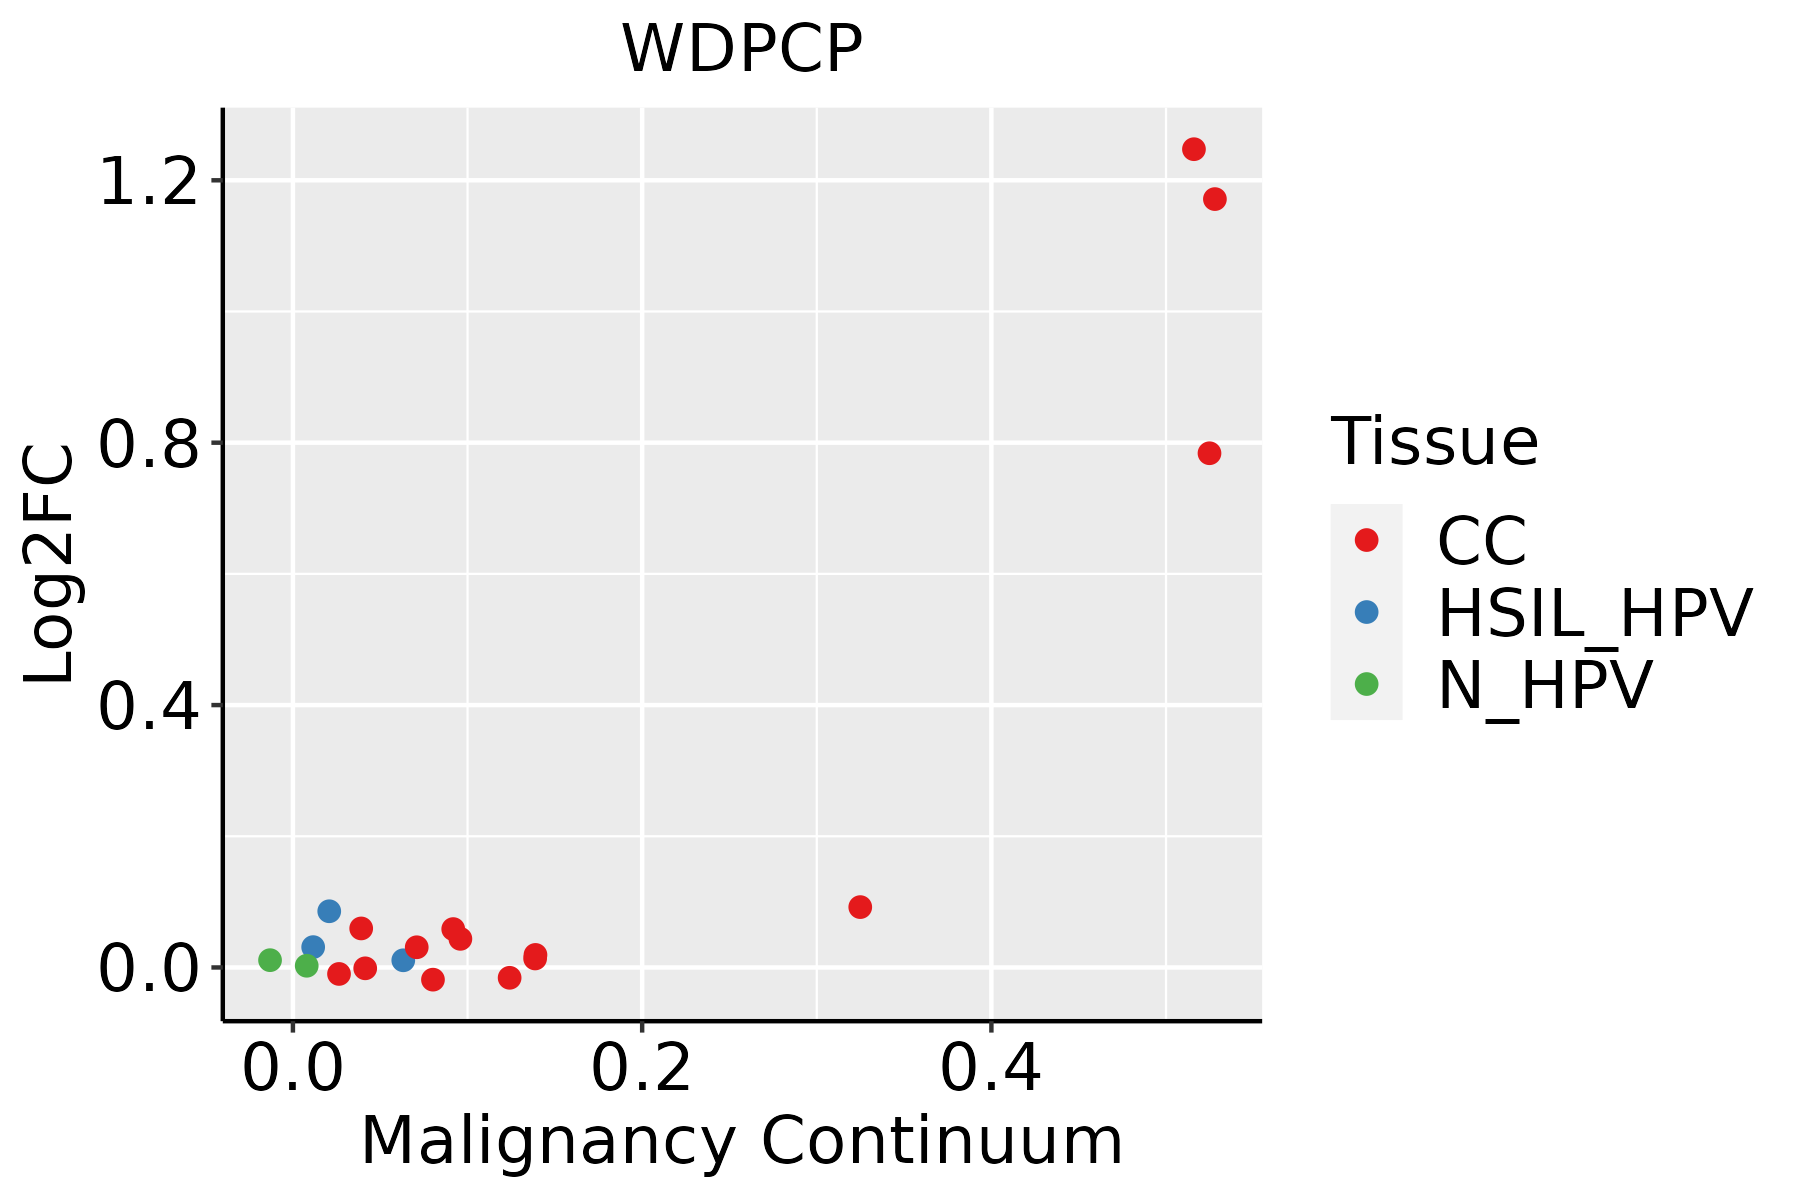 | CC: Cervix cancer |
| HSIL_HPV: HPV-infected high-grade squamous intraepithelial lesions | ||
| N_HPV: HPV-infected normal cervix | ||
| Endometrium |  | AEH: Atypical endometrial hyperplasia |
| EEC: Endometrioid Cancer | ||
| Lung |  | AAH: Atypical adenomatous hyperplasia |
| AIS: Adenocarcinoma in situ | ||
| IAC: Invasive lung adenocarcinoma | ||
| MIA: Minimally invasive adenocarcinoma | ||
| Skin | 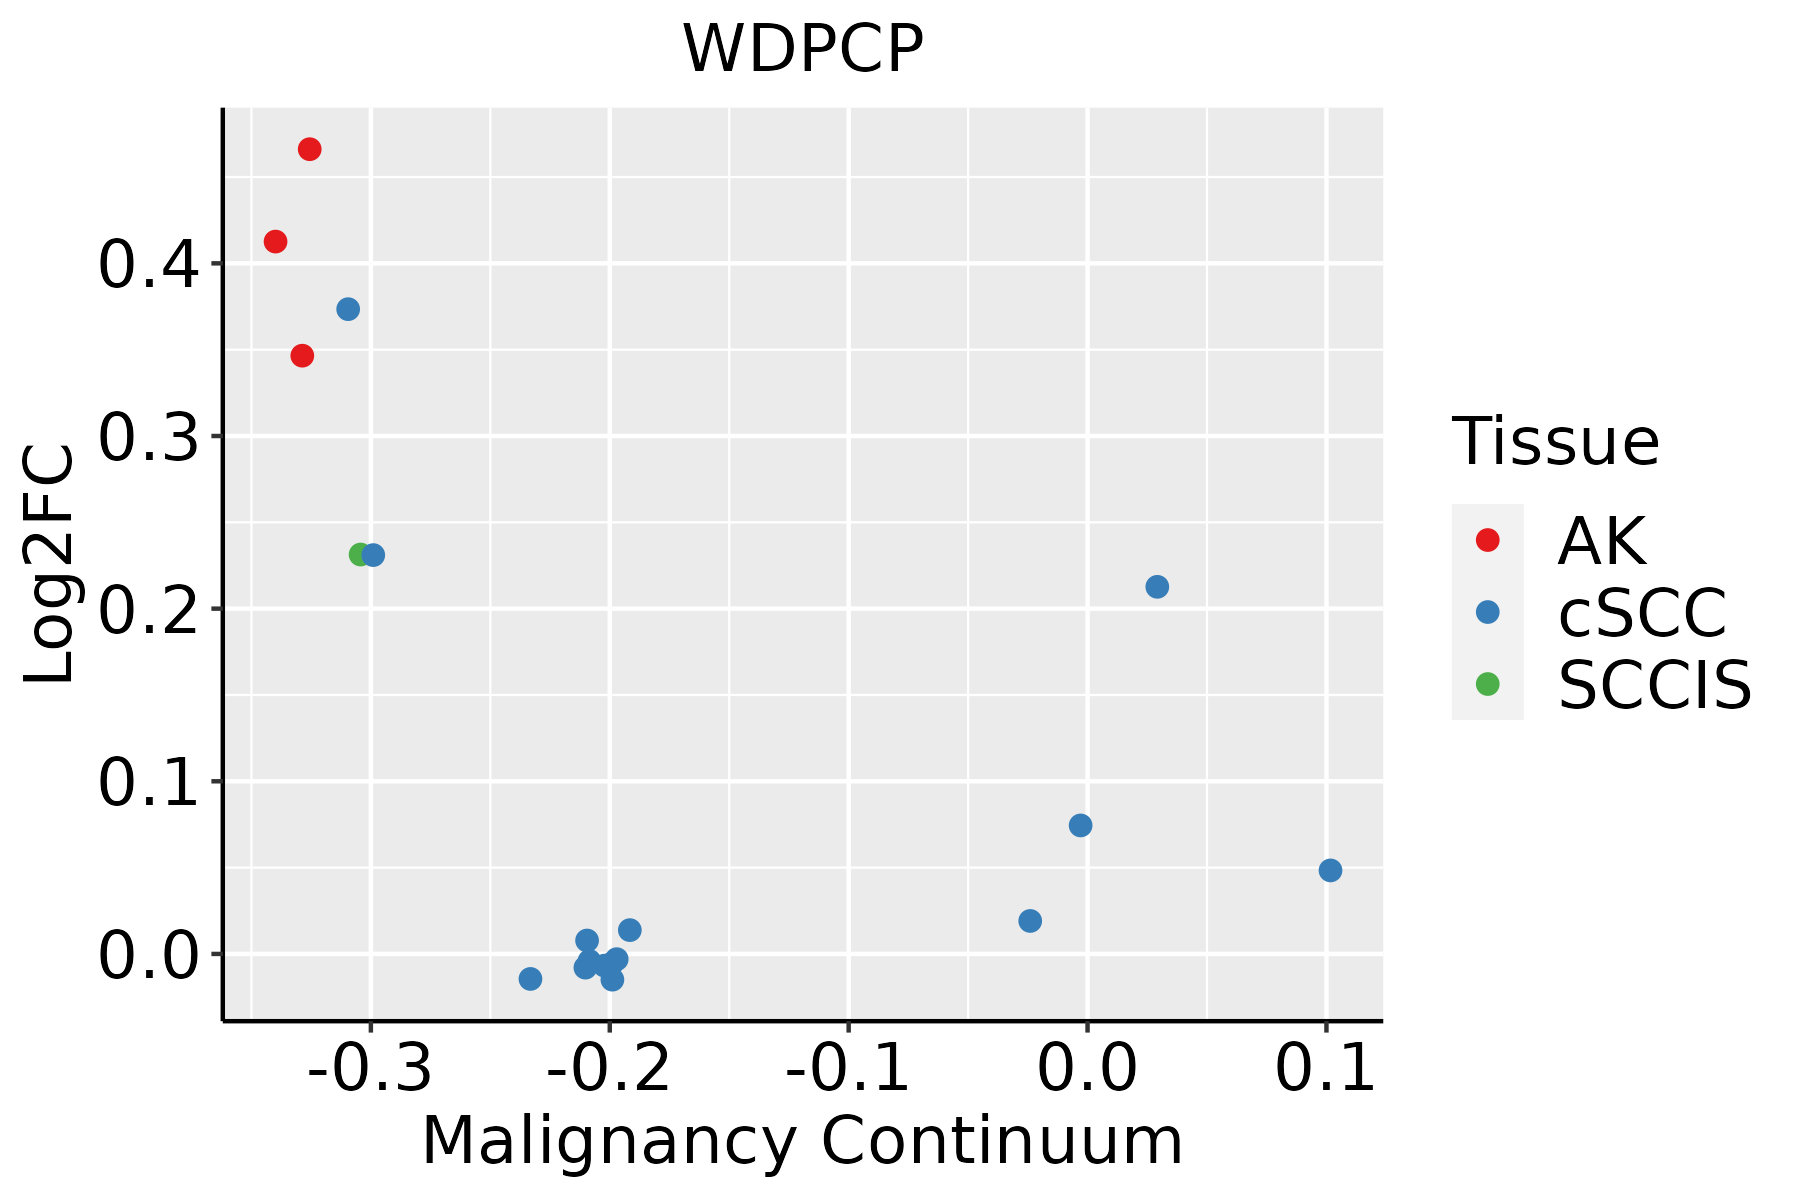 | AK: Actinic keratosis |
| cSCC: Cutaneous squamous cell carcinoma | ||
| SCCIS:squamous cell carcinoma in situ |
| ∗log2FC in expression of this searched gene in stem-like cells from each diseased tissue sample relative to stem-like cells in normal samples in each tissue plotted against the malignancy continuum. Samples are colored based on if they are from different disease stage. |
Top |
Malignant transformation related pathway analysis |
| Find out the enriched GO biological processes and KEGG pathways involved in transition from healthy to precancer to cancer |
| Tissue | Disease Stage | Enriched GO biological Processes |
| Colorectum | AD |  |
| Colorectum | SER |  |
| Colorectum | MSS |  |
| Colorectum | MSI-H |  |
| Colorectum | FAP |  |
| ∗Top 15 enriched GO BP terms are showed in the bar plot of each disease state in each tissue. Each row represents a significant GO biological process which is colored according to the -log10(p.adjust). |
| Page: 1 2 3 4 5 6 7 8 9 |
| GO ID | Tissue | Disease Stage | Description | Gene Ratio | Bg Ratio | pvalue | p.adjust | Count |
| GO:001081010 | Cervix | CC | regulation of cell-substrate adhesion | 69/2311 | 221/18723 | 8.57e-14 | 5.69e-11 | 69 |
| GO:00315898 | Cervix | CC | cell-substrate adhesion | 96/2311 | 363/18723 | 1.48e-13 | 8.85e-11 | 96 |
| GO:002260410 | Cervix | CC | regulation of cell morphogenesis | 84/2311 | 309/18723 | 1.00e-12 | 4.29e-10 | 84 |
| GO:009013210 | Cervix | CC | epithelium migration | 90/2311 | 360/18723 | 2.45e-11 | 6.11e-09 | 90 |
| GO:00016679 | Cervix | CC | ameboidal-type cell migration | 110/2311 | 475/18723 | 2.66e-11 | 6.36e-09 | 110 |
| GO:001063110 | Cervix | CC | epithelial cell migration | 89/2311 | 357/18723 | 3.72e-11 | 8.54e-09 | 89 |
| GO:00085446 | Cervix | CC | epidermis development | 83/2311 | 324/18723 | 3.91e-11 | 8.54e-09 | 83 |
| GO:00071639 | Cervix | CC | establishment or maintenance of cell polarity | 63/2311 | 218/18723 | 4.25e-11 | 8.76e-09 | 63 |
| GO:009013010 | Cervix | CC | tissue migration | 90/2311 | 365/18723 | 5.42e-11 | 1.05e-08 | 90 |
| GO:01501159 | Cervix | CC | cell-substrate junction organization | 37/2311 | 101/18723 | 3.20e-10 | 4.46e-08 | 37 |
| GO:00070448 | Cervix | CC | cell-substrate junction assembly | 34/2311 | 95/18723 | 3.35e-09 | 3.45e-07 | 34 |
| GO:00019528 | Cervix | CC | regulation of cell-matrix adhesion | 40/2311 | 128/18723 | 1.32e-08 | 1.04e-06 | 40 |
| GO:00071608 | Cervix | CC | cell-matrix adhesion | 60/2311 | 233/18723 | 1.58e-08 | 1.23e-06 | 60 |
| GO:00300108 | Cervix | CC | establishment of cell polarity | 42/2311 | 143/18723 | 4.30e-08 | 2.62e-06 | 42 |
| GO:00099137 | Cervix | CC | epidermal cell differentiation | 53/2311 | 202/18723 | 5.48e-08 | 3.25e-06 | 53 |
| GO:00343298 | Cervix | CC | cell junction assembly | 88/2311 | 420/18723 | 3.42e-07 | 1.38e-05 | 88 |
| GO:01501169 | Cervix | CC | regulation of cell-substrate junction organization | 25/2311 | 71/18723 | 5.58e-07 | 2.06e-05 | 25 |
| GO:00480417 | Cervix | CC | focal adhesion assembly | 28/2311 | 87/18723 | 9.86e-07 | 3.45e-05 | 28 |
| GO:00518938 | Cervix | CC | regulation of focal adhesion assembly | 22/2311 | 66/18723 | 7.37e-06 | 1.73e-04 | 22 |
| GO:00901098 | Cervix | CC | regulation of cell-substrate junction assembly | 22/2311 | 66/18723 | 7.37e-06 | 1.73e-04 | 22 |
| Page: 1 2 3 4 5 6 7 8 9 10 11 12 13 14 |
| Pathway ID | Tissue | Disease Stage | Description | Gene Ratio | Bg Ratio | pvalue | p.adjust | qvalue | Count |
| Page: 1 |
Top |
Cell-cell communication analysis |
| Identification of potential cell-cell interactions between two cell types and their ligand-receptor pairs for different disease states |
| Ligand | Receptor | LRpair | Pathway | Tissue | Disease Stage |
| Page: 1 |
Top |
Single-cell gene regulatory network inference analysis |
| Find out the significant the regulons (TFs) and the target genes of each regulon across cell types for different disease states |
| TF | Cell Type | Tissue | Disease Stage | Target Gene | RSS | Regulon Activity |
| ∗The dot plots of a searched regulon are shown for all cell subpopulations in each disease state of each tissue based on the regulon specific score inferred using pySCENIC and by calculating the average expression. |
| Page: 1 |
Top |
Somatic mutation of malignant transformation related genes |
| Annotation of somatic variants for genes involved in malignant transformation |
| Hugo Symbol | Variant Class | Variant Classification | dbSNP RS | HGVSc | HGVSp | HGVSp Short | SWISSPROT | BIOTYPE | SIFT | PolyPhen | Tumor Sample Barcode | Tissue | Histology | Sex | Age | Stage | Therapy Types | Drugs | Outcome |
| WDPCP | SNV | Missense_Mutation | novel | c.1882G>A | p.Asp628Asn | p.D628N | O95876 | protein_coding | deleterious(0.04) | benign(0.236) | TCGA-A2-A0CO-01 | Breast | breast invasive carcinoma | Female | >=65 | I/II | Hormone Therapy | tamoxiphen | CR |
| WDPCP | SNV | Missense_Mutation | c.2107N>C | p.Glu703Gln | p.E703Q | O95876 | protein_coding | tolerated(0.47) | probably_damaging(0.986) | TCGA-GM-A2DH-01 | Breast | breast invasive carcinoma | Female | <65 | I/II | Chemotherapy | taxol | CR | |
| WDPCP | insertion | In_Frame_Ins | novel | c.2102_2103insCAACATCCTGGCCAGGTGCAGTGGCTCACACCCAAGCAC | p.Glu701delinsAspAsnIleLeuAlaArgCysSerGlySerHisProSerThr | p.E701delinsDNILARCSGSHPST | O95876 | protein_coding | TCGA-A8-A092-01 | Breast | breast invasive carcinoma | Female | <65 | III/IV | Chemotherapy | paclitaxel | CR | ||
| WDPCP | SNV | Missense_Mutation | c.1918N>T | p.Leu640Phe | p.L640F | O95876 | protein_coding | tolerated_low_confidence(0.09) | benign(0.049) | TCGA-C5-A1BJ-01 | Cervix | cervical & endocervical cancer | Female | <65 | I/II | Unknown | Unknown | SD | |
| WDPCP | SNV | Missense_Mutation | novel | c.782N>C | p.Arg261Thr | p.R261T | O95876 | protein_coding | deleterious(0) | probably_damaging(0.939) | TCGA-C5-A2LZ-01 | Cervix | cervical & endocervical cancer | Female | >=65 | III/IV | Unknown | Unknown | PD |
| WDPCP | SNV | Missense_Mutation | novel | c.425C>T | p.Ser142Phe | p.S142F | O95876 | protein_coding | deleterious(0) | possibly_damaging(0.842) | TCGA-DS-A1OB-01 | Cervix | cervical & endocervical cancer | Female | <65 | I/II | Chemotherapy | carboplatin | PD |
| WDPCP | SNV | Missense_Mutation | c.1858N>A | p.Glu620Lys | p.E620K | O95876 | protein_coding | deleterious(0.04) | benign(0.021) | TCGA-EK-A2IP-01 | Cervix | cervical & endocervical cancer | Female | <65 | I/II | Unknown | Unknown | SD | |
| WDPCP | SNV | Missense_Mutation | rs749726622 | c.1259N>A | p.Arg420His | p.R420H | O95876 | protein_coding | tolerated(0.54) | possibly_damaging(0.525) | TCGA-VS-A94W-01 | Cervix | cervical & endocervical cancer | Female | <65 | I/II | Chemotherapy | cisplatin | CR |
| WDPCP | SNV | Missense_Mutation | novel | c.2191N>A | p.Glu731Lys | p.E731K | O95876 | protein_coding | tolerated(0.07) | benign(0.001) | TCGA-VS-A953-01 | Cervix | cervical & endocervical cancer | Female | <65 | I/II | Unknown | Unknown | PD |
| WDPCP | SNV | Missense_Mutation | novel | c.1933G>A | p.Asp645Asn | p.D645N | O95876 | protein_coding | tolerated(0.14) | benign(0.003) | TCGA-XS-A8TJ-01 | Cervix | cervical & endocervical cancer | Female | <65 | I/II | Chemotherapy | cisplatin | SD |
| Page: 1 2 3 4 5 6 7 8 9 10 |
Top |
Related drugs of malignant transformation related genes |
| Identification of chemicals and drugs interact with genes involved in malignant transfromation |
| (DGIdb 4.0) |
| Entrez ID | Symbol | Category | Interaction Types | Drug Claim Name | Drug Name | PMIDs |
| Page: 1 |

Copyright 2023-Present -The University of Texas Health Science Center at Houston |