
|
|||||
|
 | |
| |
| |
| |
| |
| |
|
Gene: WDFY3 |
Gene summary for WDFY3 |
| Gene information | Species | Human | Gene symbol | WDFY3 | Gene ID | 23001 |
| Gene name | WD repeat and FYVE domain containing 3 | |
| Gene Alias | ALFY | |
| Cytomap | 4q21.23 | |
| Gene Type | protein-coding | GO ID | GO:0006914 | UniProtAcc | A0A024RDI0 |
Top |
Malignant transformation analysis |
| Identification of the aberrant gene expression in precancerous and cancerous lesions by comparing the gene expression of stem-like cells in diseased tissues with normal stem cells |
| Entrez ID | Symbol | Replicates | Species | Organ | Tissue | Adj P-value | Log2FC | Malignancy |
| 23001 | WDFY3 | CCI_1 | Human | Cervix | CC | 3.74e-08 | 9.84e-01 | 0.528 |
| 23001 | WDFY3 | CCI_3 | Human | Cervix | CC | 3.42e-04 | 5.96e-01 | 0.516 |
| 23001 | WDFY3 | HTA11_3410_2000001011 | Human | Colorectum | AD | 2.55e-19 | -5.64e-01 | 0.0155 |
| 23001 | WDFY3 | HTA11_2487_2000001011 | Human | Colorectum | SER | 8.88e-07 | -4.74e-01 | -0.1808 |
| 23001 | WDFY3 | HTA11_2951_2000001011 | Human | Colorectum | AD | 2.29e-03 | -7.07e-01 | 0.0216 |
| 23001 | WDFY3 | HTA11_3361_2000001011 | Human | Colorectum | AD | 7.26e-10 | -6.14e-01 | -0.1207 |
| 23001 | WDFY3 | HTA11_696_2000001011 | Human | Colorectum | AD | 4.76e-09 | -4.20e-01 | -0.1464 |
| 23001 | WDFY3 | HTA11_866_2000001011 | Human | Colorectum | AD | 6.12e-03 | -3.43e-01 | -0.1001 |
| 23001 | WDFY3 | HTA11_5212_2000001011 | Human | Colorectum | AD | 2.28e-02 | -5.79e-01 | -0.2061 |
| 23001 | WDFY3 | HTA11_5216_2000001011 | Human | Colorectum | SER | 2.00e-05 | -8.04e-01 | -0.1462 |
| 23001 | WDFY3 | HTA11_546_2000001011 | Human | Colorectum | AD | 1.26e-03 | -4.50e-01 | -0.0842 |
| 23001 | WDFY3 | HTA11_866_3004761011 | Human | Colorectum | AD | 4.54e-14 | -5.19e-01 | 0.096 |
| 23001 | WDFY3 | HTA11_8622_2000001021 | Human | Colorectum | SER | 8.66e-03 | -5.51e-01 | 0.0528 |
| 23001 | WDFY3 | HTA11_10711_2000001011 | Human | Colorectum | AD | 1.54e-05 | -4.26e-01 | 0.0338 |
| 23001 | WDFY3 | HTA11_7696_3000711011 | Human | Colorectum | AD | 6.10e-11 | -4.90e-01 | 0.0674 |
| 23001 | WDFY3 | HTA11_6818_2000001021 | Human | Colorectum | AD | 2.96e-02 | -3.00e-01 | 0.0588 |
| 23001 | WDFY3 | HTA11_99999970781_79442 | Human | Colorectum | MSS | 4.89e-10 | -3.56e-01 | 0.294 |
| 23001 | WDFY3 | HTA11_99999973899_84307 | Human | Colorectum | MSS | 1.61e-05 | -5.56e-01 | 0.2585 |
| 23001 | WDFY3 | HTA11_99999974143_84620 | Human | Colorectum | MSS | 6.18e-16 | -5.68e-01 | 0.3005 |
| 23001 | WDFY3 | F007 | Human | Colorectum | FAP | 1.63e-02 | -2.13e-01 | 0.1176 |
| Page: 1 2 3 4 5 6 |
| Tissue | Expression Dynamics | Abbreviation |
| Cervix | 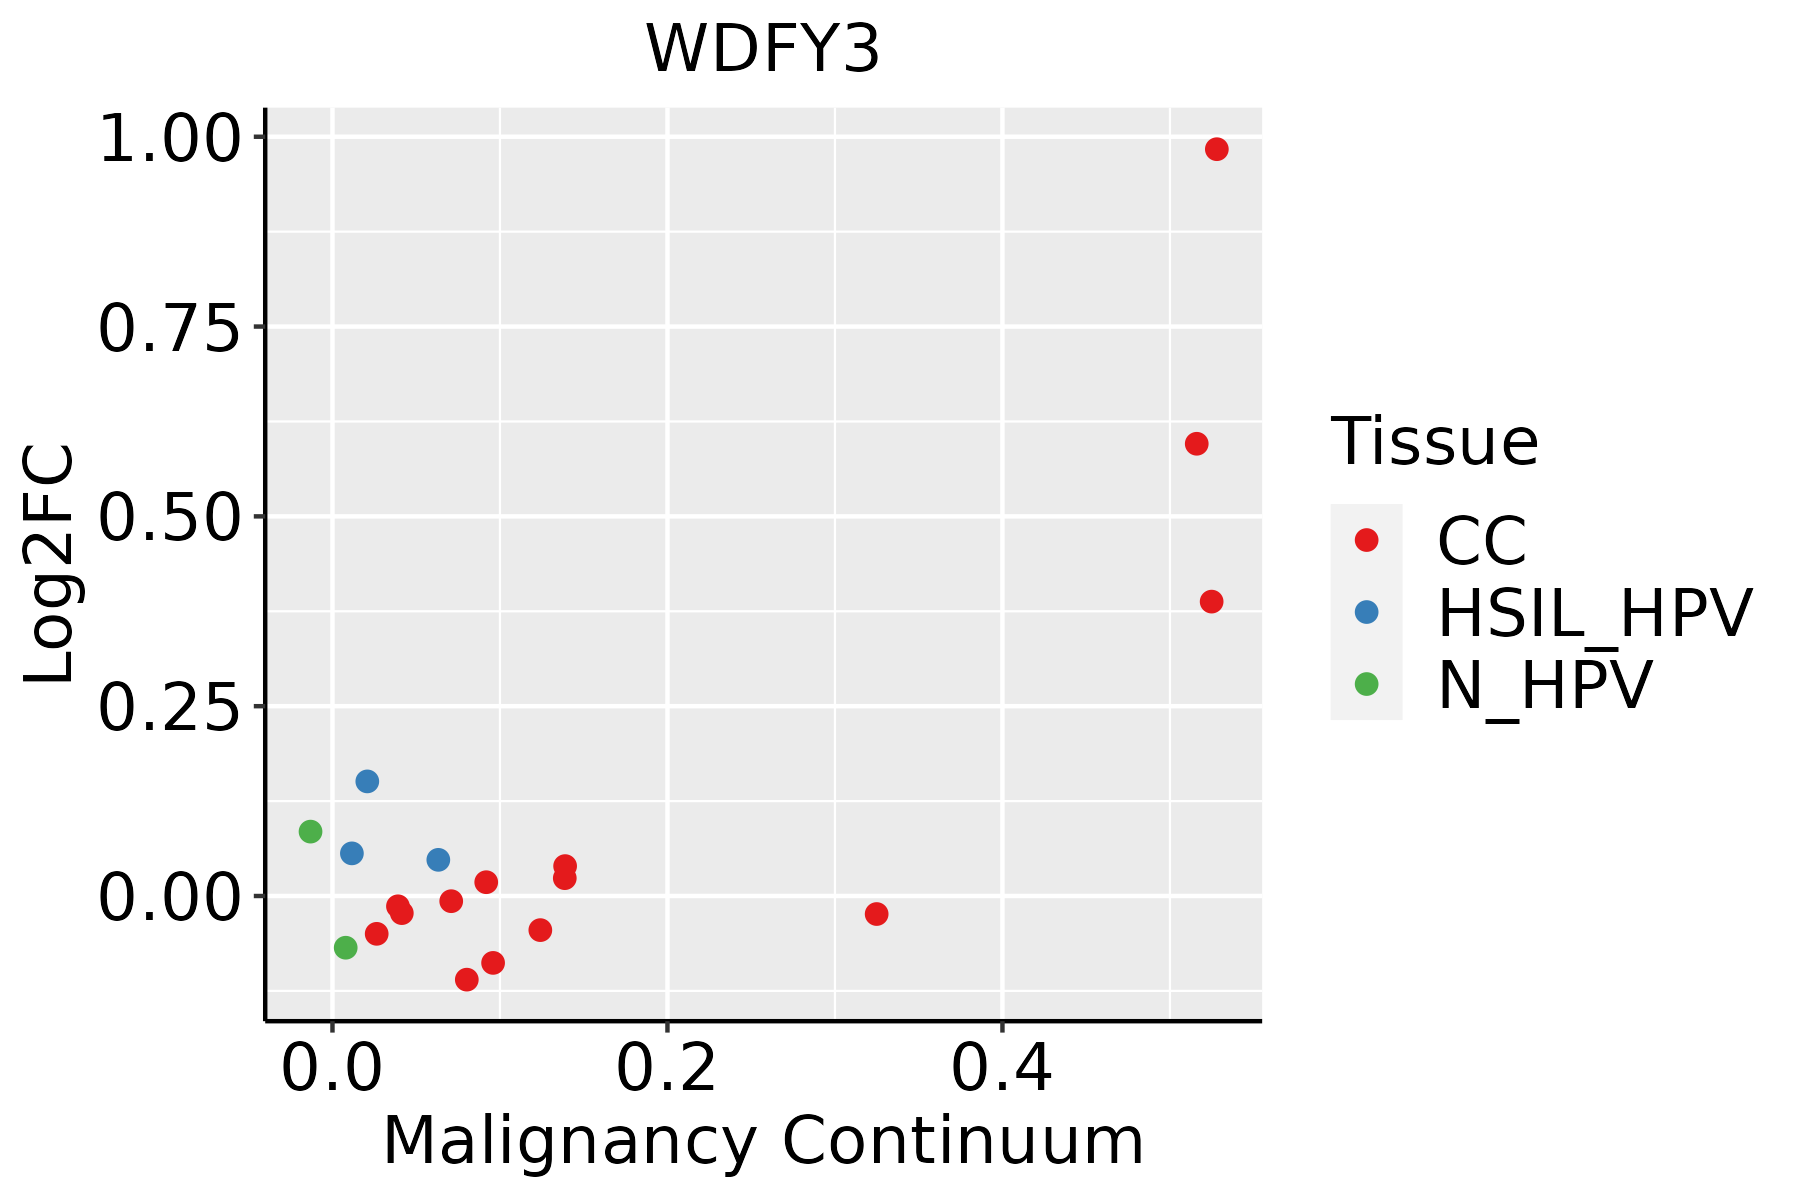 | CC: Cervix cancer |
| HSIL_HPV: HPV-infected high-grade squamous intraepithelial lesions | ||
| N_HPV: HPV-infected normal cervix | ||
| Colorectum (GSE201348) |  | FAP: Familial adenomatous polyposis |
| CRC: Colorectal cancer | ||
| Colorectum (HTA11) |  | AD: Adenomas |
| SER: Sessile serrated lesions | ||
| MSI-H: Microsatellite-high colorectal cancer | ||
| MSS: Microsatellite stable colorectal cancer | ||
| Endometrium | 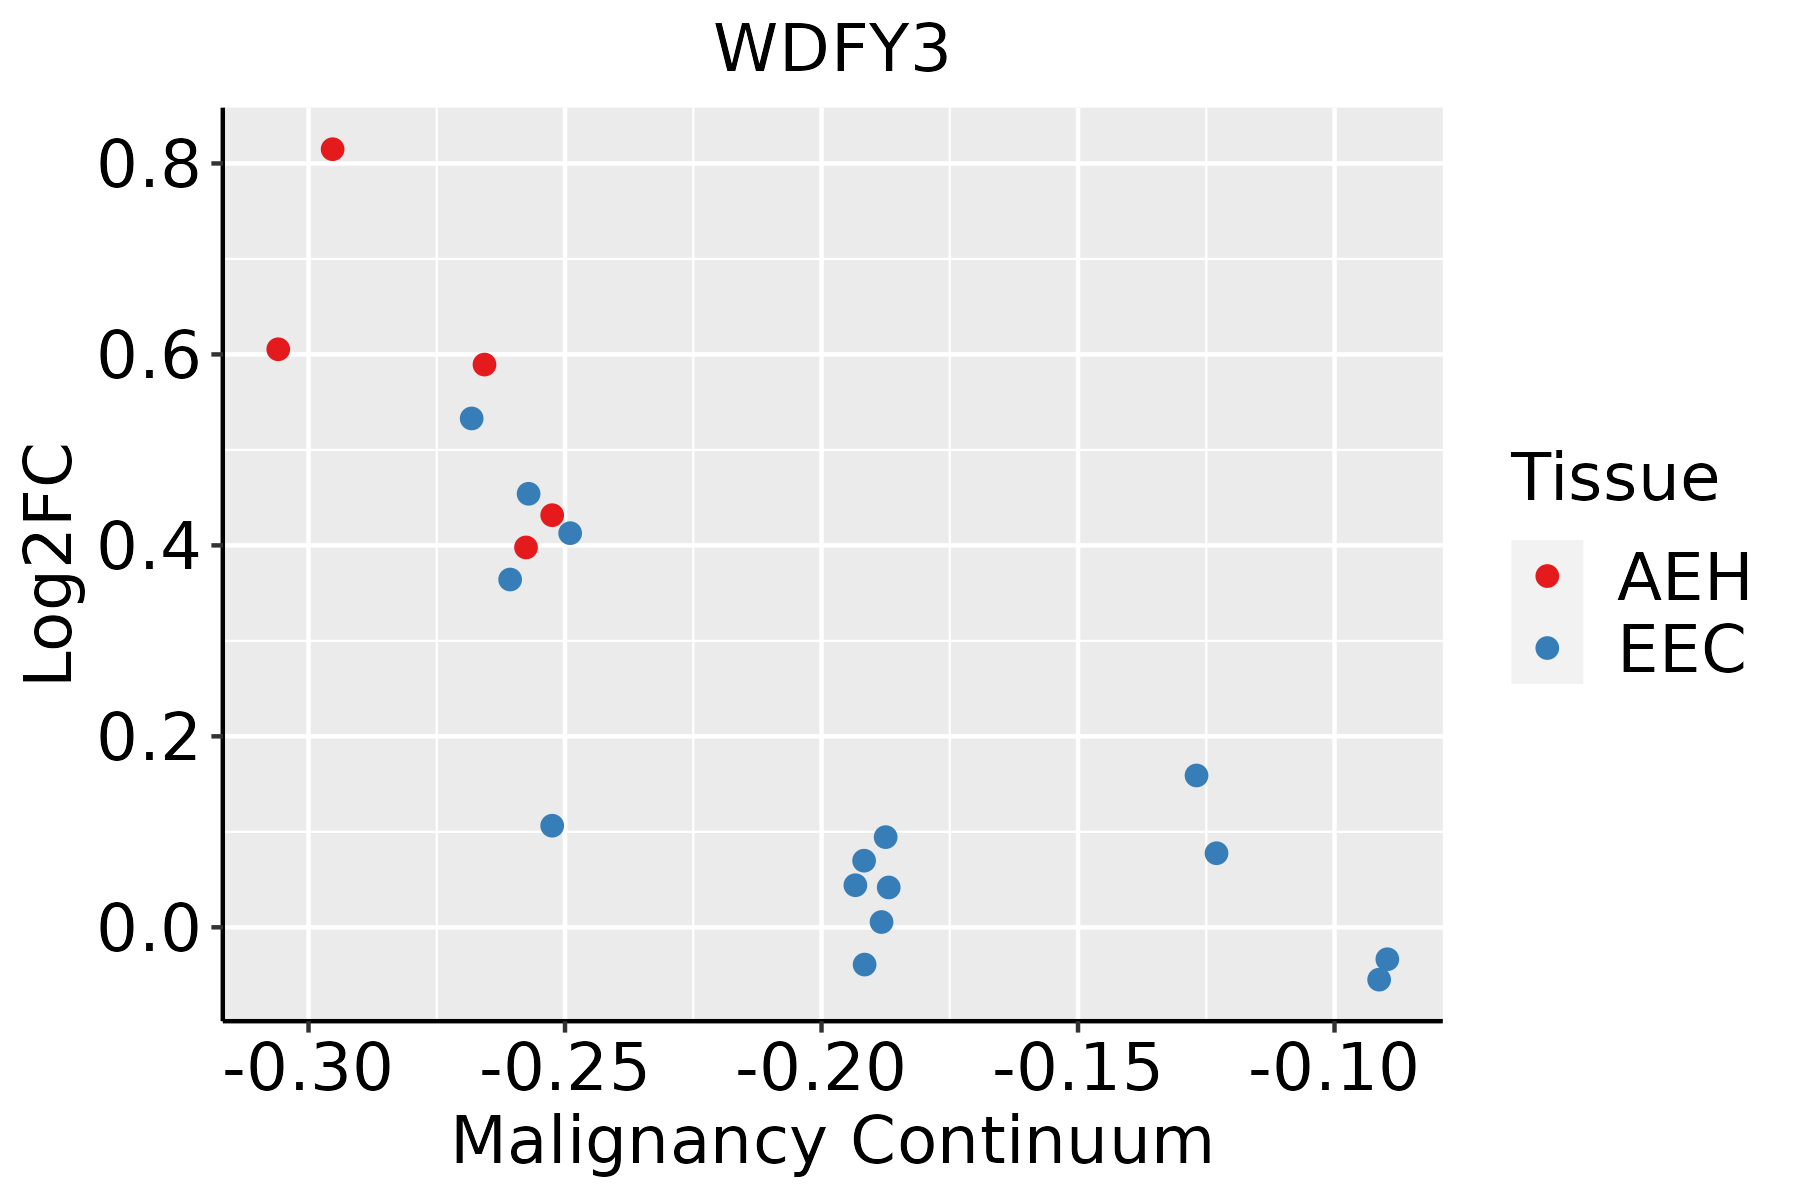 | AEH: Atypical endometrial hyperplasia |
| EEC: Endometrioid Cancer | ||
| Liver |  | HCC: Hepatocellular carcinoma |
| NAFLD: Non-alcoholic fatty liver disease | ||
| Lung | 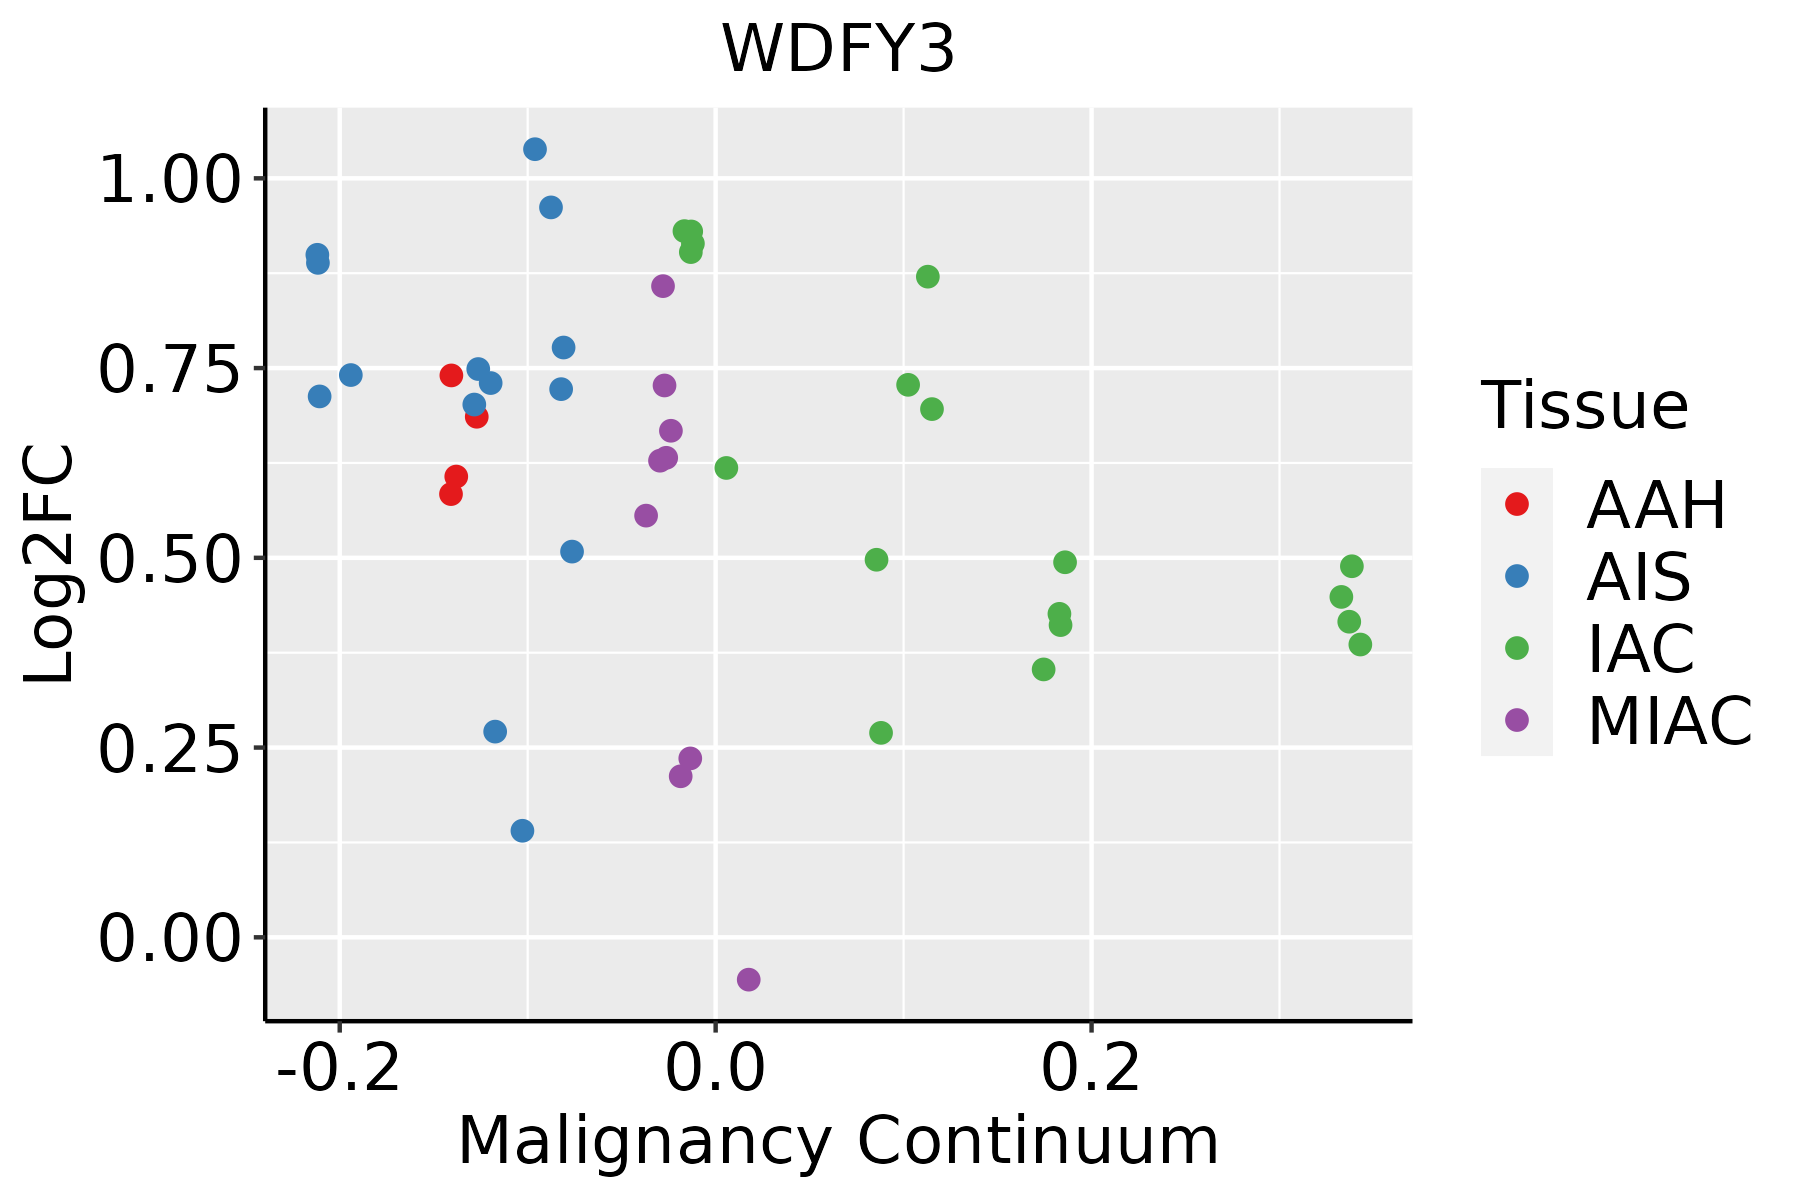 | AAH: Atypical adenomatous hyperplasia |
| AIS: Adenocarcinoma in situ | ||
| IAC: Invasive lung adenocarcinoma | ||
| MIA: Minimally invasive adenocarcinoma | ||
| Prostate | 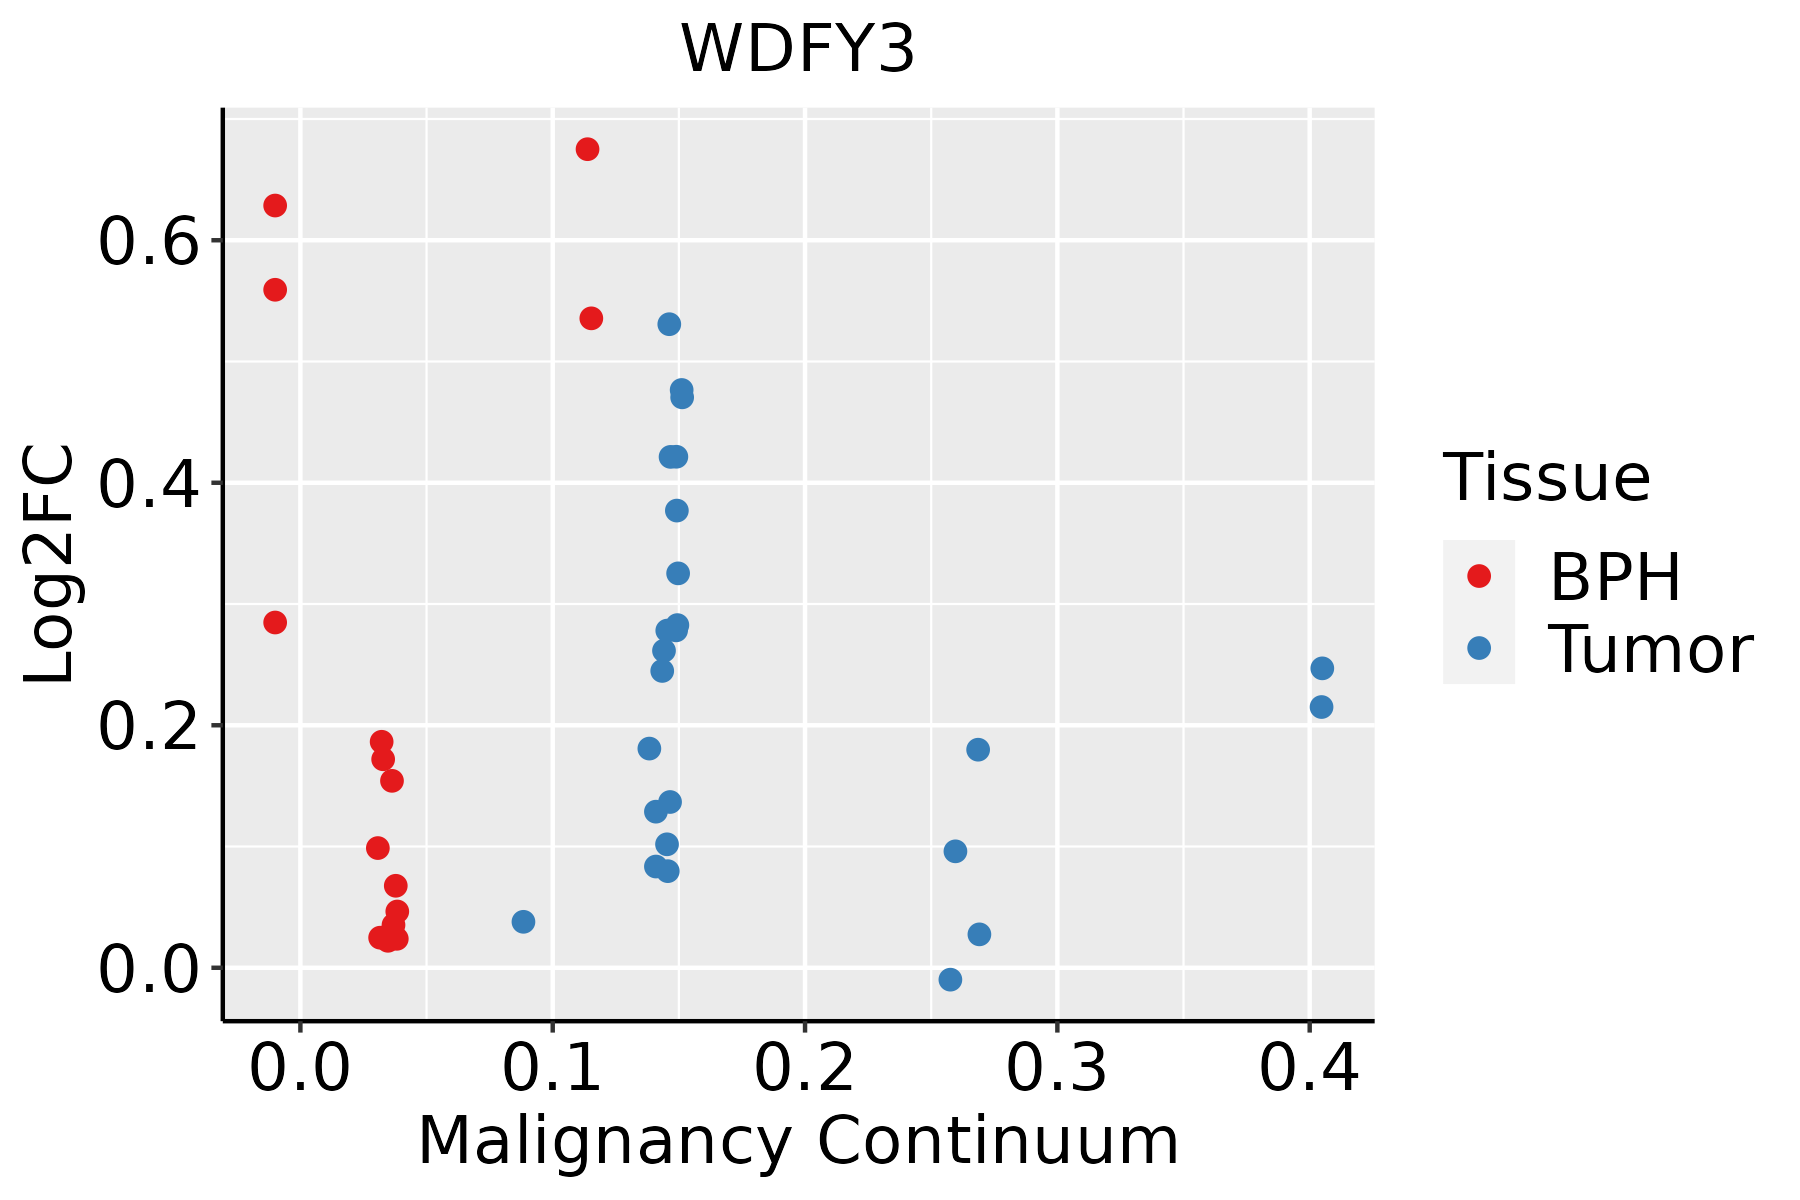 | BPH: Benign Prostatic Hyperplasia |
| Skin | 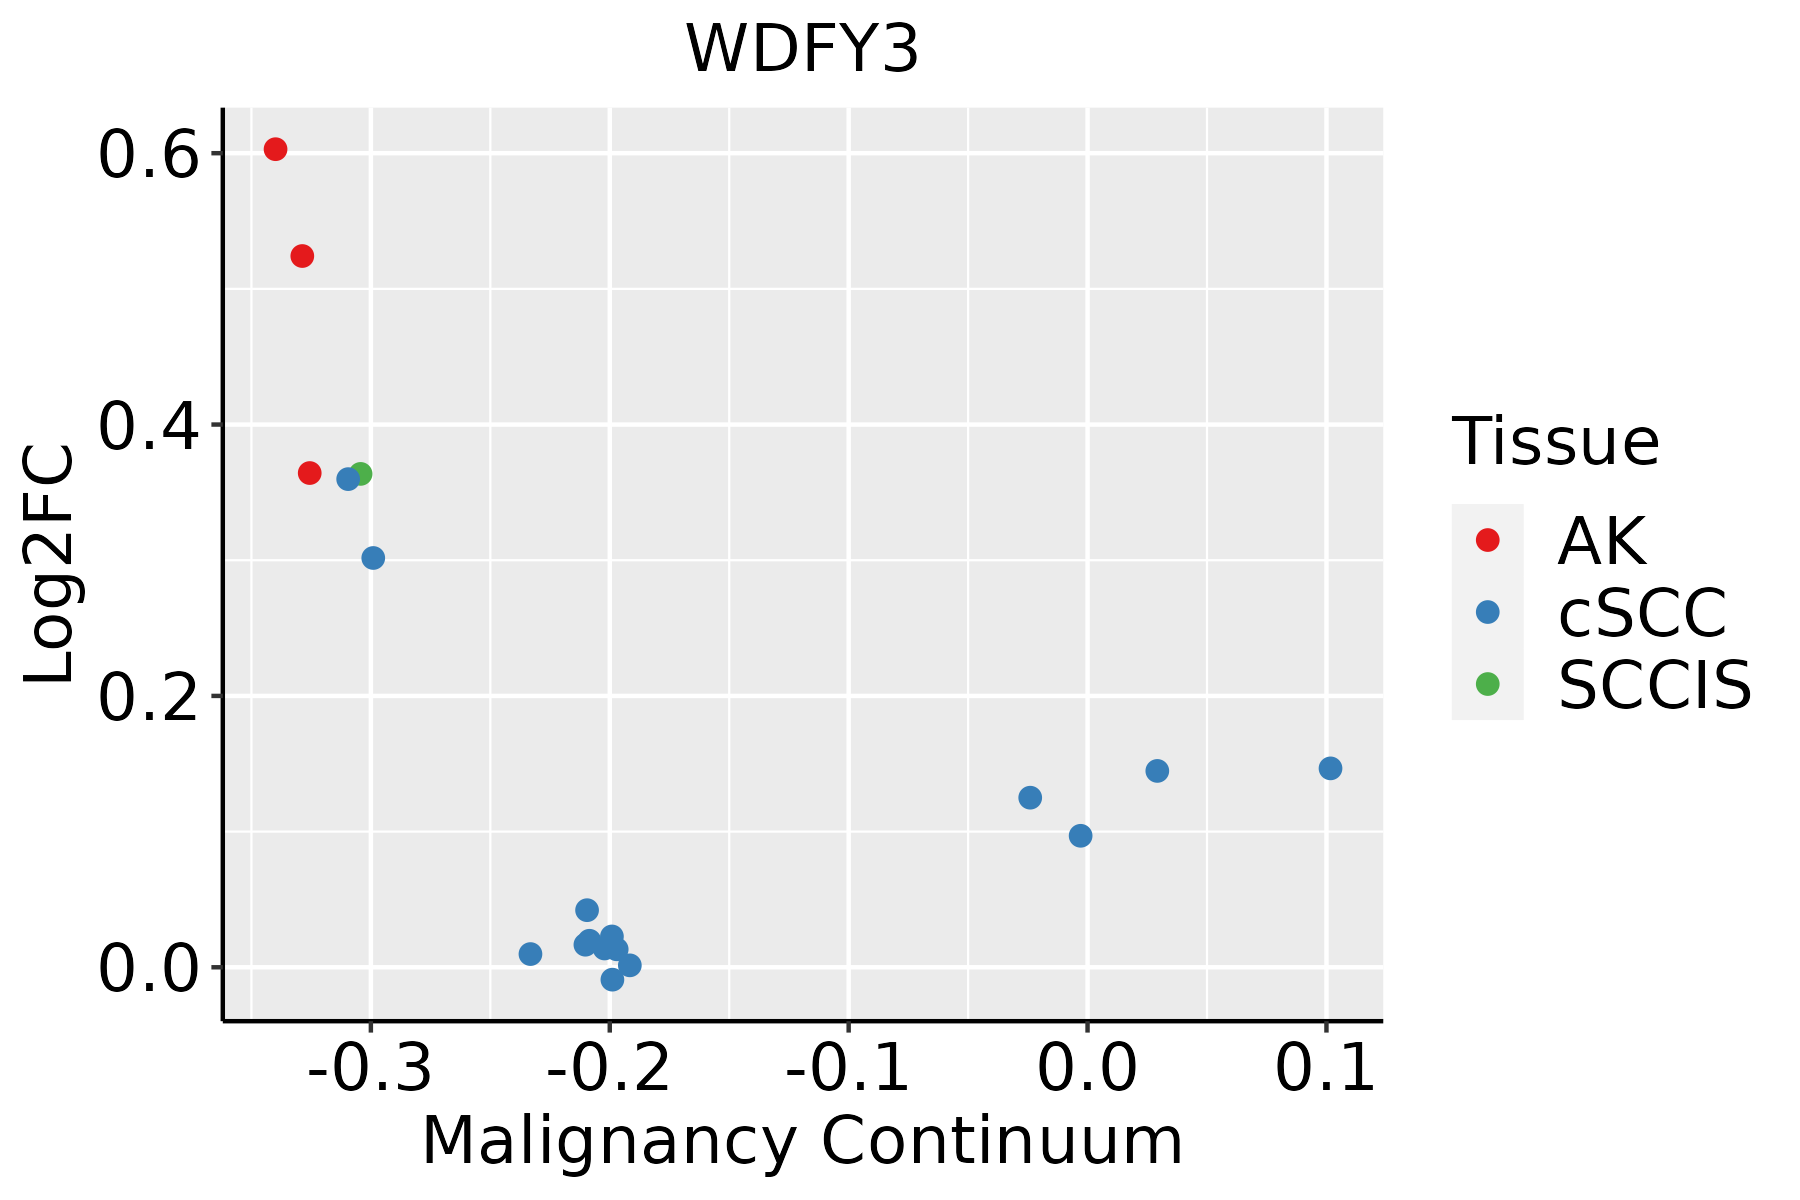 | AK: Actinic keratosis |
| cSCC: Cutaneous squamous cell carcinoma | ||
| SCCIS:squamous cell carcinoma in situ |
| ∗log2FC in expression of this searched gene in stem-like cells from each diseased tissue sample relative to stem-like cells in normal samples in each tissue plotted against the malignancy continuum. Samples are colored based on if they are from different disease stage. |
Top |
Malignant transformation related pathway analysis |
| Find out the enriched GO biological processes and KEGG pathways involved in transition from healthy to precancer to cancer |
| Tissue | Disease Stage | Enriched GO biological Processes |
| Colorectum | AD |  |
| Colorectum | SER |  |
| Colorectum | MSS |  |
| Colorectum | MSI-H |  |
| Colorectum | FAP |  |
| ∗Top 15 enriched GO BP terms are showed in the bar plot of each disease state in each tissue. Each row represents a significant GO biological process which is colored according to the -log10(p.adjust). |
| Page: 1 2 3 4 5 6 7 8 9 |
| GO ID | Tissue | Disease Stage | Description | Gene Ratio | Bg Ratio | pvalue | p.adjust | Count |
| GO:00162367 | Cervix | CC | macroautophagy | 58/2311 | 291/18723 | 1.40e-04 | 1.70e-03 | 58 |
| GO:0016236 | Colorectum | AD | macroautophagy | 103/3918 | 291/18723 | 6.76e-09 | 4.15e-07 | 103 |
| GO:0061912 | Colorectum | AD | selective autophagy | 29/3918 | 68/18723 | 4.20e-05 | 7.39e-04 | 29 |
| GO:00162361 | Colorectum | SER | macroautophagy | 79/2897 | 291/18723 | 1.97e-07 | 1.10e-05 | 79 |
| GO:00619121 | Colorectum | SER | selective autophagy | 24/2897 | 68/18723 | 4.60e-05 | 1.15e-03 | 24 |
| GO:00162362 | Colorectum | MSS | macroautophagy | 93/3467 | 291/18723 | 2.08e-08 | 1.17e-06 | 93 |
| GO:00619122 | Colorectum | MSS | selective autophagy | 27/3467 | 68/18723 | 3.68e-05 | 7.09e-04 | 27 |
| GO:00162363 | Colorectum | FAP | macroautophagy | 70/2622 | 291/18723 | 2.73e-06 | 1.02e-04 | 70 |
| GO:00619123 | Colorectum | FAP | selective autophagy | 19/2622 | 68/18723 | 1.97e-03 | 1.65e-02 | 19 |
| GO:00162364 | Colorectum | CRC | macroautophagy | 51/2078 | 291/18723 | 6.40e-04 | 8.48e-03 | 51 |
| GO:00162368 | Endometrium | AEH | macroautophagy | 52/2100 | 291/18723 | 4.56e-04 | 4.80e-03 | 52 |
| GO:00619125 | Endometrium | AEH | selective autophagy | 17/2100 | 68/18723 | 1.10e-03 | 9.61e-03 | 17 |
| GO:001623613 | Endometrium | EEC | macroautophagy | 53/2168 | 291/18723 | 5.40e-04 | 5.42e-03 | 53 |
| GO:006191212 | Endometrium | EEC | selective autophagy | 17/2168 | 68/18723 | 1.56e-03 | 1.25e-02 | 17 |
| GO:00162365 | Liver | NAFLD | macroautophagy | 45/1882 | 291/18723 | 2.31e-03 | 2.19e-02 | 45 |
| GO:001623621 | Liver | HCC | macroautophagy | 204/7958 | 291/18723 | 8.66e-22 | 1.41e-19 | 204 |
| GO:006191211 | Liver | HCC | selective autophagy | 49/7958 | 68/18723 | 7.43e-07 | 1.15e-05 | 49 |
| GO:00162366 | Lung | IAC | macroautophagy | 51/2061 | 291/18723 | 5.30e-04 | 7.49e-03 | 51 |
| GO:001623612 | Lung | AIS | macroautophagy | 46/1849 | 291/18723 | 9.21e-04 | 1.23e-02 | 46 |
| GO:00162369 | Prostate | BPH | macroautophagy | 85/3107 | 291/18723 | 4.68e-08 | 1.29e-06 | 85 |
| Page: 1 2 |
| Pathway ID | Tissue | Disease Stage | Description | Gene Ratio | Bg Ratio | pvalue | p.adjust | qvalue | Count |
| Page: 1 |
Top |
Cell-cell communication analysis |
| Identification of potential cell-cell interactions between two cell types and their ligand-receptor pairs for different disease states |
| Ligand | Receptor | LRpair | Pathway | Tissue | Disease Stage |
| Page: 1 |
Top |
Single-cell gene regulatory network inference analysis |
| Find out the significant the regulons (TFs) and the target genes of each regulon across cell types for different disease states |
| TF | Cell Type | Tissue | Disease Stage | Target Gene | RSS | Regulon Activity |
| ∗The dot plots of a searched regulon are shown for all cell subpopulations in each disease state of each tissue based on the regulon specific score inferred using pySCENIC and by calculating the average expression. |
| Page: 1 |
Top |
Somatic mutation of malignant transformation related genes |
| Annotation of somatic variants for genes involved in malignant transformation |
| Hugo Symbol | Variant Class | Variant Classification | dbSNP RS | HGVSc | HGVSp | HGVSp Short | SWISSPROT | BIOTYPE | SIFT | PolyPhen | Tumor Sample Barcode | Tissue | Histology | Sex | Age | Stage | Therapy Types | Drugs | Outcome |
| WDFY3 | SNV | Missense_Mutation | c.7778N>C | p.Arg2593Thr | p.R2593T | Q8IZQ1 | protein_coding | tolerated(0.4) | benign(0.055) | TCGA-AC-A23H-01 | Breast | breast invasive carcinoma | Female | >=65 | I/II | Unknown | Unknown | PD | |
| WDFY3 | SNV | Missense_Mutation | c.3589N>T | p.Val1197Phe | p.V1197F | Q8IZQ1 | protein_coding | deleterious(0.01) | benign(0.213) | TCGA-AC-A23H-01 | Breast | breast invasive carcinoma | Female | >=65 | I/II | Unknown | Unknown | PD | |
| WDFY3 | SNV | Missense_Mutation | novel | c.4103T>C | p.Leu1368Ser | p.L1368S | Q8IZQ1 | protein_coding | deleterious(0) | benign(0.157) | TCGA-AC-A3OD-01 | Breast | breast invasive carcinoma | Female | >=65 | I/II | Unknown | Unknown | SD |
| WDFY3 | SNV | Missense_Mutation | c.10143N>T | p.Lys3381Asn | p.K3381N | Q8IZQ1 | protein_coding | deleterious(0.01) | benign(0.137) | TCGA-AN-A0XS-01 | Breast | breast invasive carcinoma | Female | <65 | III/IV | Unknown | Unknown | SD | |
| WDFY3 | SNV | Missense_Mutation | rs749296116 | c.9919A>C | p.Thr3307Pro | p.T3307P | Q8IZQ1 | protein_coding | tolerated(0.41) | benign(0.013) | TCGA-AO-A0J9-01 | Breast | breast invasive carcinoma | Female | <65 | III/IV | Chemotherapy | cyclophosphamide | PD |
| WDFY3 | SNV | Missense_Mutation | rs754311949 | c.5670G>A | p.Met1890Ile | p.M1890I | Q8IZQ1 | protein_coding | tolerated(0.25) | benign(0.003) | TCGA-AR-A0TX-01 | Breast | breast invasive carcinoma | Female | <65 | I/II | Unknown | Unknown | SD |
| WDFY3 | SNV | Missense_Mutation | rs201478367 | c.7297G>A | p.Val2433Ile | p.V2433I | Q8IZQ1 | protein_coding | tolerated(1) | benign(0) | TCGA-B6-A40C-01 | Breast | breast invasive carcinoma | Female | <65 | I/II | Hormone Therapy | cyclophosphamide | SD |
| WDFY3 | SNV | Missense_Mutation | c.3825N>C | p.Leu1275Phe | p.L1275F | Q8IZQ1 | protein_coding | tolerated(0.23) | benign(0.046) | TCGA-BH-A0BA-01 | Breast | breast invasive carcinoma | Female | <65 | III/IV | Chemotherapy | cytoxan | SD | |
| WDFY3 | SNV | Missense_Mutation | c.5873C>T | p.Ala1958Val | p.A1958V | Q8IZQ1 | protein_coding | tolerated(0.15) | benign(0.113) | TCGA-BH-A0BZ-01 | Breast | breast invasive carcinoma | Female | <65 | III/IV | Chemotherapy | doxorubicin | CR | |
| WDFY3 | SNV | Missense_Mutation | c.7778N>C | p.Arg2593Thr | p.R2593T | Q8IZQ1 | protein_coding | tolerated(0.4) | benign(0.055) | TCGA-BH-A0HP-01 | Breast | breast invasive carcinoma | Female | >=65 | III/IV | Chemotherapy | doxorubicin | SD |
| Page: 1 2 3 4 5 6 7 8 9 10 11 12 13 14 15 16 17 18 19 20 21 22 23 24 25 26 27 28 29 30 31 32 33 34 35 36 37 38 |
Top |
Related drugs of malignant transformation related genes |
| Identification of chemicals and drugs interact with genes involved in malignant transfromation |
| (DGIdb 4.0) |
| Entrez ID | Symbol | Category | Interaction Types | Drug Claim Name | Drug Name | PMIDs |
| Page: 1 |

Copyright 2023-Present -The University of Texas Health Science Center at Houston |