
|
|||||
|
 | |
| |
| |
| |
| |
| |
|
Gene: WDFY2 |
Gene summary for WDFY2 |
| Gene information | Species | Human | Gene symbol | WDFY2 | Gene ID | 115825 |
| Gene name | WD repeat and FYVE domain containing 2 | |
| Gene Alias | PROF | |
| Cytomap | 13q14.3 | |
| Gene Type | protein-coding | GO ID | GO:0001932 | UniProtAcc | Q96P53 |
Top |
Malignant transformation analysis |
| Identification of the aberrant gene expression in precancerous and cancerous lesions by comparing the gene expression of stem-like cells in diseased tissues with normal stem cells |
| Entrez ID | Symbol | Replicates | Species | Organ | Tissue | Adj P-value | Log2FC | Malignancy |
| 115825 | WDFY2 | CCI_1 | Human | Cervix | CC | 3.05e-09 | 1.04e+00 | 0.528 |
| 115825 | WDFY2 | CCI_2 | Human | Cervix | CC | 8.86e-12 | 1.23e+00 | 0.5249 |
| 115825 | WDFY2 | CCI_3 | Human | Cervix | CC | 8.02e-09 | 7.19e-01 | 0.516 |
| 115825 | WDFY2 | AEH-subject1 | Human | Endometrium | AEH | 4.03e-08 | 2.89e-01 | -0.3059 |
| 115825 | WDFY2 | AEH-subject3 | Human | Endometrium | AEH | 4.99e-03 | 2.17e-01 | -0.2576 |
| 115825 | WDFY2 | AEH-subject4 | Human | Endometrium | AEH | 3.96e-07 | 3.74e-01 | -0.2657 |
| 115825 | WDFY2 | AEH-subject5 | Human | Endometrium | AEH | 3.79e-17 | 5.68e-01 | -0.2953 |
| 115825 | WDFY2 | EEC-subject1 | Human | Endometrium | EEC | 3.21e-07 | 3.91e-01 | -0.2682 |
| 115825 | WDFY2 | EEC-subject2 | Human | Endometrium | EEC | 1.04e-06 | 3.47e-01 | -0.2607 |
| 115825 | WDFY2 | EEC-subject4 | Human | Endometrium | EEC | 1.69e-04 | 2.72e-01 | -0.2571 |
| 115825 | WDFY2 | EEC-subject5 | Human | Endometrium | EEC | 1.33e-03 | 2.94e-01 | -0.249 |
| 115825 | WDFY2 | GSM5276934 | Human | Endometrium | EEC | 3.08e-03 | -8.62e-02 | -0.0913 |
| 115825 | WDFY2 | GSM6177620_NYU_UCEC1_lib1_lib1 | Human | Endometrium | EEC | 4.51e-04 | -3.24e-02 | -0.1869 |
| 115825 | WDFY2 | GSM6177620_NYU_UCEC1_lib2_lib2 | Human | Endometrium | EEC | 7.99e-06 | 4.42e-02 | -0.1875 |
| 115825 | WDFY2 | GSM6177620_NYU_UCEC1_lib3_lib3 | Human | Endometrium | EEC | 8.81e-05 | -1.64e-02 | -0.1883 |
| 115825 | WDFY2 | GSM6177621_NYU_UCEC2_lib1_lib1 | Human | Endometrium | EEC | 4.18e-04 | 9.58e-02 | -0.1934 |
| 115825 | WDFY2 | GSM6177622_NYU_UCEC3_lib1_lib1 | Human | Endometrium | EEC | 2.65e-06 | -3.39e-02 | -0.1917 |
| 115825 | WDFY2 | GSM6177622_NYU_UCEC3_lib2_lib2 | Human | Endometrium | EEC | 2.90e-05 | -6.94e-02 | -0.1916 |
| 115825 | WDFY2 | LZE4T | Human | Esophagus | ESCC | 1.50e-15 | 3.83e-01 | 0.0811 |
| 115825 | WDFY2 | LZE7T | Human | Esophagus | ESCC | 2.72e-10 | 5.06e-01 | 0.0667 |
| Page: 1 2 3 4 5 6 7 |
| Tissue | Expression Dynamics | Abbreviation |
| Cervix | 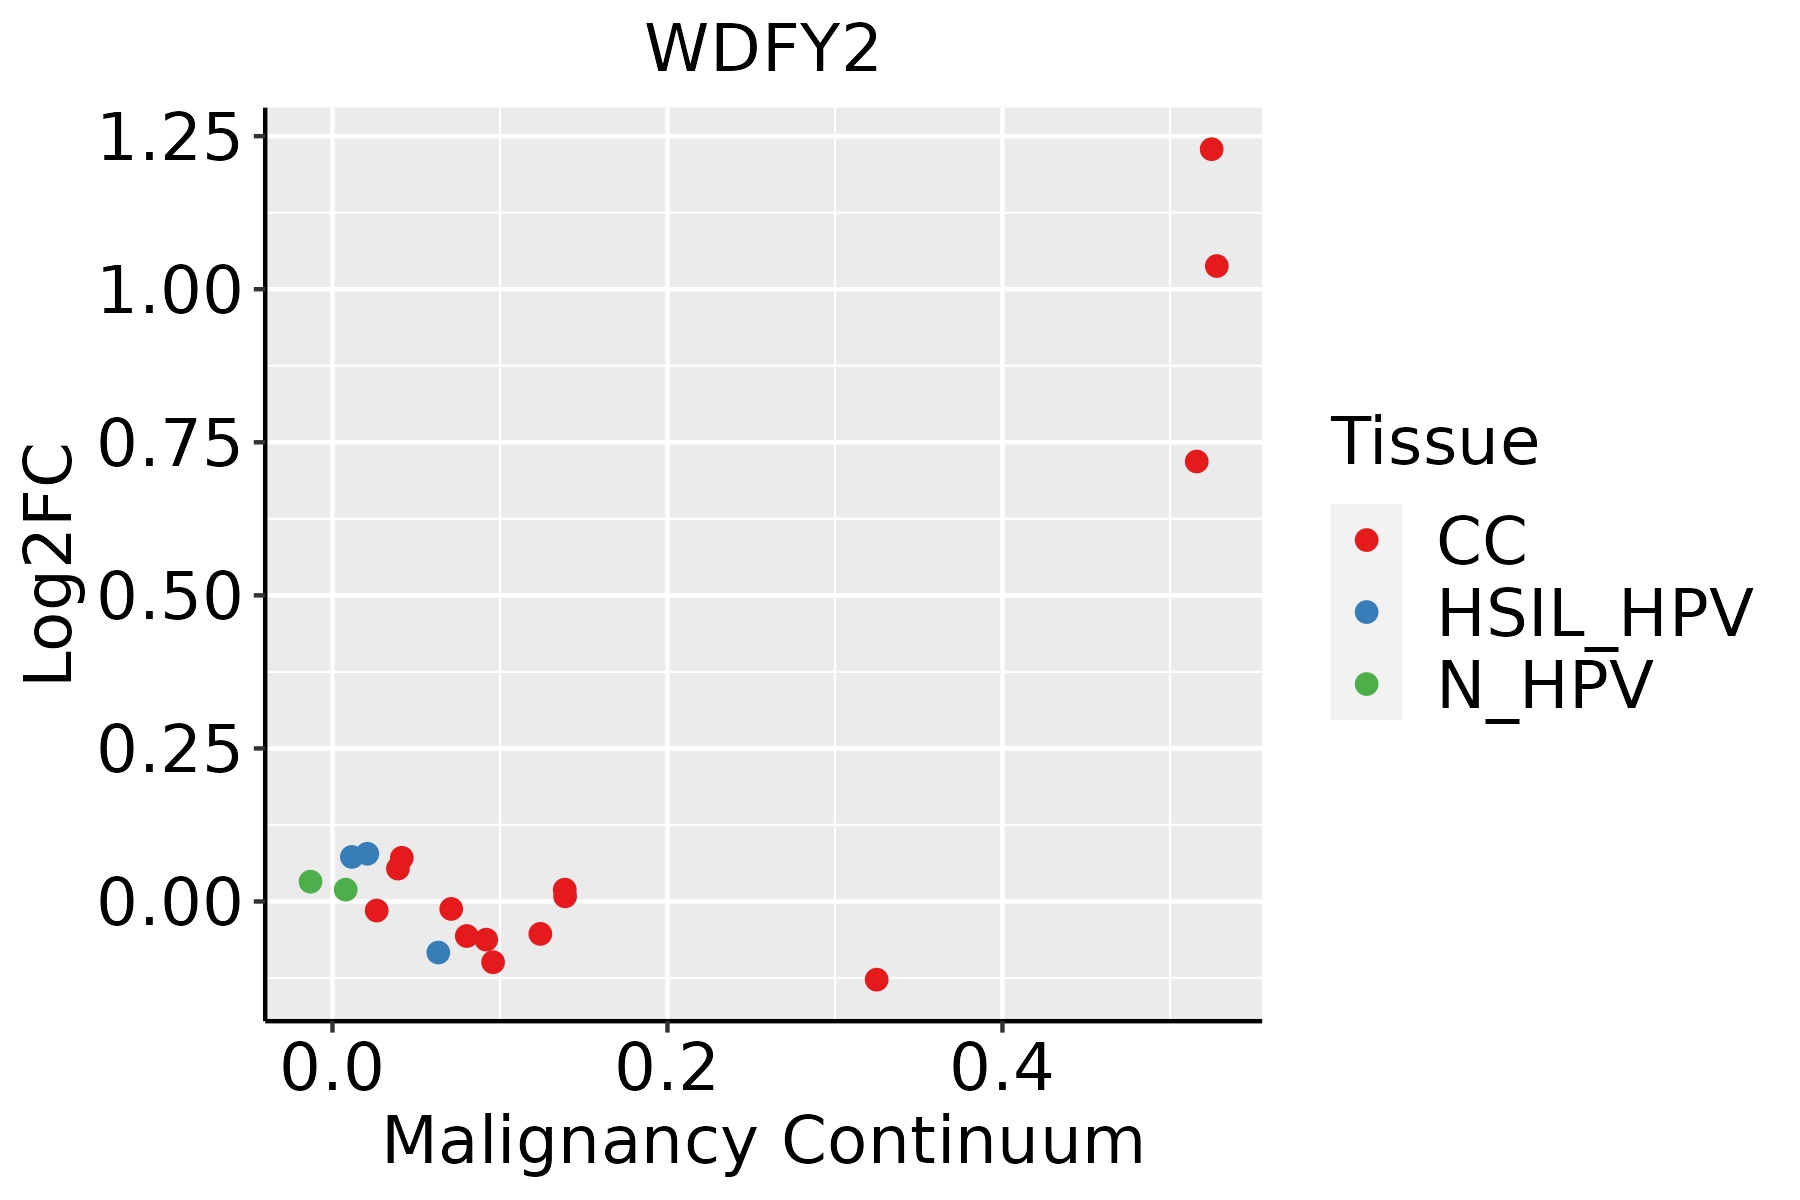 | CC: Cervix cancer |
| HSIL_HPV: HPV-infected high-grade squamous intraepithelial lesions | ||
| N_HPV: HPV-infected normal cervix | ||
| Endometrium | 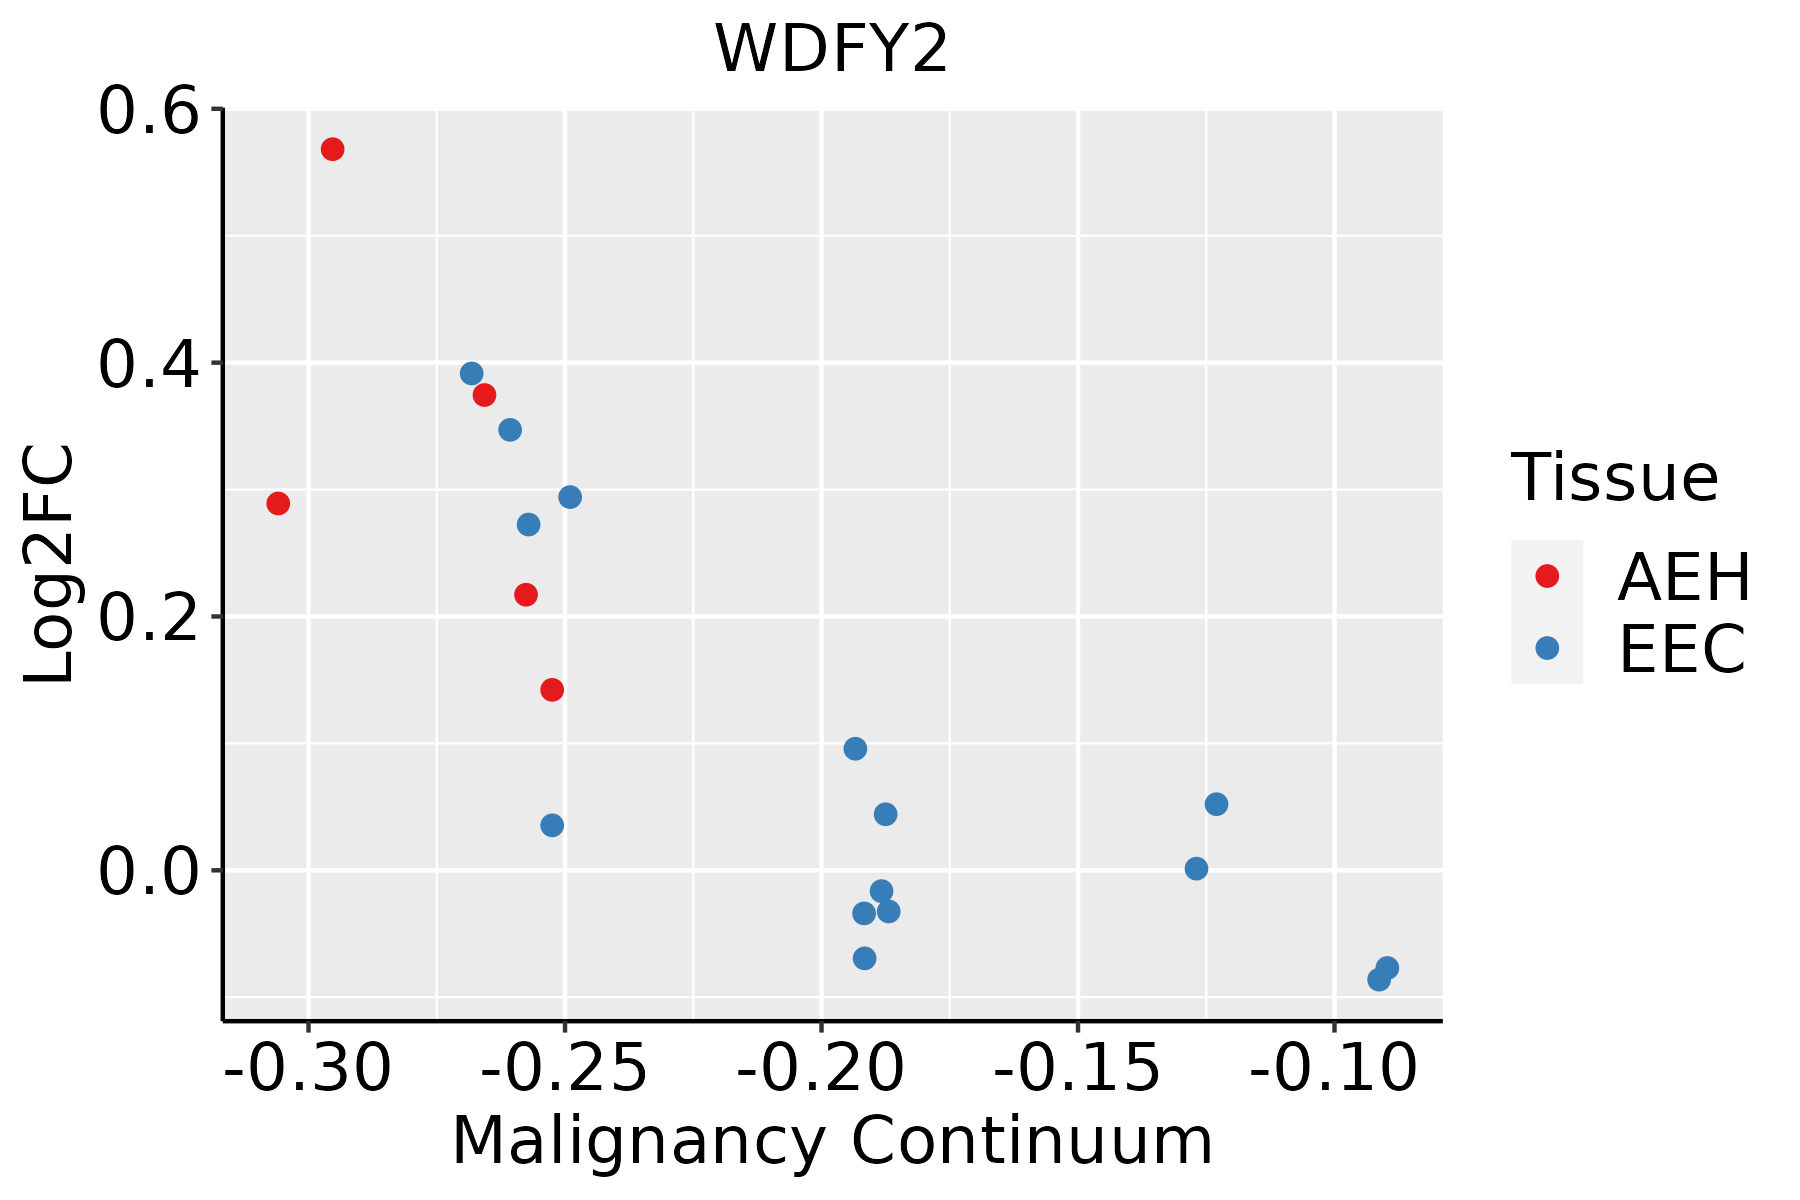 | AEH: Atypical endometrial hyperplasia |
| EEC: Endometrioid Cancer | ||
| Esophagus | 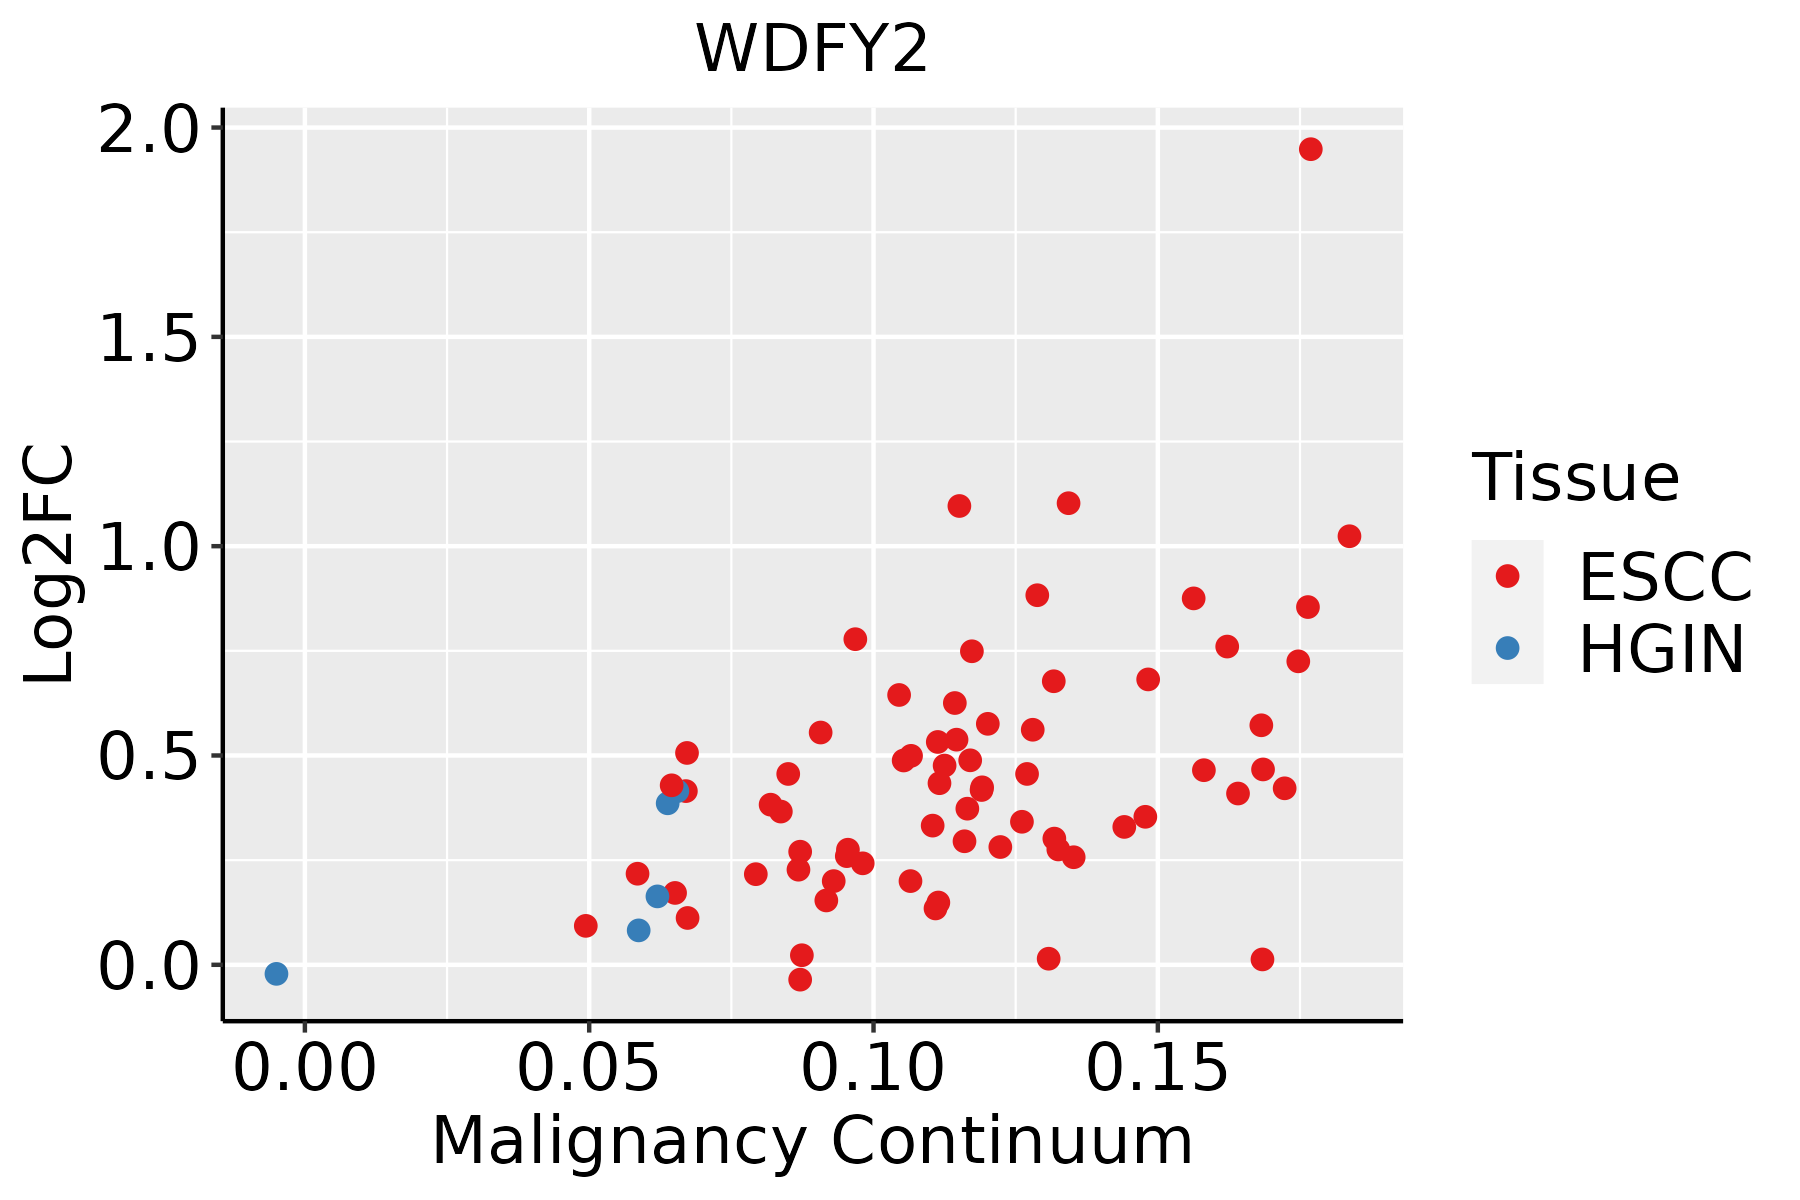 | ESCC: Esophageal squamous cell carcinoma |
| HGIN: High-grade intraepithelial neoplasias | ||
| LGIN: Low-grade intraepithelial neoplasias | ||
| Lung | 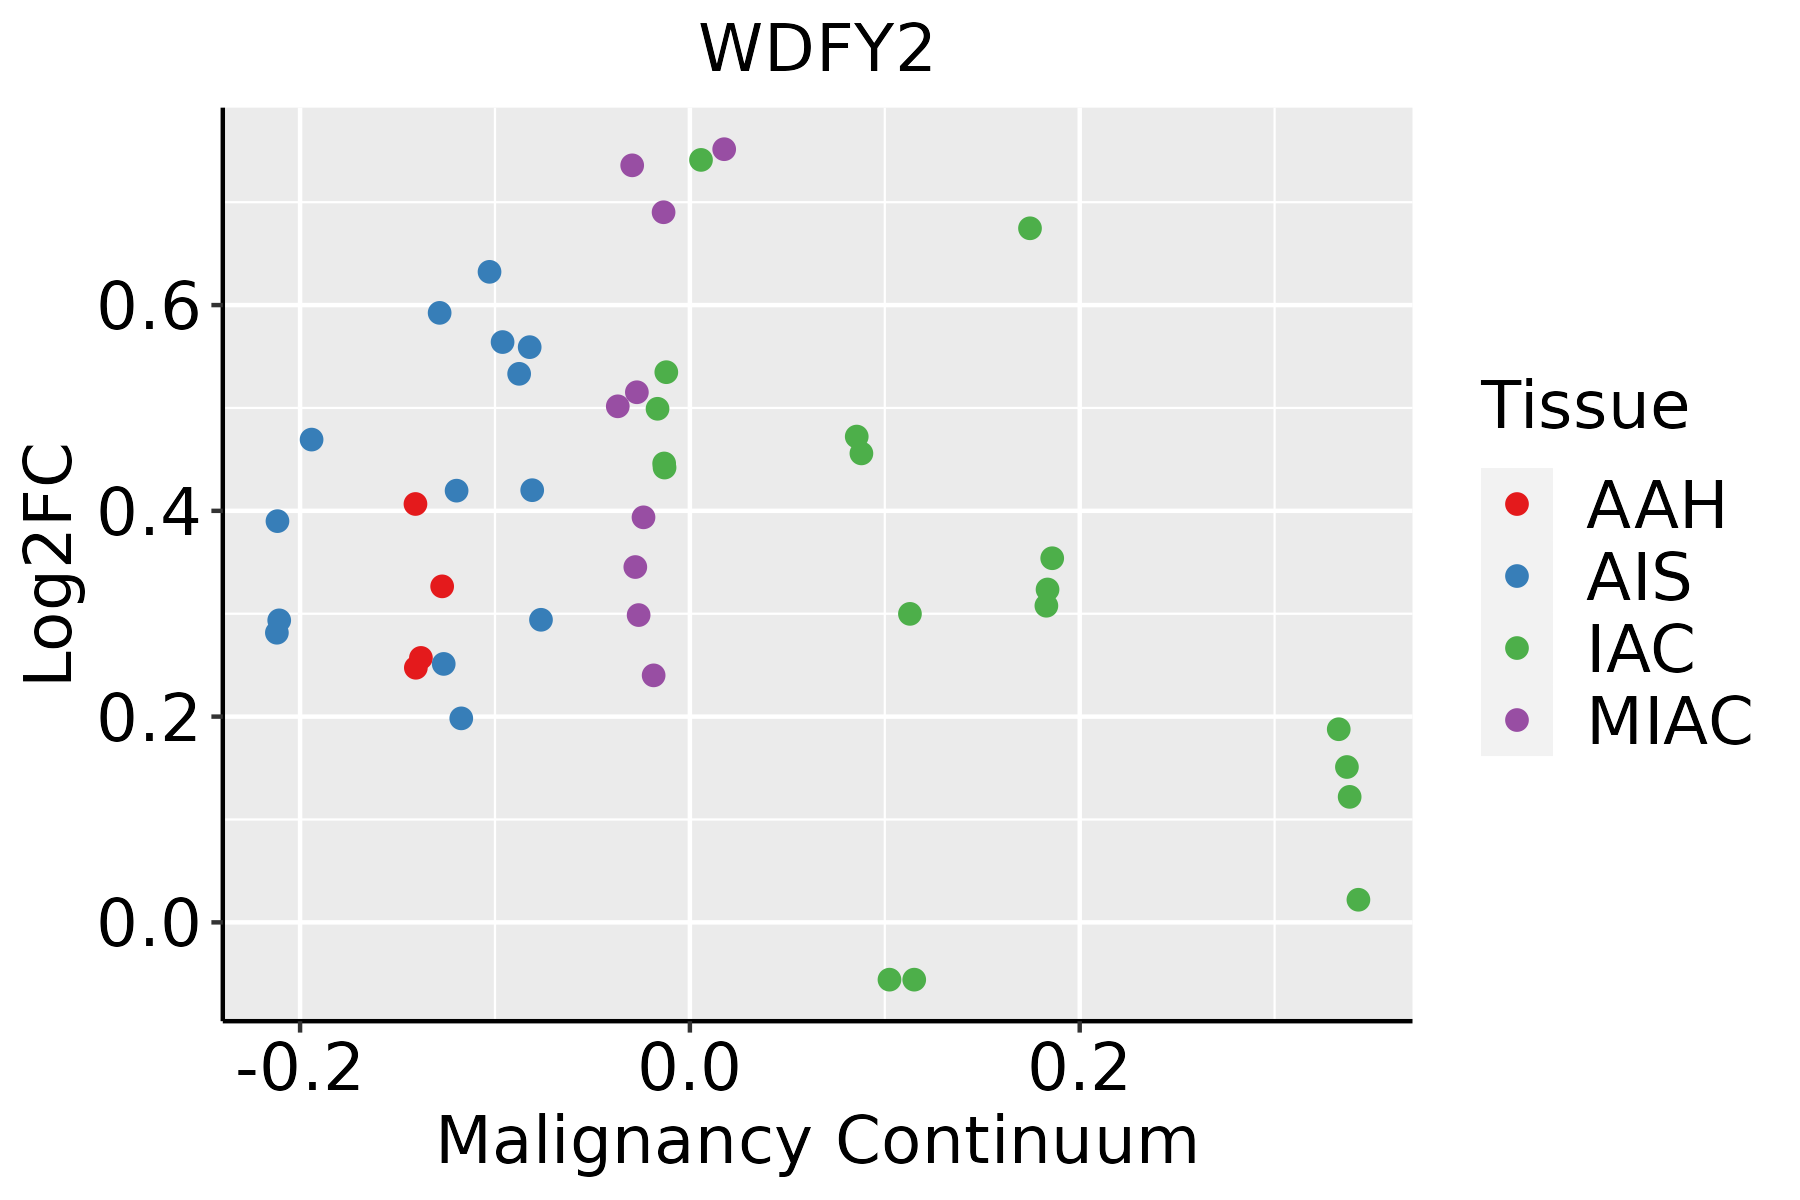 | AAH: Atypical adenomatous hyperplasia |
| AIS: Adenocarcinoma in situ | ||
| IAC: Invasive lung adenocarcinoma | ||
| MIA: Minimally invasive adenocarcinoma | ||
| Oral Cavity |  | EOLP: Erosive Oral lichen planus |
| LP: leukoplakia | ||
| NEOLP: Non-erosive oral lichen planus | ||
| OSCC: Oral squamous cell carcinoma | ||
| Skin | 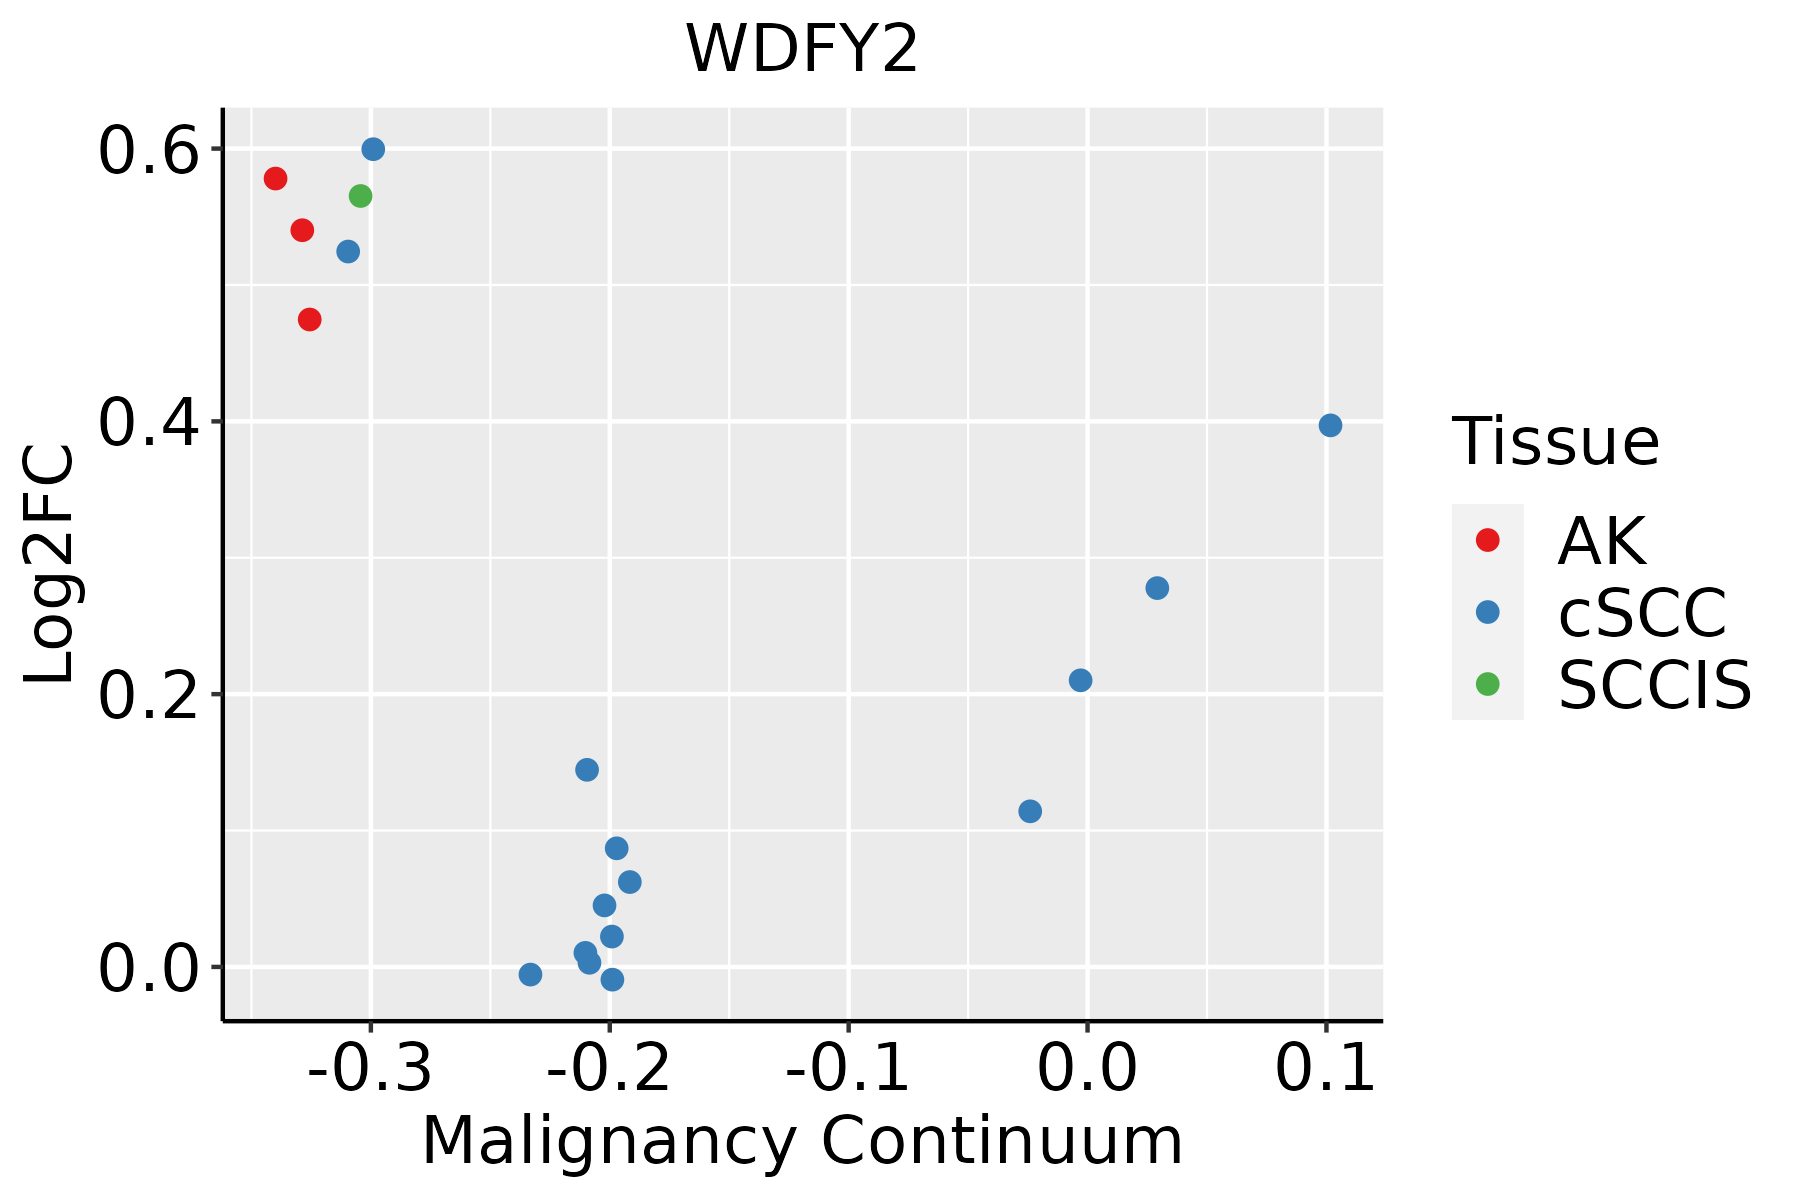 | AK: Actinic keratosis |
| cSCC: Cutaneous squamous cell carcinoma | ||
| SCCIS:squamous cell carcinoma in situ | ||
| Thyroid | 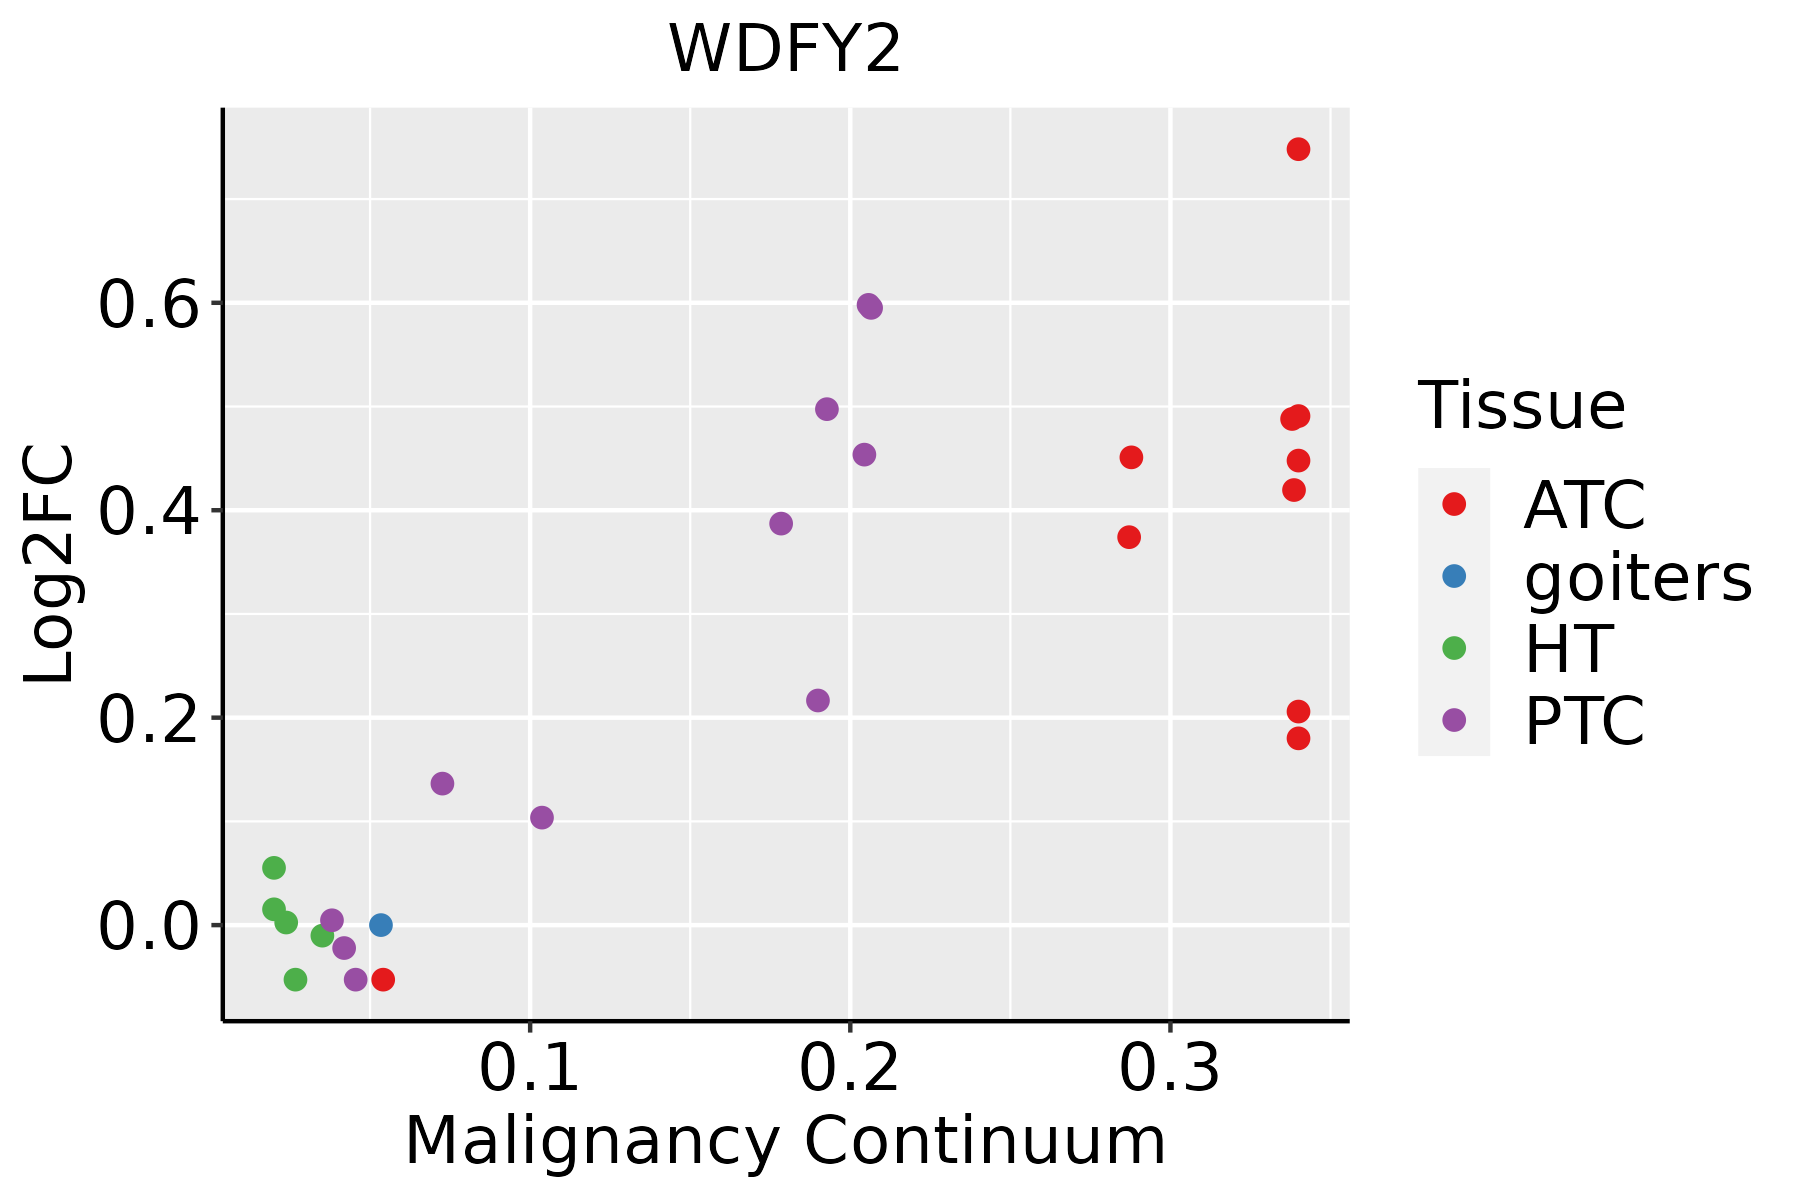 | ATC: Anaplastic thyroid cancer |
| HT: Hashimoto's thyroiditis | ||
| PTC: Papillary thyroid cancer |
| ∗log2FC in expression of this searched gene in stem-like cells from each diseased tissue sample relative to stem-like cells in normal samples in each tissue plotted against the malignancy continuum. Samples are colored based on if they are from different disease stage. |
Top |
Malignant transformation related pathway analysis |
| Find out the enriched GO biological processes and KEGG pathways involved in transition from healthy to precancer to cancer |
| Tissue | Disease Stage | Enriched GO biological Processes |
| Colorectum | AD |  |
| Colorectum | SER |  |
| Colorectum | MSS |  |
| Colorectum | MSI-H |  |
| Colorectum | FAP |  |
| ∗Top 15 enriched GO BP terms are showed in the bar plot of each disease state in each tissue. Each row represents a significant GO biological process which is colored according to the -log10(p.adjust). |
| Page: 1 2 3 4 5 6 7 8 9 |
| GO ID | Tissue | Disease Stage | Description | Gene Ratio | Bg Ratio | pvalue | p.adjust | Count |
| GO:00454445 | Cervix | CC | fat cell differentiation | 53/2311 | 229/18723 | 3.72e-06 | 9.75e-05 | 53 |
| GO:0045598 | Cervix | CC | regulation of fat cell differentiation | 31/2311 | 139/18723 | 7.06e-04 | 6.41e-03 | 31 |
| GO:00456004 | Cervix | CC | positive regulation of fat cell differentiation | 18/2311 | 66/18723 | 8.09e-04 | 7.07e-03 | 18 |
| GO:00455981 | Endometrium | AEH | regulation of fat cell differentiation | 26/2100 | 139/18723 | 6.04e-03 | 3.64e-02 | 26 |
| GO:00454446 | Endometrium | EEC | fat cell differentiation | 39/2168 | 229/18723 | 8.69e-03 | 4.71e-02 | 39 |
| GO:00454449 | Esophagus | ESCC | fat cell differentiation | 135/8552 | 229/18723 | 3.38e-05 | 2.78e-04 | 135 |
| GO:00456007 | Esophagus | ESCC | positive regulation of fat cell differentiation | 46/8552 | 66/18723 | 6.72e-05 | 5.11e-04 | 46 |
| GO:00455984 | Esophagus | ESCC | regulation of fat cell differentiation | 79/8552 | 139/18723 | 5.23e-03 | 1.97e-02 | 79 |
| GO:00456002 | Lung | IAC | positive regulation of fat cell differentiation | 17/2061 | 66/18723 | 6.14e-04 | 8.46e-03 | 17 |
| GO:00454443 | Lung | IAC | fat cell differentiation | 42/2061 | 229/18723 | 6.19e-04 | 8.50e-03 | 42 |
| GO:004544411 | Lung | AIS | fat cell differentiation | 37/1849 | 229/18723 | 1.88e-03 | 2.08e-02 | 37 |
| GO:00456001 | Lung | AIS | positive regulation of fat cell differentiation | 14/1849 | 66/18723 | 4.51e-03 | 3.99e-02 | 14 |
| GO:00454448 | Oral cavity | OSCC | fat cell differentiation | 120/7305 | 229/18723 | 2.48e-05 | 2.32e-04 | 120 |
| GO:00455983 | Oral cavity | OSCC | regulation of fat cell differentiation | 77/7305 | 139/18723 | 6.36e-05 | 5.18e-04 | 77 |
| GO:00456006 | Oral cavity | OSCC | positive regulation of fat cell differentiation | 41/7305 | 66/18723 | 1.20e-04 | 8.60e-04 | 41 |
| GO:004560013 | Oral cavity | EOLP | positive regulation of fat cell differentiation | 17/2218 | 66/18723 | 1.41e-03 | 9.58e-03 | 17 |
| GO:004544415 | Oral cavity | EOLP | fat cell differentiation | 42/2218 | 229/18723 | 2.58e-03 | 1.56e-02 | 42 |
| GO:004559812 | Oral cavity | EOLP | regulation of fat cell differentiation | 28/2218 | 139/18723 | 3.29e-03 | 1.90e-02 | 28 |
| GO:004560022 | Oral cavity | NEOLP | positive regulation of fat cell differentiation | 24/2005 | 66/18723 | 3.20e-08 | 1.35e-06 | 24 |
| GO:004559821 | Oral cavity | NEOLP | regulation of fat cell differentiation | 37/2005 | 139/18723 | 1.12e-07 | 4.05e-06 | 37 |
| Page: 1 2 |
| Pathway ID | Tissue | Disease Stage | Description | Gene Ratio | Bg Ratio | pvalue | p.adjust | qvalue | Count |
| Page: 1 |
Top |
Cell-cell communication analysis |
| Identification of potential cell-cell interactions between two cell types and their ligand-receptor pairs for different disease states |
| Ligand | Receptor | LRpair | Pathway | Tissue | Disease Stage |
| Page: 1 |
Top |
Single-cell gene regulatory network inference analysis |
| Find out the significant the regulons (TFs) and the target genes of each regulon across cell types for different disease states |
| TF | Cell Type | Tissue | Disease Stage | Target Gene | RSS | Regulon Activity |
| ∗The dot plots of a searched regulon are shown for all cell subpopulations in each disease state of each tissue based on the regulon specific score inferred using pySCENIC and by calculating the average expression. |
| Page: 1 |
Top |
Somatic mutation of malignant transformation related genes |
| Annotation of somatic variants for genes involved in malignant transformation |
| Hugo Symbol | Variant Class | Variant Classification | dbSNP RS | HGVSc | HGVSp | HGVSp Short | SWISSPROT | BIOTYPE | SIFT | PolyPhen | Tumor Sample Barcode | Tissue | Histology | Sex | Age | Stage | Therapy Types | Drugs | Outcome |
| WDFY2 | SNV | Missense_Mutation | c.838G>A | p.Glu280Lys | p.E280K | Q96P53 | protein_coding | tolerated(0.16) | benign(0.424) | TCGA-A8-A095-01 | Breast | breast invasive carcinoma | Female | <65 | I/II | Chemotherapy | 5-fluorouracil | CR | |
| WDFY2 | SNV | Missense_Mutation | novel | c.28C>G | p.Leu10Val | p.L10V | Q96P53 | protein_coding | tolerated(0.31) | benign(0.021) | TCGA-BH-A0B6-01 | Breast | breast invasive carcinoma | Female | <65 | I/II | Unknown | Unknown | SD |
| WDFY2 | SNV | Missense_Mutation | rs770989218 | c.347N>C | p.Arg116Thr | p.R116T | Q96P53 | protein_coding | deleterious(0.02) | benign(0.018) | TCGA-UC-A7PF-01 | Cervix | cervical & endocervical cancer | Female | <65 | I/II | Unknown | Unknown | SD |
| WDFY2 | SNV | Missense_Mutation | c.1078G>T | p.Ala360Ser | p.A360S | Q96P53 | protein_coding | deleterious(0.05) | benign(0.079) | TCGA-A6-6653-01 | Colorectum | colon adenocarcinoma | Male | >=65 | I/II | Unknown | Unknown | SD | |
| WDFY2 | SNV | Missense_Mutation | rs373621913 | c.458N>A | p.Arg153Gln | p.R153Q | Q96P53 | protein_coding | tolerated(0.39) | benign(0.06) | TCGA-AA-3947-01 | Colorectum | colon adenocarcinoma | Female | <65 | I/II | Unknown | Unknown | SD |
| WDFY2 | SNV | Missense_Mutation | c.1156A>G | p.Thr386Ala | p.T386A | Q96P53 | protein_coding | tolerated(0.28) | benign(0.172) | TCGA-AA-A010-01 | Colorectum | colon adenocarcinoma | Female | <65 | I/II | Chemotherapy | folinic | CR | |
| WDFY2 | SNV | Missense_Mutation | rs548075940 | c.467N>T | p.Ala156Val | p.A156V | Q96P53 | protein_coding | tolerated(0.07) | benign(0.038) | TCGA-AZ-4315-01 | Colorectum | colon adenocarcinoma | Male | <65 | I/II | Unknown | Unknown | SD |
| WDFY2 | SNV | Missense_Mutation | rs752095446 | c.764G>A | p.Arg255Gln | p.R255Q | Q96P53 | protein_coding | tolerated(0.38) | possibly_damaging(0.574) | TCGA-AG-A002-01 | Colorectum | rectum adenocarcinoma | Male | <65 | I/II | Unknown | Unknown | SD |
| WDFY2 | SNV | Missense_Mutation | rs138993465 | c.610N>A | p.Ala204Thr | p.A204T | Q96P53 | protein_coding | tolerated(0.28) | benign(0.034) | TCGA-AG-A02X-01 | Colorectum | rectum adenocarcinoma | Male | >=65 | I/II | Unknown | Unknown | SD |
| WDFY2 | SNV | Missense_Mutation | c.1162N>G | p.Lys388Glu | p.K388E | Q96P53 | protein_coding | tolerated(0.05) | possibly_damaging(0.682) | TCGA-A5-A0GG-01 | Endometrium | uterine corpus endometrioid carcinoma | Female | >=65 | I/II | Unknown | Unknown | SD |
| Page: 1 2 3 4 5 |
Top |
Related drugs of malignant transformation related genes |
| Identification of chemicals and drugs interact with genes involved in malignant transfromation |
| (DGIdb 4.0) |
| Entrez ID | Symbol | Category | Interaction Types | Drug Claim Name | Drug Name | PMIDs |
| Page: 1 |

Copyright 2023-Present -The University of Texas Health Science Center at Houston |