Schematic overview of the cellular and molecular mechanisms involved in the cancer progression, including the proposed cellular and molecular mechanisms in cancer cells trajectory. AT1: alveolar type 1 cells; AT2: alveolar type 2 cells; AAH: atypical adenomatous hyperplasia; AIS: adenocarcinoma in situ; MIA: minimally invasive adenocarcinoma; IA: invasive adenocarcinoma; EMT: epithelial-mesenchymal transition

Home

Download

Statistics

Help

Contact

Center for Computational Systems Medicine
leaf

Gene summary

leaf

Malignant transformation analysis

leaf

Malignant transformation related pathway analysis

leaf

Cell-cell communication analysis

leaf

Single-cell gene regulatory network inference analysis

leaf

Somatic mutation of malignant transformation related genes

leaf

Related drugs of malignant transformation related genes

Gene: WDFY1

Gene summary for WDFY1

check button Gene summary.

Gene informationSpeciesHuman
Gene symbol

WDFY1

Gene ID

57590

Gene nameWD repeat and FYVE domain containing 1
Gene AliasFENS-1
Cytomap2q36.1
Gene Typeprotein-coding
GO ID

GO:0002221

UniProtAcc

A0A024R488


Top

Malignant transformation analysis

check button Identification of the aberrant gene expression in precancerous and cancerous lesions by comparing the gene expression of stem-like cells in diseased tissues with normal stem cells
check button Malignant transformation involving gene list.
Entrez IDSymbolReplicatesSpeciesOrganTissueAdj P-valueLog2FCMalignancy
57590WDFY1LZE4THumanEsophagusESCC3.27e-092.72e-010.0811
57590WDFY1LZE7THumanEsophagusESCC8.23e-061.94e-010.0667
57590WDFY1LZE20THumanEsophagusESCC1.26e-041.36e-010.0662
57590WDFY1LZE24THumanEsophagusESCC2.57e-103.31e-010.0596
57590WDFY1P1T-EHumanEsophagusESCC1.72e-042.58e-010.0875
57590WDFY1P2T-EHumanEsophagusESCC2.24e-174.35e-010.1177
57590WDFY1P4T-EHumanEsophagusESCC2.08e-163.03e-010.1323
57590WDFY1P5T-EHumanEsophagusESCC3.26e-113.47e-010.1327
57590WDFY1P8T-EHumanEsophagusESCC6.55e-112.81e-010.0889
57590WDFY1P9T-EHumanEsophagusESCC5.58e-082.42e-010.1131
57590WDFY1P10T-EHumanEsophagusESCC3.90e-285.25e-010.116
57590WDFY1P11T-EHumanEsophagusESCC6.66e-135.24e-010.1426
57590WDFY1P12T-EHumanEsophagusESCC2.74e-255.67e-010.1122
57590WDFY1P15T-EHumanEsophagusESCC7.62e-286.29e-010.1149
57590WDFY1P16T-EHumanEsophagusESCC2.92e-224.13e-010.1153
57590WDFY1P17T-EHumanEsophagusESCC5.38e-053.70e-010.1278
57590WDFY1P20T-EHumanEsophagusESCC9.78e-174.06e-010.1124
57590WDFY1P21T-EHumanEsophagusESCC1.73e-163.24e-010.1617
57590WDFY1P22T-EHumanEsophagusESCC3.92e-112.52e-010.1236
57590WDFY1P23T-EHumanEsophagusESCC1.28e-133.34e-010.108
Page: 1 2 3 4 5 6 

check button Transcriptomic changes along malignancy continuum.
TissueExpression DynamicsAbbreviation
EsophagusThe image shows the transcriptomic changes along malignancy continuum.log2FC in expression of this searched gene in stem-like cells from each diseased tissue sample relative to stem-like cells in normal samples in each tissue plotted against the malignancy continuum. Samples are colored based on if they are from different disease stage.ESCC: Esophageal squamous cell carcinoma
HGIN: High-grade intraepithelial neoplasias
LGIN: Low-grade intraepithelial neoplasias
LiverThe image shows the transcriptomic changes along malignancy continuum.log2FC in expression of this searched gene in stem-like cells from each diseased tissue sample relative to stem-like cells in normal samples in each tissue plotted against the malignancy continuum. Samples are colored based on if they are from different disease stage.
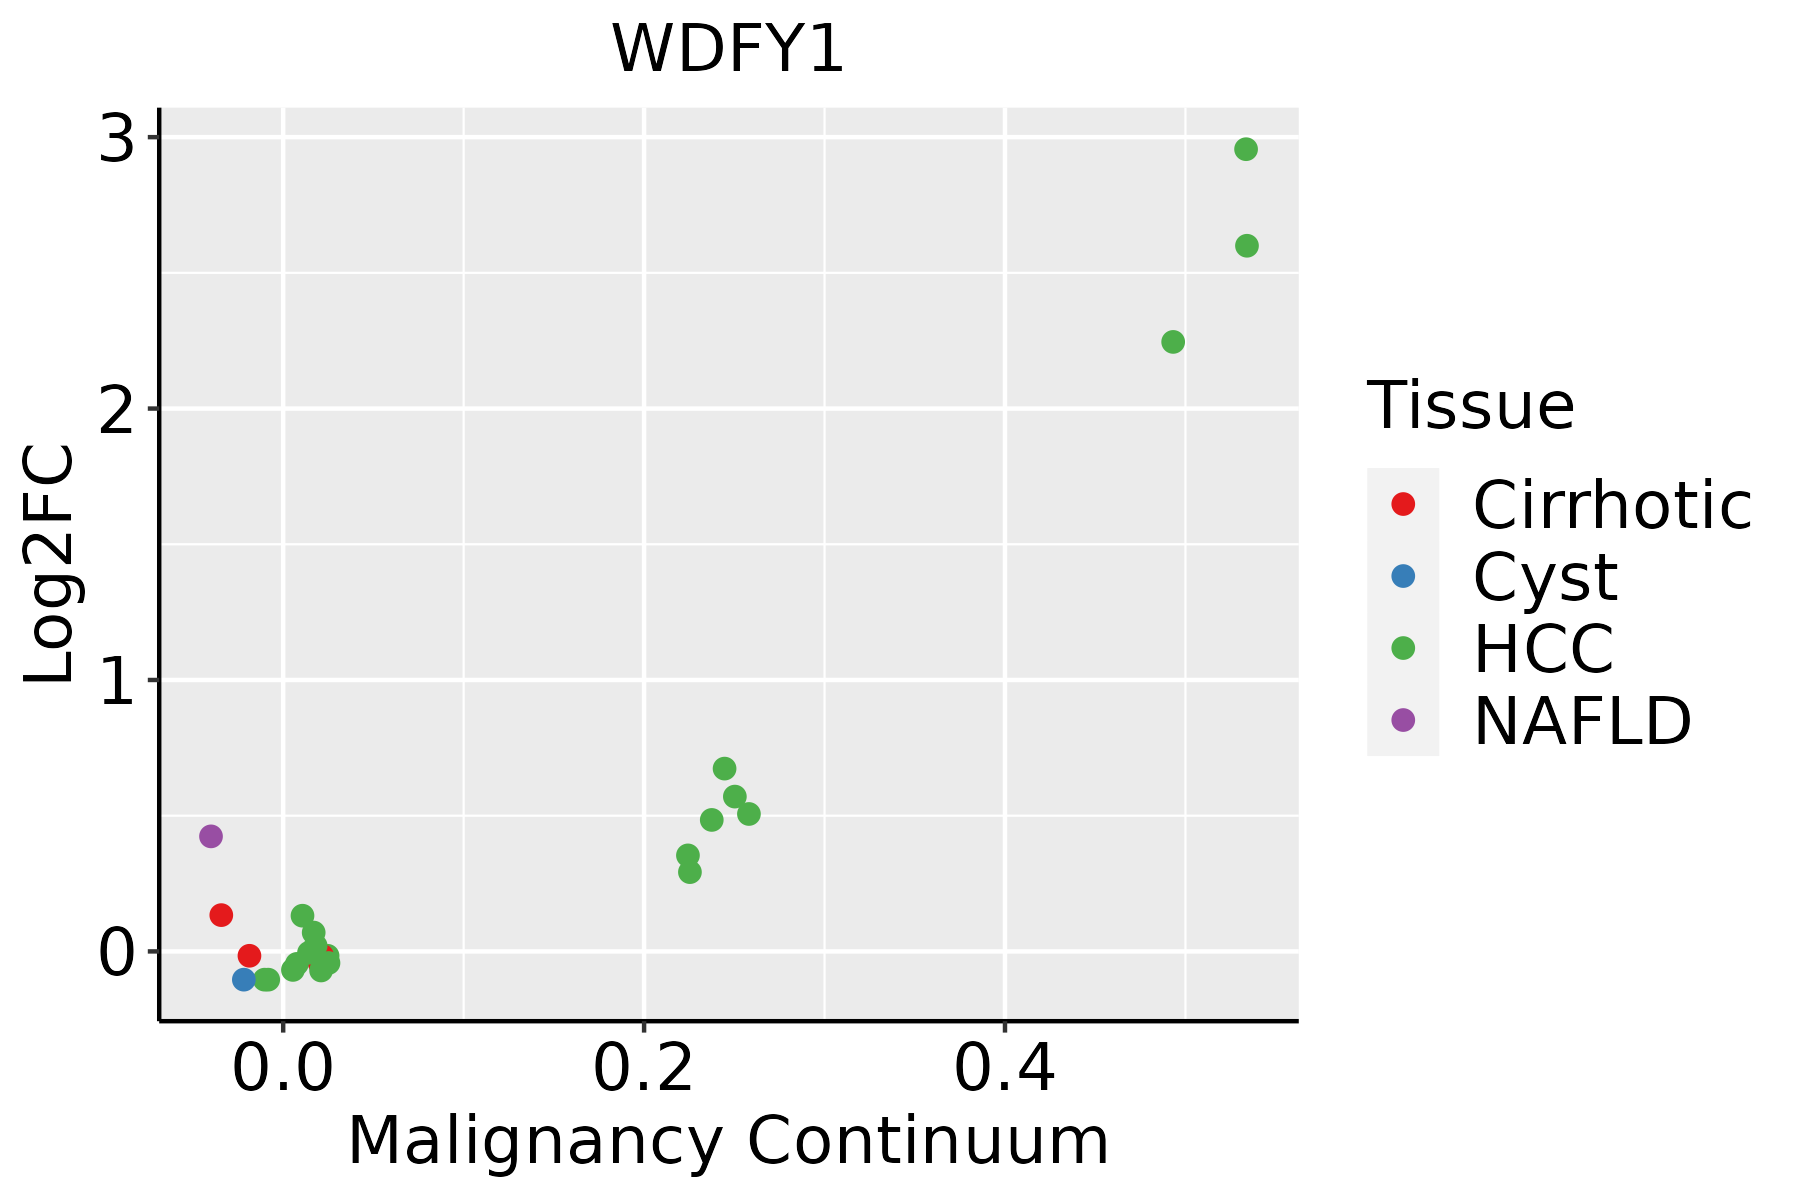
HCC: Hepatocellular carcinoma
NAFLD: Non-alcoholic fatty liver disease
Oral CavityThe image shows the transcriptomic changes along malignancy continuum.log2FC in expression of this searched gene in stem-like cells from each diseased tissue sample relative to stem-like cells in normal samples in each tissue plotted against the malignancy continuum. Samples are colored based on if they are from different disease stage.
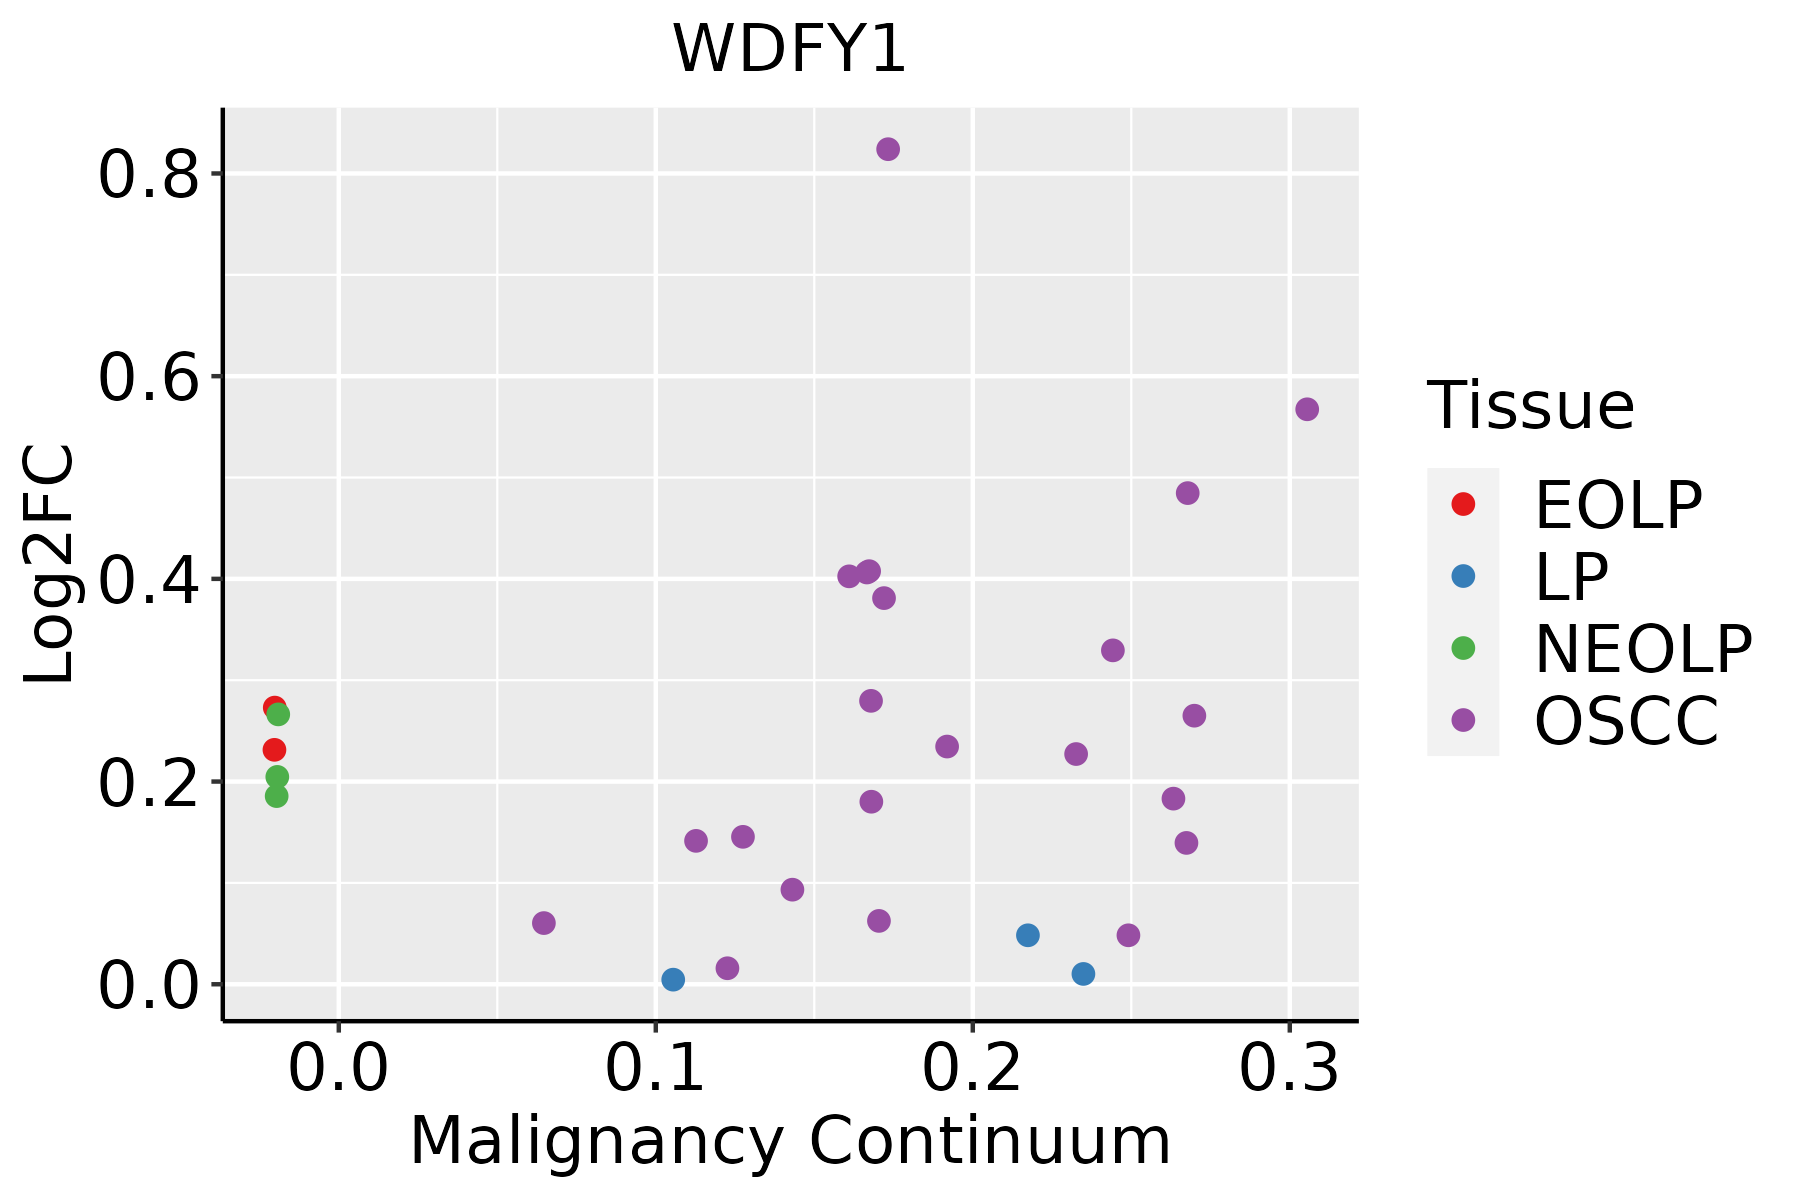
EOLP: Erosive Oral lichen planus
LP: leukoplakia
NEOLP: Non-erosive oral lichen planus
OSCC: Oral squamous cell carcinoma
ProstateThe image shows the transcriptomic changes along malignancy continuum.log2FC in expression of this searched gene in stem-like cells from each diseased tissue sample relative to stem-like cells in normal samples in each tissue plotted against the malignancy continuum. Samples are colored based on if they are from different disease stage.
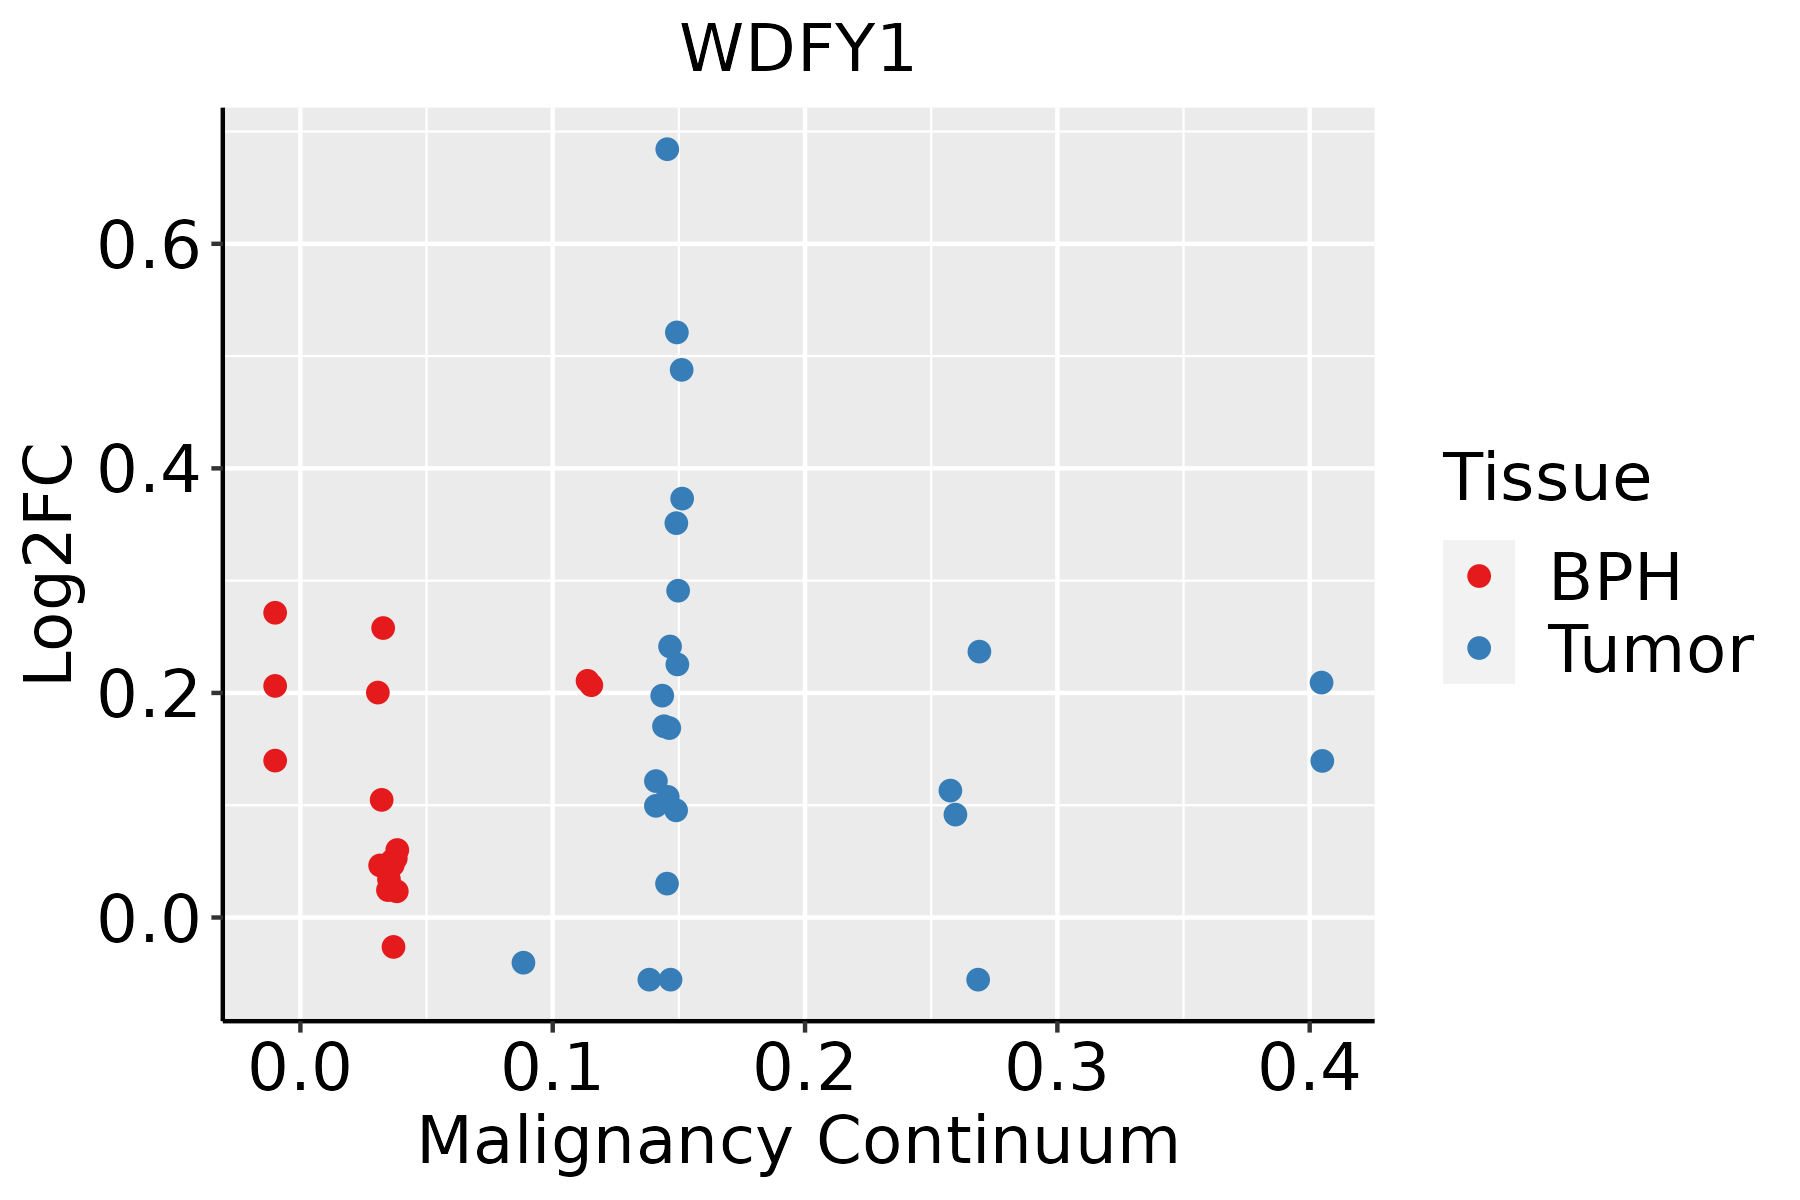
BPH: Benign Prostatic Hyperplasia
ThyroidThe image shows the transcriptomic changes along malignancy continuum.log2FC in expression of this searched gene in stem-like cells from each diseased tissue sample relative to stem-like cells in normal samples in each tissue plotted against the malignancy continuum. Samples are colored based on if they are from different disease stage.ATC: Anaplastic thyroid cancer
HT: Hashimoto's thyroiditis
PTC: Papillary thyroid cancer
∗log2FC in expression of this searched gene in stem-like cells from each diseased tissue sample relative to stem-like cells in normal samples in each tissue plotted against the malignancy continuum. Samples are colored based on if they are from different disease stage.

Top

Malignant transformation related pathway analysis

check buttonFind out the enriched GO biological processes and KEGG pathways involved in transition from healthy to precancer to cancer
check button Figure of enriched GO biological processes.
TissueDisease StageEnriched GO biological Processes
ColorectumADGO analysis - Figure of enriched GO biological processes: Top 15 enriched GO BP terms are showed in the bar plot of each disease state in each tissue. Each row represents a significant GO biological process which is colored according to the -log10(p.adjust).
ColorectumSERGO analysis - Figure of enriched GO biological processes: Top 15 enriched GO BP terms are showed in the bar plot of each disease state in each tissue. Each row represents a significant GO biological process which is colored according to the -log10(p.adjust).
ColorectumMSSGO analysis - Figure of enriched GO biological processes: Top 15 enriched GO BP terms are showed in the bar plot of each disease state in each tissue. Each row represents a significant GO biological process which is colored according to the -log10(p.adjust).
ColorectumMSI-HGO analysis - Figure of enriched GO biological processes: Top 15 enriched GO BP terms are showed in the bar plot of each disease state in each tissue. Each row represents a significant GO biological process which is colored according to the -log10(p.adjust).
ColorectumFAPGO analysis - Figure of enriched GO biological processes: Top 15 enriched GO BP terms are showed in the bar plot of each disease state in each tissue. Each row represents a significant GO biological process which is colored according to the -log10(p.adjust).
∗Top 15 enriched GO BP terms are showed in the bar plot of each disease state in each tissue. Each row represents a significant GO biological process which is colored according to the -log10(p.adjust).
Page: 1 2 3 4 5 6 7 8 9 

check button Enriched GO biological processes.
GO IDTissueDisease StageDescriptionGene RatioBg Ratiopvaluep.adjustCount
GO:00022211LiverHCCpattern recognition receptor signaling pathway107/7958172/187231.37e-072.58e-06107
GO:0002224LiverHCCtoll-like receptor signaling pathway67/7958121/187232.87e-031.34e-0267
GO:00622072LiverHCCregulation of pattern recognition receptor signaling pathway59/7958105/187233.18e-031.47e-0259
GO:00022214Oral cavityOSCCpattern recognition receptor signaling pathway95/7305172/187231.11e-051.15e-0495
GO:00622076Oral cavityOSCCregulation of pattern recognition receptor signaling pathway56/7305105/187231.99e-039.23e-0356
GO:00022243Oral cavityOSCCtoll-like receptor signaling pathway63/7305121/187232.36e-031.04e-0263
GO:00027646Oral cavityOSCCimmune response-regulating signaling pathway212/7305468/187232.93e-031.27e-02212
GO:00622087Oral cavityOSCCpositive regulation of pattern recognition receptor signaling pathway26/730544/187235.49e-032.13e-0226
GO:00341424Oral cavityOSCCtoll-like receptor 4 signaling pathway25/730543/187238.52e-033.09e-0225
GO:000276413Oral cavityEOLPimmune response-regulating signaling pathway108/2218468/187234.04e-127.34e-10108
GO:000222113Oral cavityEOLPpattern recognition receptor signaling pathway45/2218172/187231.82e-075.82e-0645
GO:000222411Oral cavityEOLPtoll-like receptor signaling pathway31/2218121/187232.21e-053.37e-0431
GO:006220713Oral cavityEOLPregulation of pattern recognition receptor signaling pathway28/2218105/187232.46e-053.65e-0428
GO:00341211Oral cavityEOLPregulation of toll-like receptor signaling pathway19/221875/187239.43e-047.15e-0319
GO:006220813Oral cavityEOLPpositive regulation of pattern recognition receptor signaling pathway13/221844/187231.30e-039.21e-0313
GO:006220822Oral cavityNEOLPpositive regulation of pattern recognition receptor signaling pathway14/200544/187231.28e-041.49e-0314
GO:000222121Oral cavityNEOLPpattern recognition receptor signaling pathway35/2005172/187231.38e-041.60e-0335
GO:000276422Oral cavityNEOLPimmune response-regulating signaling pathway74/2005468/187233.90e-043.63e-0374
GO:00022242Oral cavityNEOLPtoll-like receptor signaling pathway24/2005121/187232.08e-031.38e-0224
GO:0034138Oral cavityNEOLPtoll-like receptor 3 signaling pathway6/200516/187234.64e-032.56e-026
Page: 1 2 

check button Enriched KEGG pathways.
Pathway IDTissueDisease StageDescriptionGene RatioBg Ratiopvaluep.adjustqvalueCount
Page: 1 

Top

Cell-cell communication analysis

check buttonIdentification of potential cell-cell interactions between two cell types and their ligand-receptor pairs for different disease states
LigandReceptorLRpairPathwayTissueDisease Stage
Page: 1 

Top

Single-cell gene regulatory network inference analysis

check buttonFind out the significant the regulons (TFs) and the target genes of each regulon across cell types for different disease states
TFCell TypeTissueDisease StageTarget GeneRSSRegulon Activity
∗The dot plots of a searched regulon are shown for all cell subpopulations in each disease state of each tissue based on the regulon specific score inferred using pySCENIC and by calculating the average expression.
Page: 1 

Top

Somatic mutation of malignant transformation related genes

check buttonAnnotation of somatic variants for genes involved in malignant transformation
Hugo SymbolVariant ClassVariant ClassificationdbSNP RSHGVScHGVSpHGVSp ShortSWISSPROTBIOTYPESIFTPolyPhenTumor Sample BarcodeTissueHistologySexAgeStageTherapy TypesDrugsOutcome
WDFY1SNVMissense_Mutationrs747629496c.986N>Ap.Arg329Hisp.R329HQ8IWB7protein_codingdeleterious(0.03)probably_damaging(0.998)TCGA-AN-A046-01Breastbreast invasive carcinomaFemale>=65I/IIUnknownUnknownSD
WDFY1SNVMissense_Mutationc.161G>Ap.Arg54Lysp.R54KQ8IWB7protein_codingdeleterious(0.04)possibly_damaging(0.815)TCGA-AR-A1AK-01Breastbreast invasive carcinomaFemale>=65I/IIHormone TherapyanastrozoleSD
WDFY1SNVMissense_Mutationnovelc.955N>Ap.Gln319Lysp.Q319KQ8IWB7protein_codingtolerated(1)benign(0)TCGA-C8-A274-01Breastbreast invasive carcinomaFemale<65I/IIHormone TherapytamoxiphenSD
WDFY1insertionFrame_Shift_Insnovelc.528_529insATATATATATATGCGAAATTTAGAGp.Gly177IlefsTer17p.G177Ifs*17Q8IWB7protein_codingTCGA-A8-A08H-01Breastbreast invasive carcinomaFemale>=65I/IIUnknownUnknownSD
WDFY1SNVMissense_Mutationc.938N>Cp.His313Prop.H313PQ8IWB7protein_codingdeleterious(0)probably_damaging(0.998)TCGA-FU-A3HZ-01Cervixcervical & endocervical cancerFemale<65I/IIChemotherapycisplatinCR
WDFY1SNVMissense_Mutationc.1186A>Cp.Thr396Prop.T396PQ8IWB7protein_codingdeleterious(0.02)benign(0.221)TCGA-G4-6304-01Colorectumcolon adenocarcinomaFemale>=65I/IIChemotherapyfluorouracilPD
WDFY1SNVMissense_Mutationnovelc.796N>Cp.Ile266Leup.I266LQ8IWB7protein_codingtolerated(0.76)benign(0.021)TCGA-A5-A2K5-01Endometriumuterine corpus endometrioid carcinomaFemale>=65I/IIUnknownUnknownSD
WDFY1SNVMissense_Mutationrs368104342c.1067G>Ap.Arg356Glnp.R356QQ8IWB7protein_codingtolerated(0.12)probably_damaging(0.992)TCGA-AX-A0J1-01Endometriumuterine corpus endometrioid carcinomaFemale>=65I/IIUnknownUnknownSD
WDFY1SNVMissense_Mutationnovelc.656C>Ap.Ser219Tyrp.S219YQ8IWB7protein_codingtolerated(1)possibly_damaging(0.857)TCGA-AX-A2HC-01Endometriumuterine corpus endometrioid carcinomaFemale<65III/IVChemotherapypaclitaxelPD
WDFY1SNVMissense_Mutationnovelc.242G>Tp.Arg81Ilep.R81IQ8IWB7protein_codingdeleterious(0.01)probably_damaging(0.986)TCGA-AX-A2HC-01Endometriumuterine corpus endometrioid carcinomaFemale<65III/IVChemotherapypaclitaxelPD
Page: 1 2 3 4 

Top

Related drugs of malignant transformation related genes

check buttonIdentification of chemicals and drugs interact with genes involved in malignant transfromation
(DGIdb 4.0)
Entrez IDSymbolCategoryInteraction TypesDrug Claim NameDrug NamePMIDs
Page: 1