
|
|||||
|
 | |
| |
| |
| |
| |
| |
|
Gene: WBSCR27 |
Gene summary for WBSCR27 |
| Gene information | Species | Human | Gene symbol | WBSCR27 | Gene ID | 155368 |
| Gene name | methyltransferase like 27 | |
| Gene Alias | WBSCR27 | |
| Cytomap | 7q11.23 | |
| Gene Type | protein-coding | GO ID | GO:0003674 | UniProtAcc | Q8N6F8 |
Top |
Malignant transformation analysis |
| Identification of the aberrant gene expression in precancerous and cancerous lesions by comparing the gene expression of stem-like cells in diseased tissues with normal stem cells |
| Entrez ID | Symbol | Replicates | Species | Organ | Tissue | Adj P-value | Log2FC | Malignancy |
| 155368 | WBSCR27 | P2T-E | Human | Esophagus | ESCC | 1.39e-06 | 1.90e-01 | 0.1177 |
| 155368 | WBSCR27 | P4T-E | Human | Esophagus | ESCC | 5.78e-25 | 6.32e-01 | 0.1323 |
| 155368 | WBSCR27 | P5T-E | Human | Esophagus | ESCC | 1.65e-04 | 1.23e-01 | 0.1327 |
| 155368 | WBSCR27 | P8T-E | Human | Esophagus | ESCC | 4.77e-05 | 1.16e-01 | 0.0889 |
| 155368 | WBSCR27 | P9T-E | Human | Esophagus | ESCC | 1.80e-06 | 1.72e-01 | 0.1131 |
| 155368 | WBSCR27 | P12T-E | Human | Esophagus | ESCC | 1.99e-29 | 5.46e-01 | 0.1122 |
| 155368 | WBSCR27 | P15T-E | Human | Esophagus | ESCC | 1.02e-19 | 5.05e-01 | 0.1149 |
| 155368 | WBSCR27 | P16T-E | Human | Esophagus | ESCC | 2.19e-11 | 2.80e-01 | 0.1153 |
| 155368 | WBSCR27 | P19T-E | Human | Esophagus | ESCC | 7.67e-03 | 4.46e-01 | 0.1662 |
| 155368 | WBSCR27 | P20T-E | Human | Esophagus | ESCC | 1.68e-10 | 1.30e-01 | 0.1124 |
| 155368 | WBSCR27 | P21T-E | Human | Esophagus | ESCC | 2.34e-24 | 5.56e-01 | 0.1617 |
| 155368 | WBSCR27 | P22T-E | Human | Esophagus | ESCC | 3.17e-14 | 2.78e-01 | 0.1236 |
| 155368 | WBSCR27 | P23T-E | Human | Esophagus | ESCC | 2.45e-06 | 1.61e-01 | 0.108 |
| 155368 | WBSCR27 | P26T-E | Human | Esophagus | ESCC | 5.23e-20 | 4.05e-01 | 0.1276 |
| 155368 | WBSCR27 | P27T-E | Human | Esophagus | ESCC | 1.83e-15 | 3.30e-01 | 0.1055 |
| 155368 | WBSCR27 | P28T-E | Human | Esophagus | ESCC | 1.80e-18 | 4.32e-01 | 0.1149 |
| 155368 | WBSCR27 | P30T-E | Human | Esophagus | ESCC | 1.93e-06 | 2.64e-01 | 0.137 |
| 155368 | WBSCR27 | P31T-E | Human | Esophagus | ESCC | 3.01e-14 | 3.20e-01 | 0.1251 |
| 155368 | WBSCR27 | P32T-E | Human | Esophagus | ESCC | 6.30e-11 | 2.73e-01 | 0.1666 |
| 155368 | WBSCR27 | P36T-E | Human | Esophagus | ESCC | 4.30e-02 | 1.52e-01 | 0.1187 |
| Page: 1 2 3 |
| Tissue | Expression Dynamics | Abbreviation |
| Esophagus | 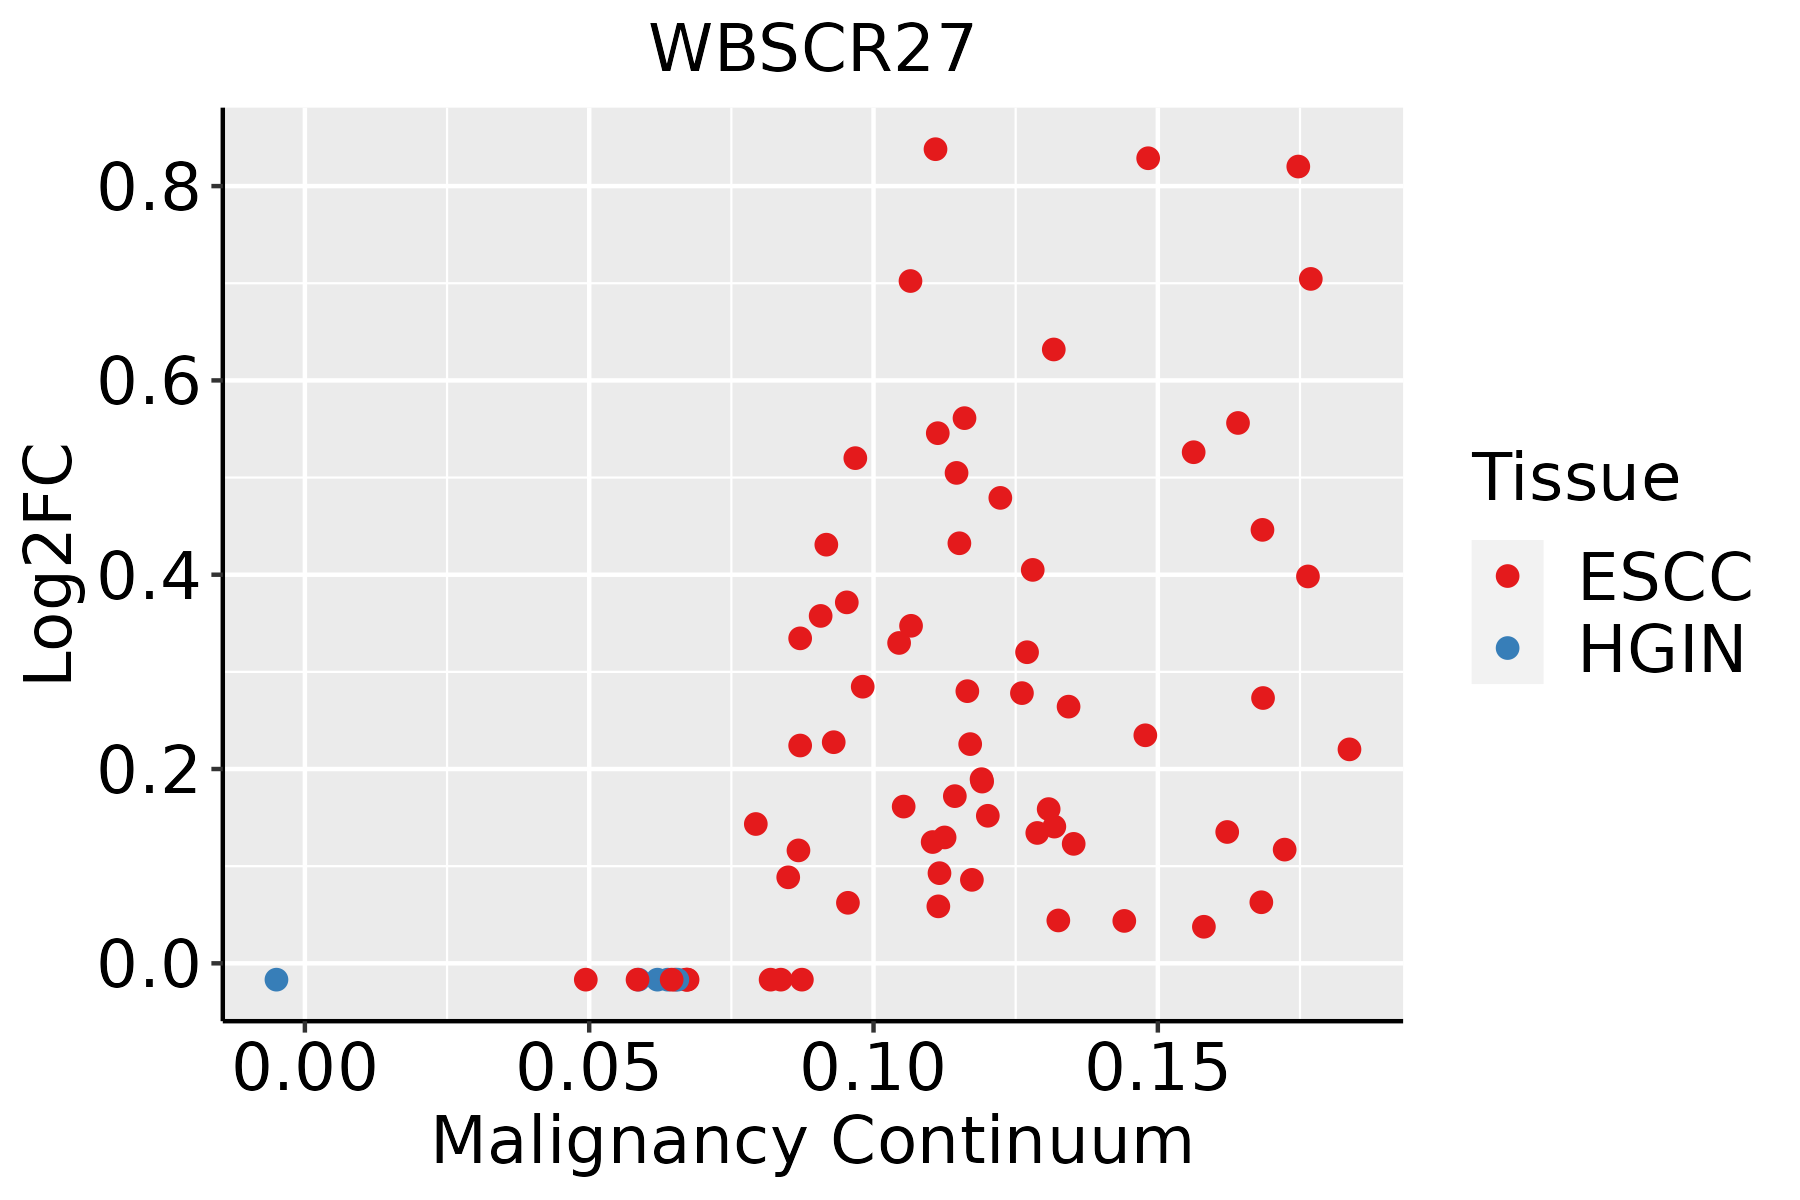 | ESCC: Esophageal squamous cell carcinoma |
| HGIN: High-grade intraepithelial neoplasias | ||
| LGIN: Low-grade intraepithelial neoplasias |
| ∗log2FC in expression of this searched gene in stem-like cells from each diseased tissue sample relative to stem-like cells in normal samples in each tissue plotted against the malignancy continuum. Samples are colored based on if they are from different disease stage. |
Top |
Malignant transformation related pathway analysis |
| Find out the enriched GO biological processes and KEGG pathways involved in transition from healthy to precancer to cancer |
| Tissue | Disease Stage | Enriched GO biological Processes |
| Colorectum | AD |  |
| Colorectum | SER |  |
| Colorectum | MSS |  |
| Colorectum | MSI-H |  |
| Colorectum | FAP |  |
| ∗Top 15 enriched GO BP terms are showed in the bar plot of each disease state in each tissue. Each row represents a significant GO biological process which is colored according to the -log10(p.adjust). |
| Page: 1 2 3 4 5 6 7 8 9 |
| GO ID | Tissue | Disease Stage | Description | Gene Ratio | Bg Ratio | pvalue | p.adjust | Count |
| Page: 1 |
| Pathway ID | Tissue | Disease Stage | Description | Gene Ratio | Bg Ratio | pvalue | p.adjust | qvalue | Count |
| Page: 1 |
Top |
Cell-cell communication analysis |
| Identification of potential cell-cell interactions between two cell types and their ligand-receptor pairs for different disease states |
| Ligand | Receptor | LRpair | Pathway | Tissue | Disease Stage |
| Page: 1 |
Top |
Single-cell gene regulatory network inference analysis |
| Find out the significant the regulons (TFs) and the target genes of each regulon across cell types for different disease states |
| TF | Cell Type | Tissue | Disease Stage | Target Gene | RSS | Regulon Activity |
| ∗The dot plots of a searched regulon are shown for all cell subpopulations in each disease state of each tissue based on the regulon specific score inferred using pySCENIC and by calculating the average expression. |
| Page: 1 |
Top |
Somatic mutation of malignant transformation related genes |
| Annotation of somatic variants for genes involved in malignant transformation |
| Hugo Symbol | Variant Class | Variant Classification | dbSNP RS | HGVSc | HGVSp | HGVSp Short | SWISSPROT | BIOTYPE | SIFT | PolyPhen | Tumor Sample Barcode | Tissue | Histology | Sex | Age | Stage | Therapy Types | Drugs | Outcome |
| WBSCR27 | SNV | Missense_Mutation | c.244N>C | p.Ala82Pro | p.A82P | Q8N6F8 | protein_coding | deleterious(0) | probably_damaging(0.997) | TCGA-A7-A0DA-01 | Breast | breast invasive carcinoma | Female | <65 | I/II | Chemotherapy | adriamycin | SD | |
| WBSCR27 | SNV | Missense_Mutation | novel | c.124G>A | p.Asp42Asn | p.D42N | Q8N6F8 | protein_coding | deleterious(0) | possibly_damaging(0.873) | TCGA-A7-A56D-01 | Breast | breast invasive carcinoma | Female | >=65 | I/II | Hormone Therapy | arimidex | SD |
| WBSCR27 | SNV | Missense_Mutation | c.626N>T | p.Ser209Ile | p.S209I | Q8N6F8 | protein_coding | deleterious_low_confidence(0.01) | benign(0.28) | TCGA-BH-A18T-01 | Breast | breast invasive carcinoma | Female | >=65 | I/II | Unknown | Unknown | PD | |
| WBSCR27 | SNV | Missense_Mutation | rs779071025 | c.607N>T | p.Arg203Cys | p.R203C | Q8N6F8 | protein_coding | deleterious(0) | benign(0) | TCGA-BH-A1F0-01 | Breast | breast invasive carcinoma | Female | >=65 | I/II | Unknown | Unknown | PD |
| WBSCR27 | insertion | Frame_Shift_Ins | novel | c.662_663insATAT | p.Leu222TyrfsTer37 | p.L222Yfs*37 | Q8N6F8 | protein_coding | TCGA-AN-A0AM-01 | Breast | breast invasive carcinoma | Female | <65 | I/II | Unknown | Unknown | SD | ||
| WBSCR27 | insertion | Frame_Shift_Ins | novel | c.661_662insACGCTGTTTTCTGTATATGGGTTTACCCTCCAACC | p.Ser221TyrfsTer35 | p.S221Yfs*35 | Q8N6F8 | protein_coding | TCGA-AN-A0AM-01 | Breast | breast invasive carcinoma | Female | <65 | I/II | Unknown | Unknown | SD | ||
| WBSCR27 | insertion | Frame_Shift_Ins | novel | c.517_518insTACGCTGTTTTCTGTATATGGGTTT | p.Asn173IlefsTer93 | p.N173Ifs*93 | Q8N6F8 | protein_coding | TCGA-BH-A0HF-01 | Breast | breast invasive carcinoma | Female | >=65 | I/II | Hormone Therapy | arimidex | SD | ||
| WBSCR27 | SNV | Missense_Mutation | c.590N>C | p.Val197Ala | p.V197A | Q8N6F8 | protein_coding | tolerated(0.45) | benign(0.001) | TCGA-A6-6781-01 | Colorectum | colon adenocarcinoma | Male | <65 | III/IV | Chemotherapy | oxaliplatin | SD | |
| WBSCR27 | SNV | Missense_Mutation | c.707N>G | p.Glu236Gly | p.E236G | Q8N6F8 | protein_coding | tolerated_low_confidence(0.2) | benign(0) | TCGA-AD-A5EJ-01 | Colorectum | colon adenocarcinoma | Female | >=65 | I/II | Unknown | Unknown | SD | |
| WBSCR27 | SNV | Missense_Mutation | rs781956542 | c.15N>T | p.Glu5Asp | p.E5D | Q8N6F8 | protein_coding | tolerated(0.15) | benign(0.437) | TCGA-CK-5916-01 | Colorectum | colon adenocarcinoma | Female | >=65 | I/II | Unknown | Unknown | PD |
| Page: 1 2 3 |
Top |
Related drugs of malignant transformation related genes |
| Identification of chemicals and drugs interact with genes involved in malignant transfromation |
| (DGIdb 4.0) |
| Entrez ID | Symbol | Category | Interaction Types | Drug Claim Name | Drug Name | PMIDs |
| Page: 1 |

Copyright 2023-Present -The University of Texas Health Science Center at Houston |