
|
|||||
|
 | |
| |
| |
| |
| |
| |
|
Gene: WBP1L |
Gene summary for WBP1L |
| Gene information | Species | Human | Gene symbol | WBP1L | Gene ID | 54838 |
| Gene name | WW domain binding protein 1 like | |
| Gene Alias | C10orf26 | |
| Cytomap | 10q24.32 | |
| Gene Type | protein-coding | GO ID | GO:0005575 | UniProtAcc | Q9NX94 |
Top |
Malignant transformation analysis |
| Identification of the aberrant gene expression in precancerous and cancerous lesions by comparing the gene expression of stem-like cells in diseased tissues with normal stem cells |
| Entrez ID | Symbol | Replicates | Species | Organ | Tissue | Adj P-value | Log2FC | Malignancy |
| 54838 | WBP1L | NAFLD1 | Human | Liver | NAFLD | 5.09e-03 | 4.58e-01 | -0.04 |
| 54838 | WBP1L | HCC1_Meng | Human | Liver | HCC | 8.60e-11 | -6.73e-02 | 0.0246 |
| 54838 | WBP1L | HCC2_Meng | Human | Liver | HCC | 3.85e-11 | -1.48e-03 | 0.0107 |
| 54838 | WBP1L | HCC1 | Human | Liver | HCC | 1.67e-02 | 3.35e+00 | 0.5336 |
| 54838 | WBP1L | HCC2 | Human | Liver | HCC | 1.40e-11 | 3.88e+00 | 0.5341 |
| 54838 | WBP1L | S015 | Human | Liver | HCC | 8.44e-08 | 4.58e-01 | 0.2375 |
| 54838 | WBP1L | S016 | Human | Liver | HCC | 2.73e-06 | 3.36e-01 | 0.2243 |
| 54838 | WBP1L | S028 | Human | Liver | HCC | 2.74e-05 | 3.39e-01 | 0.2503 |
| 54838 | WBP1L | C04 | Human | Oral cavity | OSCC | 1.59e-05 | 3.61e-01 | 0.2633 |
| 54838 | WBP1L | C21 | Human | Oral cavity | OSCC | 3.69e-07 | 3.21e-01 | 0.2678 |
| 54838 | WBP1L | C30 | Human | Oral cavity | OSCC | 8.88e-30 | 1.21e+00 | 0.3055 |
| 54838 | WBP1L | C38 | Human | Oral cavity | OSCC | 1.99e-02 | 5.58e-01 | 0.172 |
| 54838 | WBP1L | C43 | Human | Oral cavity | OSCC | 2.96e-06 | 7.58e-02 | 0.1704 |
| 54838 | WBP1L | C46 | Human | Oral cavity | OSCC | 2.70e-02 | 8.70e-02 | 0.1673 |
| 54838 | WBP1L | C51 | Human | Oral cavity | OSCC | 6.63e-05 | 3.24e-01 | 0.2674 |
| 54838 | WBP1L | C57 | Human | Oral cavity | OSCC | 7.52e-05 | 2.51e-01 | 0.1679 |
| 54838 | WBP1L | C07 | Human | Oral cavity | OSCC | 1.91e-02 | 5.31e-01 | 0.2491 |
| 54838 | WBP1L | C08 | Human | Oral cavity | OSCC | 2.57e-17 | 1.30e-01 | 0.1919 |
| 54838 | WBP1L | EOLP-1 | Human | Oral cavity | EOLP | 2.81e-03 | 1.60e-01 | -0.0202 |
| 54838 | WBP1L | NEOLP-1 | Human | Oral cavity | NEOLP | 1.90e-02 | 2.88e-01 | -0.0194 |
| Page: 1 2 3 |
| Tissue | Expression Dynamics | Abbreviation |
| Liver |  | HCC: Hepatocellular carcinoma |
| NAFLD: Non-alcoholic fatty liver disease | ||
| Oral Cavity | 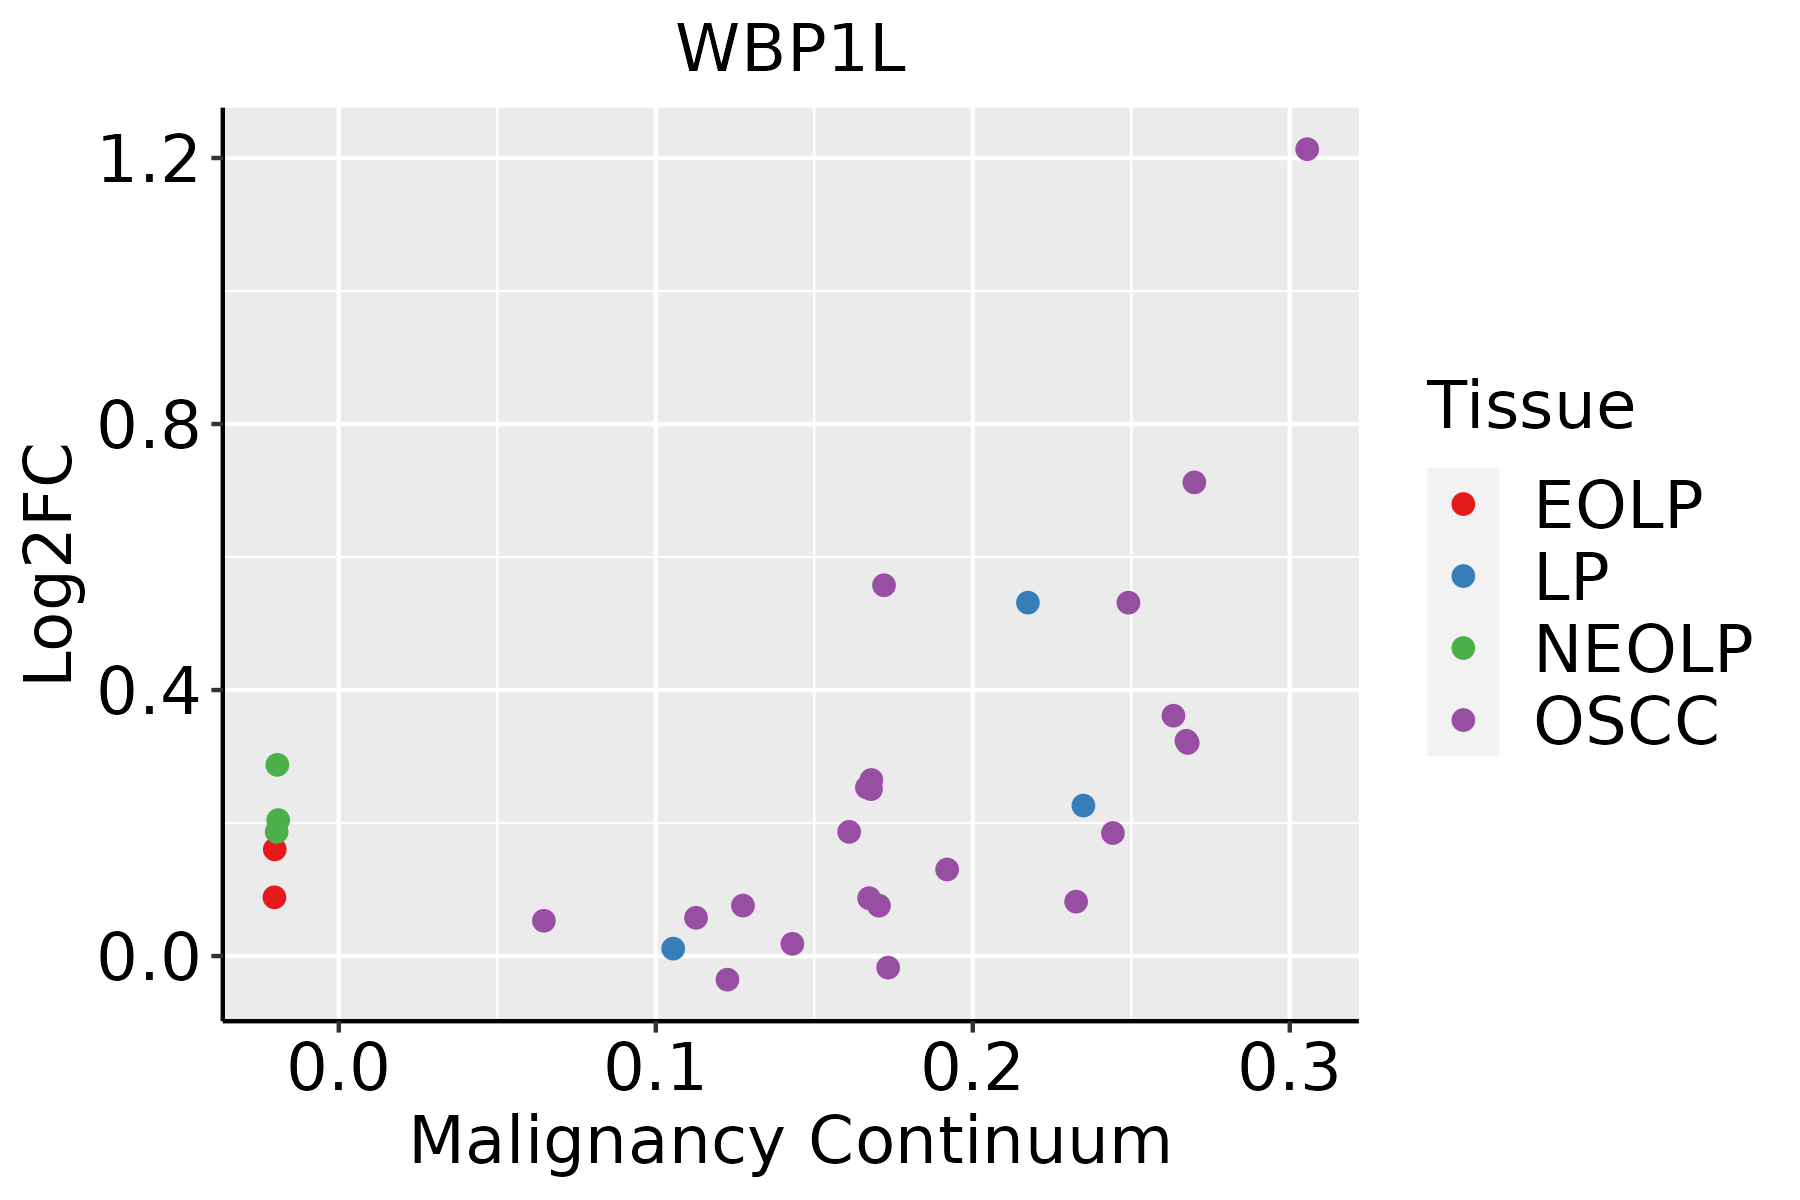 | EOLP: Erosive Oral lichen planus |
| LP: leukoplakia | ||
| NEOLP: Non-erosive oral lichen planus | ||
| OSCC: Oral squamous cell carcinoma | ||
| Prostate |  | BPH: Benign Prostatic Hyperplasia |
| Thyroid | 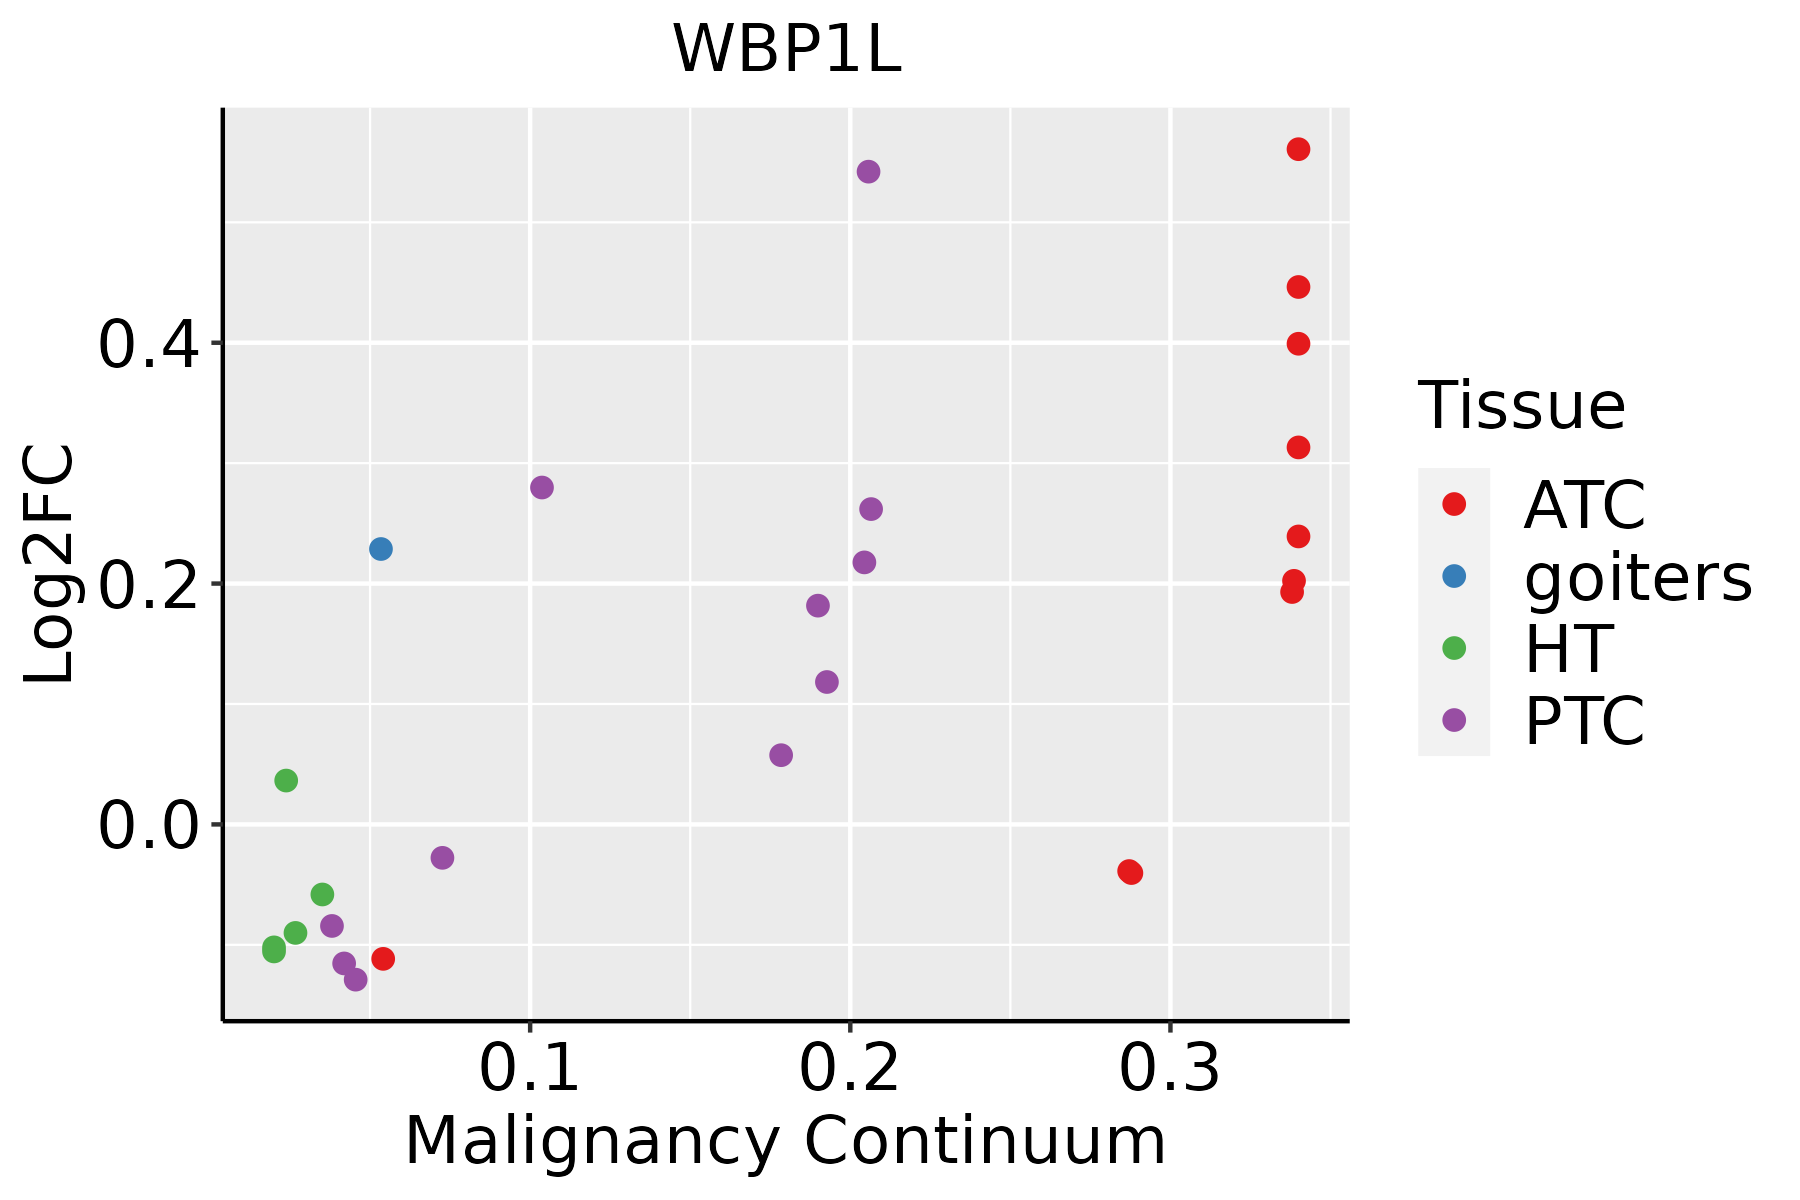 | ATC: Anaplastic thyroid cancer |
| HT: Hashimoto's thyroiditis | ||
| PTC: Papillary thyroid cancer |
| ∗log2FC in expression of this searched gene in stem-like cells from each diseased tissue sample relative to stem-like cells in normal samples in each tissue plotted against the malignancy continuum. Samples are colored based on if they are from different disease stage. |
Top |
Malignant transformation related pathway analysis |
| Find out the enriched GO biological processes and KEGG pathways involved in transition from healthy to precancer to cancer |
| Tissue | Disease Stage | Enriched GO biological Processes |
| Colorectum | AD |  |
| Colorectum | SER |  |
| Colorectum | MSS |  |
| Colorectum | MSI-H |  |
| Colorectum | FAP |  |
| ∗Top 15 enriched GO BP terms are showed in the bar plot of each disease state in each tissue. Each row represents a significant GO biological process which is colored according to the -log10(p.adjust). |
| Page: 1 2 3 4 5 6 7 8 9 |
| GO ID | Tissue | Disease Stage | Description | Gene Ratio | Bg Ratio | pvalue | p.adjust | Count |
| Page: 1 |
| Pathway ID | Tissue | Disease Stage | Description | Gene Ratio | Bg Ratio | pvalue | p.adjust | qvalue | Count |
| Page: 1 |
Top |
Cell-cell communication analysis |
| Identification of potential cell-cell interactions between two cell types and their ligand-receptor pairs for different disease states |
| Ligand | Receptor | LRpair | Pathway | Tissue | Disease Stage |
| Page: 1 |
Top |
Single-cell gene regulatory network inference analysis |
| Find out the significant the regulons (TFs) and the target genes of each regulon across cell types for different disease states |
| TF | Cell Type | Tissue | Disease Stage | Target Gene | RSS | Regulon Activity |
| ∗The dot plots of a searched regulon are shown for all cell subpopulations in each disease state of each tissue based on the regulon specific score inferred using pySCENIC and by calculating the average expression. |
| Page: 1 |
Top |
Somatic mutation of malignant transformation related genes |
| Annotation of somatic variants for genes involved in malignant transformation |
| Hugo Symbol | Variant Class | Variant Classification | dbSNP RS | HGVSc | HGVSp | HGVSp Short | SWISSPROT | BIOTYPE | SIFT | PolyPhen | Tumor Sample Barcode | Tissue | Histology | Sex | Age | Stage | Therapy Types | Drugs | Outcome |
| WBP1L | SNV | Missense_Mutation | c.97N>A | p.Glu33Lys | p.E33K | Q9NX94 | protein_coding | tolerated(0.19) | probably_damaging(0.995) | TCGA-AN-A0AR-01 | Breast | breast invasive carcinoma | Female | <65 | I/II | Unknown | Unknown | SD | |
| WBP1L | insertion | In_Frame_Ins | novel | c.934_935insTTTTTGCCAAACTATTTACTA | p.Pro312delinsLeuPheAlaLysLeuPheThrThr | p.P312delinsLFAKLFTT | Q9NX94 | protein_coding | TCGA-BH-A0B8-01 | Breast | breast invasive carcinoma | Female | <65 | I/II | Hormone Therapy | arimidex | SD | ||
| WBP1L | SNV | Missense_Mutation | rs758636598 | c.838C>T | p.Arg280Trp | p.R280W | Q9NX94 | protein_coding | deleterious(0) | probably_damaging(0.943) | TCGA-2W-A8YY-01 | Cervix | cervical & endocervical cancer | Female | <65 | I/II | Chemotherapy | cisplatin | CR |
| WBP1L | SNV | Missense_Mutation | novel | c.595G>A | p.Asp199Asn | p.D199N | Q9NX94 | protein_coding | deleterious(0.04) | benign(0.003) | TCGA-VS-A94Z-01 | Cervix | cervical & endocervical cancer | Female | <65 | I/II | Chemotherapy | cisplatin | CR |
| WBP1L | SNV | Missense_Mutation | c.166N>C | p.Cys56Arg | p.C56R | Q9NX94 | protein_coding | deleterious(0.03) | benign(0.178) | TCGA-A6-5665-01 | Colorectum | colon adenocarcinoma | Female | >=65 | I/II | Unknown | Unknown | PD | |
| WBP1L | SNV | Missense_Mutation | c.457N>A | p.Leu153Met | p.L153M | Q9NX94 | protein_coding | tolerated(0.2) | benign(0.098) | TCGA-AA-3955-01 | Colorectum | colon adenocarcinoma | Male | <65 | III/IV | Chemotherapy | capecitabine | CR | |
| WBP1L | SNV | Missense_Mutation | novel | c.496N>T | p.Pro166Ser | p.P166S | Q9NX94 | protein_coding | tolerated(0.28) | benign(0.003) | TCGA-AA-3984-01 | Colorectum | colon adenocarcinoma | Female | <65 | I/II | Unknown | Unknown | SD |
| WBP1L | SNV | Missense_Mutation | rs201482384 | c.931N>T | p.Arg311Trp | p.R311W | Q9NX94 | protein_coding | deleterious(0.05) | benign(0.026) | TCGA-AA-A01R-01 | Colorectum | colon adenocarcinoma | Male | <65 | III/IV | Chemotherapy | 5-fluorouracil | PD |
| WBP1L | insertion | Frame_Shift_Ins | novel | c.822_823insGT | p.Asn279AlafsTer68 | p.N279Afs*68 | Q9NX94 | protein_coding | TCGA-A6-5665-01 | Colorectum | colon adenocarcinoma | Female | >=65 | I/II | Unknown | Unknown | PD | ||
| WBP1L | SNV | Missense_Mutation | novel | c.853N>A | p.Asp285Asn | p.D285N | Q9NX94 | protein_coding | tolerated(0.11) | benign(0.116) | TCGA-A5-A0G1-01 | Endometrium | uterine corpus endometrioid carcinoma | Female | >=65 | I/II | Unknown | Unknown | SD |
| Page: 1 2 3 |
Top |
Related drugs of malignant transformation related genes |
| Identification of chemicals and drugs interact with genes involved in malignant transfromation |
| (DGIdb 4.0) |
| Entrez ID | Symbol | Category | Interaction Types | Drug Claim Name | Drug Name | PMIDs |
| Page: 1 |

Copyright 2023-Present -The University of Texas Health Science Center at Houston |