
|
|||||
|
 | |
| |
| |
| |
| |
| |
|
Gene: WBP11 |
Gene summary for WBP11 |
| Gene information | Species | Human | Gene symbol | WBP11 | Gene ID | 51729 |
| Gene name | WW domain binding protein 11 | |
| Gene Alias | BUG13 | |
| Cytomap | 12p12.3 | |
| Gene Type | protein-coding | GO ID | GO:0000375 | UniProtAcc | A0A024RAW9 |
Top |
Malignant transformation analysis |
| Identification of the aberrant gene expression in precancerous and cancerous lesions by comparing the gene expression of stem-like cells in diseased tissues with normal stem cells |
| Entrez ID | Symbol | Replicates | Species | Organ | Tissue | Adj P-value | Log2FC | Malignancy |
| 51729 | WBP11 | HTA11_78_2000001011 | Human | Colorectum | AD | 7.67e-06 | 3.77e-01 | -0.1088 |
| 51729 | WBP11 | HTA11_347_2000001011 | Human | Colorectum | AD | 1.78e-08 | 3.47e-01 | -0.1954 |
| 51729 | WBP11 | HTA11_99999970781_79442 | Human | Colorectum | MSS | 1.02e-08 | 4.59e-01 | 0.294 |
| 51729 | WBP11 | HTA11_99999965062_69753 | Human | Colorectum | MSI-H | 1.74e-02 | 9.99e-01 | 0.3487 |
| 51729 | WBP11 | HTA11_99999965104_69814 | Human | Colorectum | MSS | 4.12e-10 | 5.80e-01 | 0.281 |
| 51729 | WBP11 | HTA11_99999971662_82457 | Human | Colorectum | MSS | 7.32e-08 | 3.67e-01 | 0.3859 |
| 51729 | WBP11 | LZE2T | Human | Esophagus | ESCC | 4.67e-04 | 5.05e-01 | 0.082 |
| 51729 | WBP11 | LZE4T | Human | Esophagus | ESCC | 1.10e-12 | 3.01e-01 | 0.0811 |
| 51729 | WBP11 | LZE5T | Human | Esophagus | ESCC | 4.75e-02 | 1.88e-01 | 0.0514 |
| 51729 | WBP11 | LZE7T | Human | Esophagus | ESCC | 1.75e-08 | 6.14e-01 | 0.0667 |
| 51729 | WBP11 | LZE8T | Human | Esophagus | ESCC | 5.75e-12 | 5.35e-01 | 0.067 |
| 51729 | WBP11 | LZE20T | Human | Esophagus | ESCC | 1.69e-05 | 2.80e-01 | 0.0662 |
| 51729 | WBP11 | LZE22D1 | Human | Esophagus | HGIN | 5.08e-05 | 7.18e-02 | 0.0595 |
| 51729 | WBP11 | LZE22T | Human | Esophagus | ESCC | 9.90e-05 | 4.14e-01 | 0.068 |
| 51729 | WBP11 | LZE24T | Human | Esophagus | ESCC | 7.15e-24 | 6.41e-01 | 0.0596 |
| 51729 | WBP11 | LZE21T | Human | Esophagus | ESCC | 4.11e-08 | 3.61e-01 | 0.0655 |
| 51729 | WBP11 | LZE6T | Human | Esophagus | ESCC | 2.33e-05 | 2.07e-01 | 0.0845 |
| 51729 | WBP11 | P1T-E | Human | Esophagus | ESCC | 9.68e-07 | 4.37e-01 | 0.0875 |
| 51729 | WBP11 | P2T-E | Human | Esophagus | ESCC | 7.80e-50 | 9.97e-01 | 0.1177 |
| 51729 | WBP11 | P4T-E | Human | Esophagus | ESCC | 6.13e-36 | 9.00e-01 | 0.1323 |
| Page: 1 2 3 4 5 6 7 |
| Tissue | Expression Dynamics | Abbreviation |
| Colorectum (GSE201348) |  | FAP: Familial adenomatous polyposis |
| CRC: Colorectal cancer | ||
| Colorectum (HTA11) |  | AD: Adenomas |
| SER: Sessile serrated lesions | ||
| MSI-H: Microsatellite-high colorectal cancer | ||
| MSS: Microsatellite stable colorectal cancer | ||
| Esophagus |  | ESCC: Esophageal squamous cell carcinoma |
| HGIN: High-grade intraepithelial neoplasias | ||
| LGIN: Low-grade intraepithelial neoplasias | ||
| Liver | 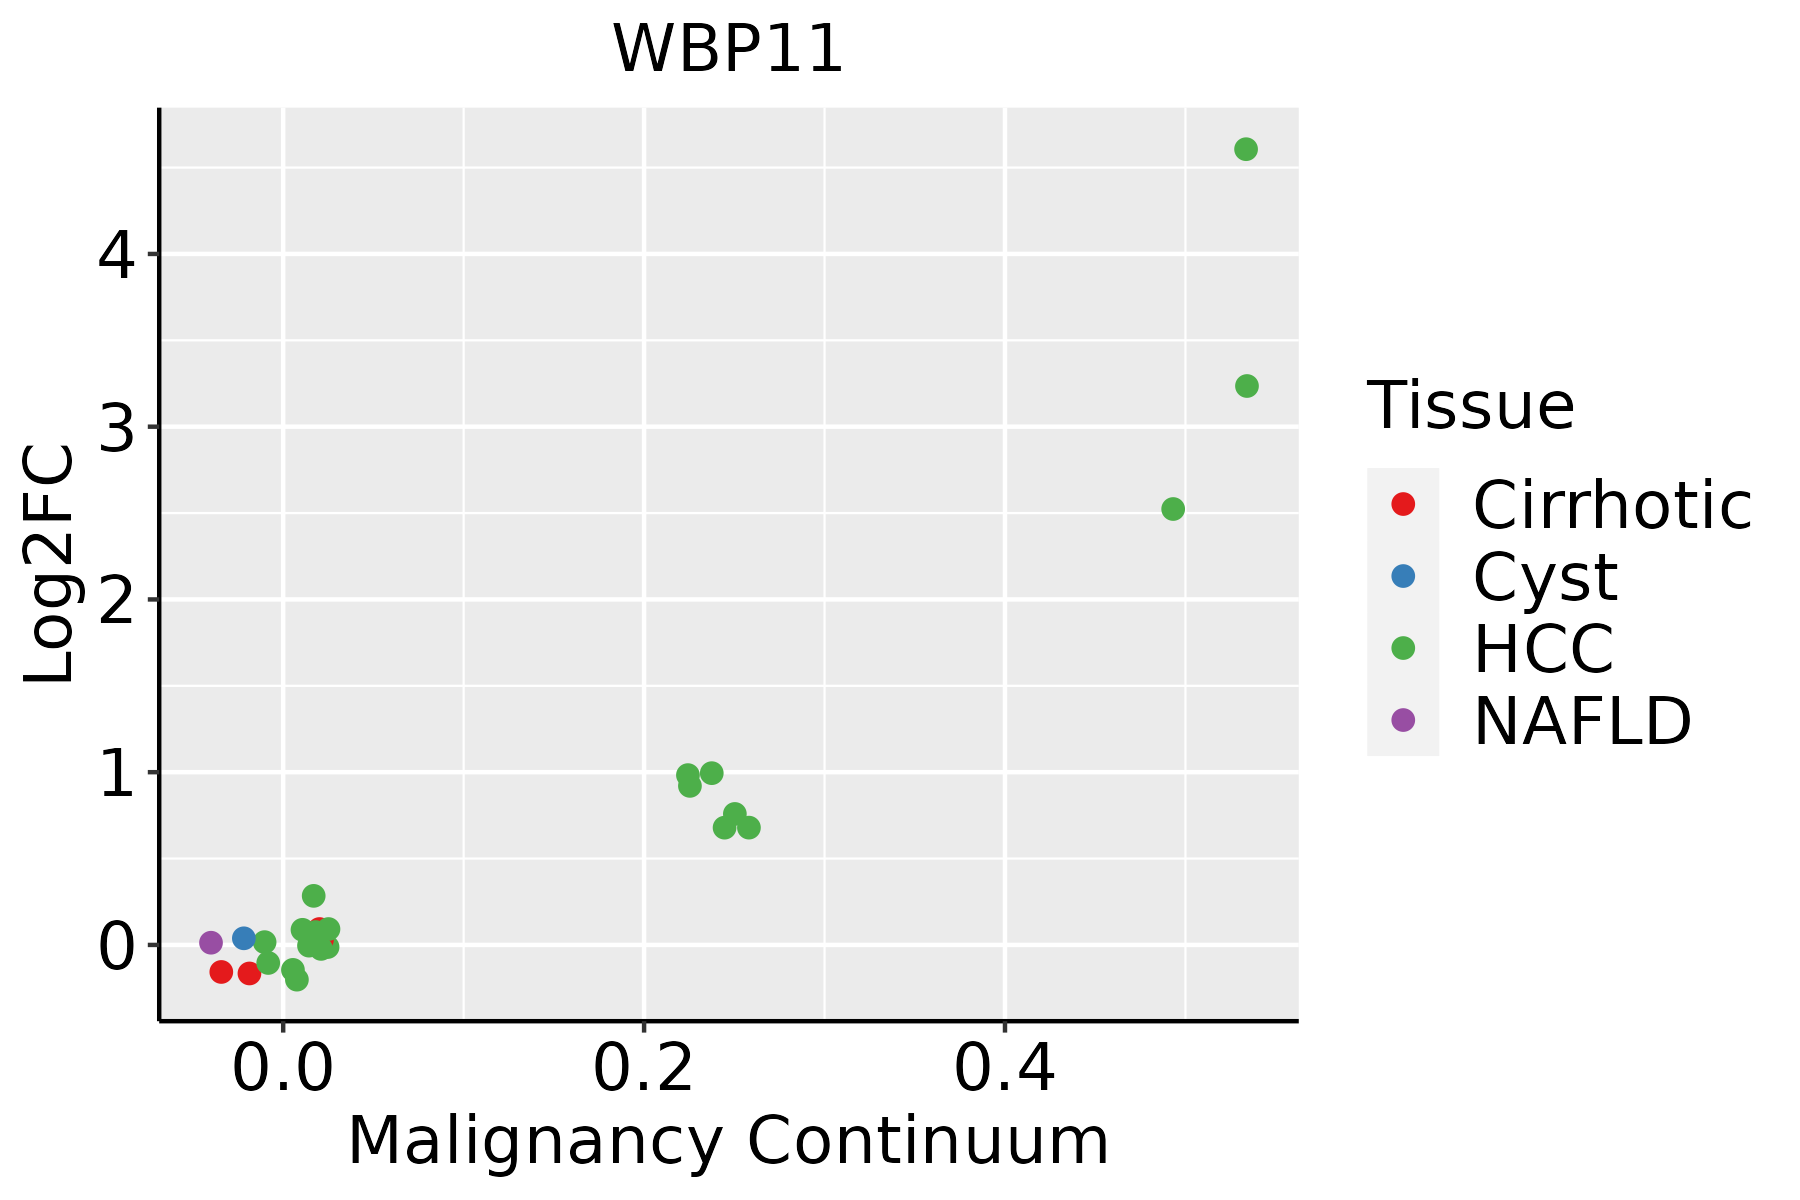 | HCC: Hepatocellular carcinoma |
| NAFLD: Non-alcoholic fatty liver disease | ||
| Oral Cavity | 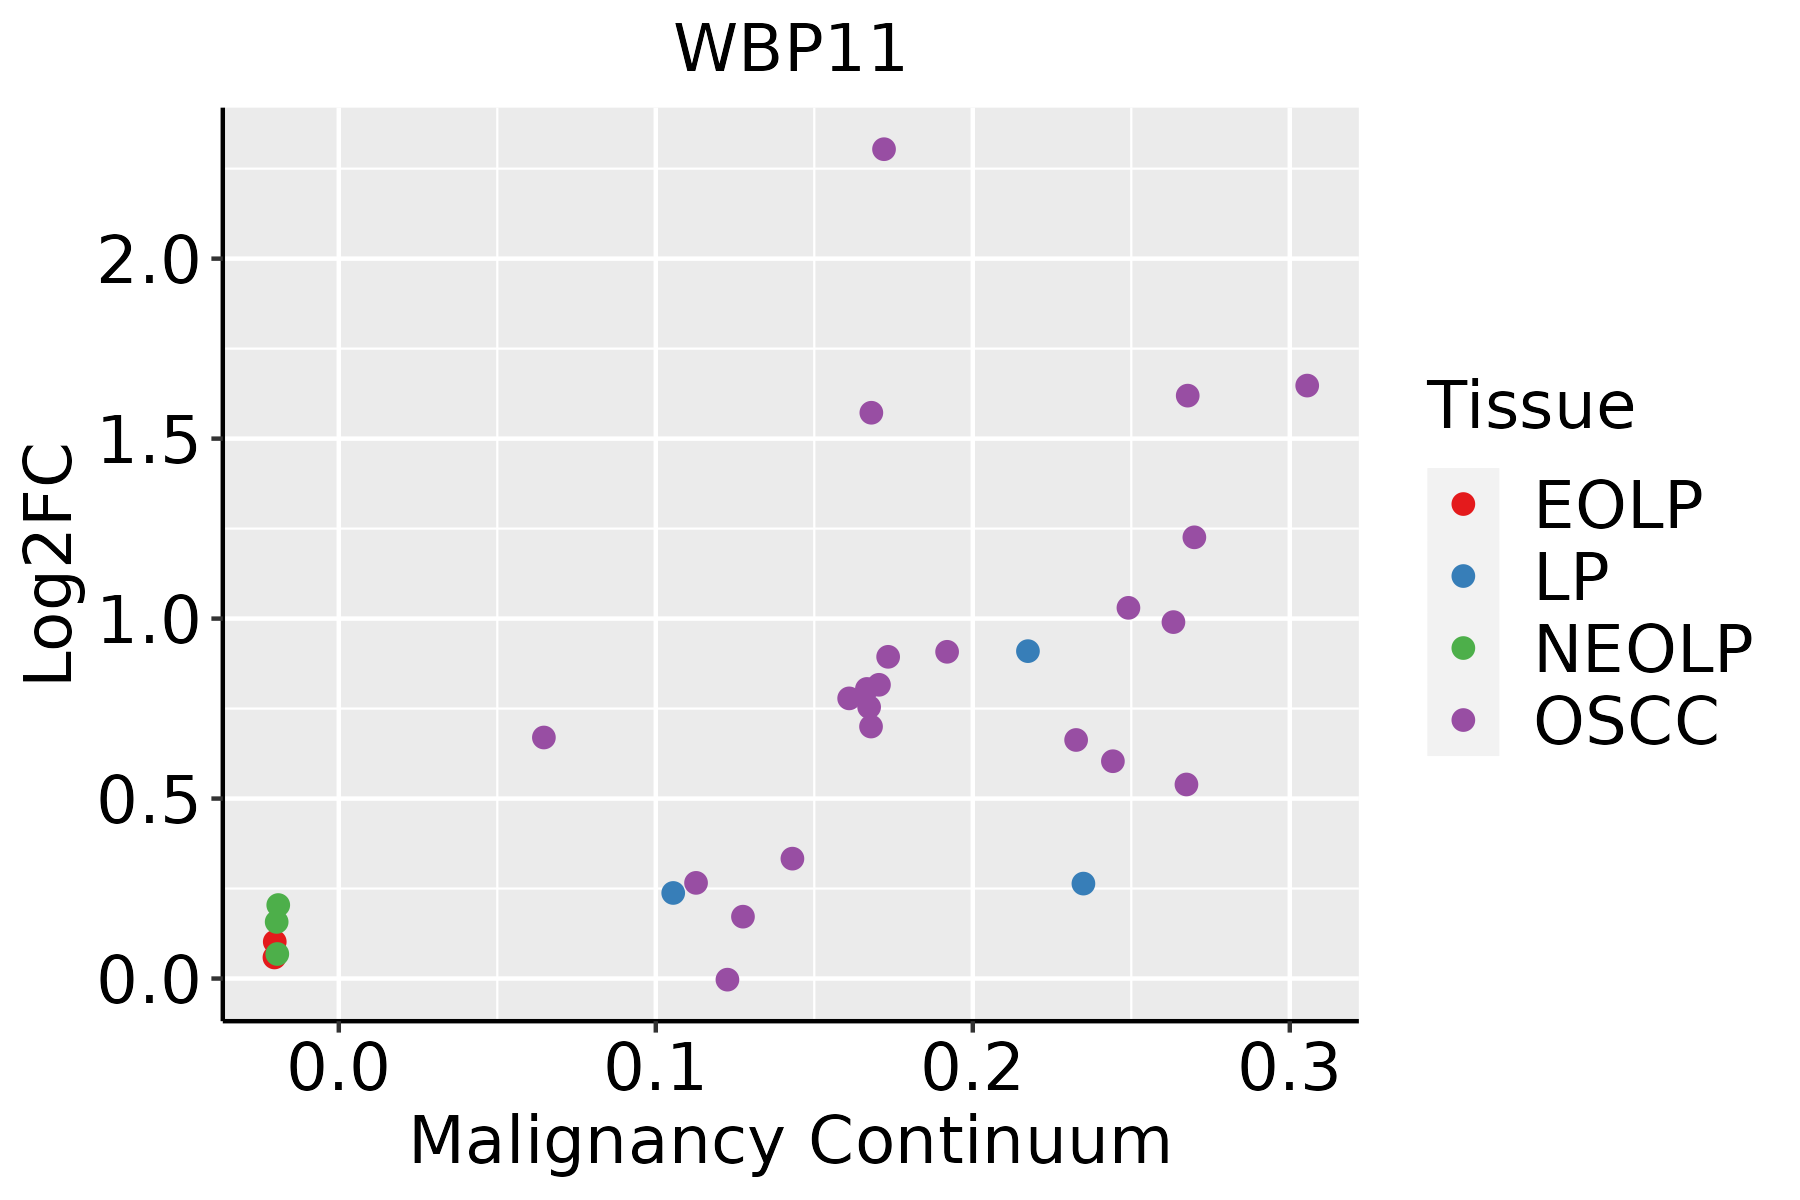 | EOLP: Erosive Oral lichen planus |
| LP: leukoplakia | ||
| NEOLP: Non-erosive oral lichen planus | ||
| OSCC: Oral squamous cell carcinoma | ||
| Skin | 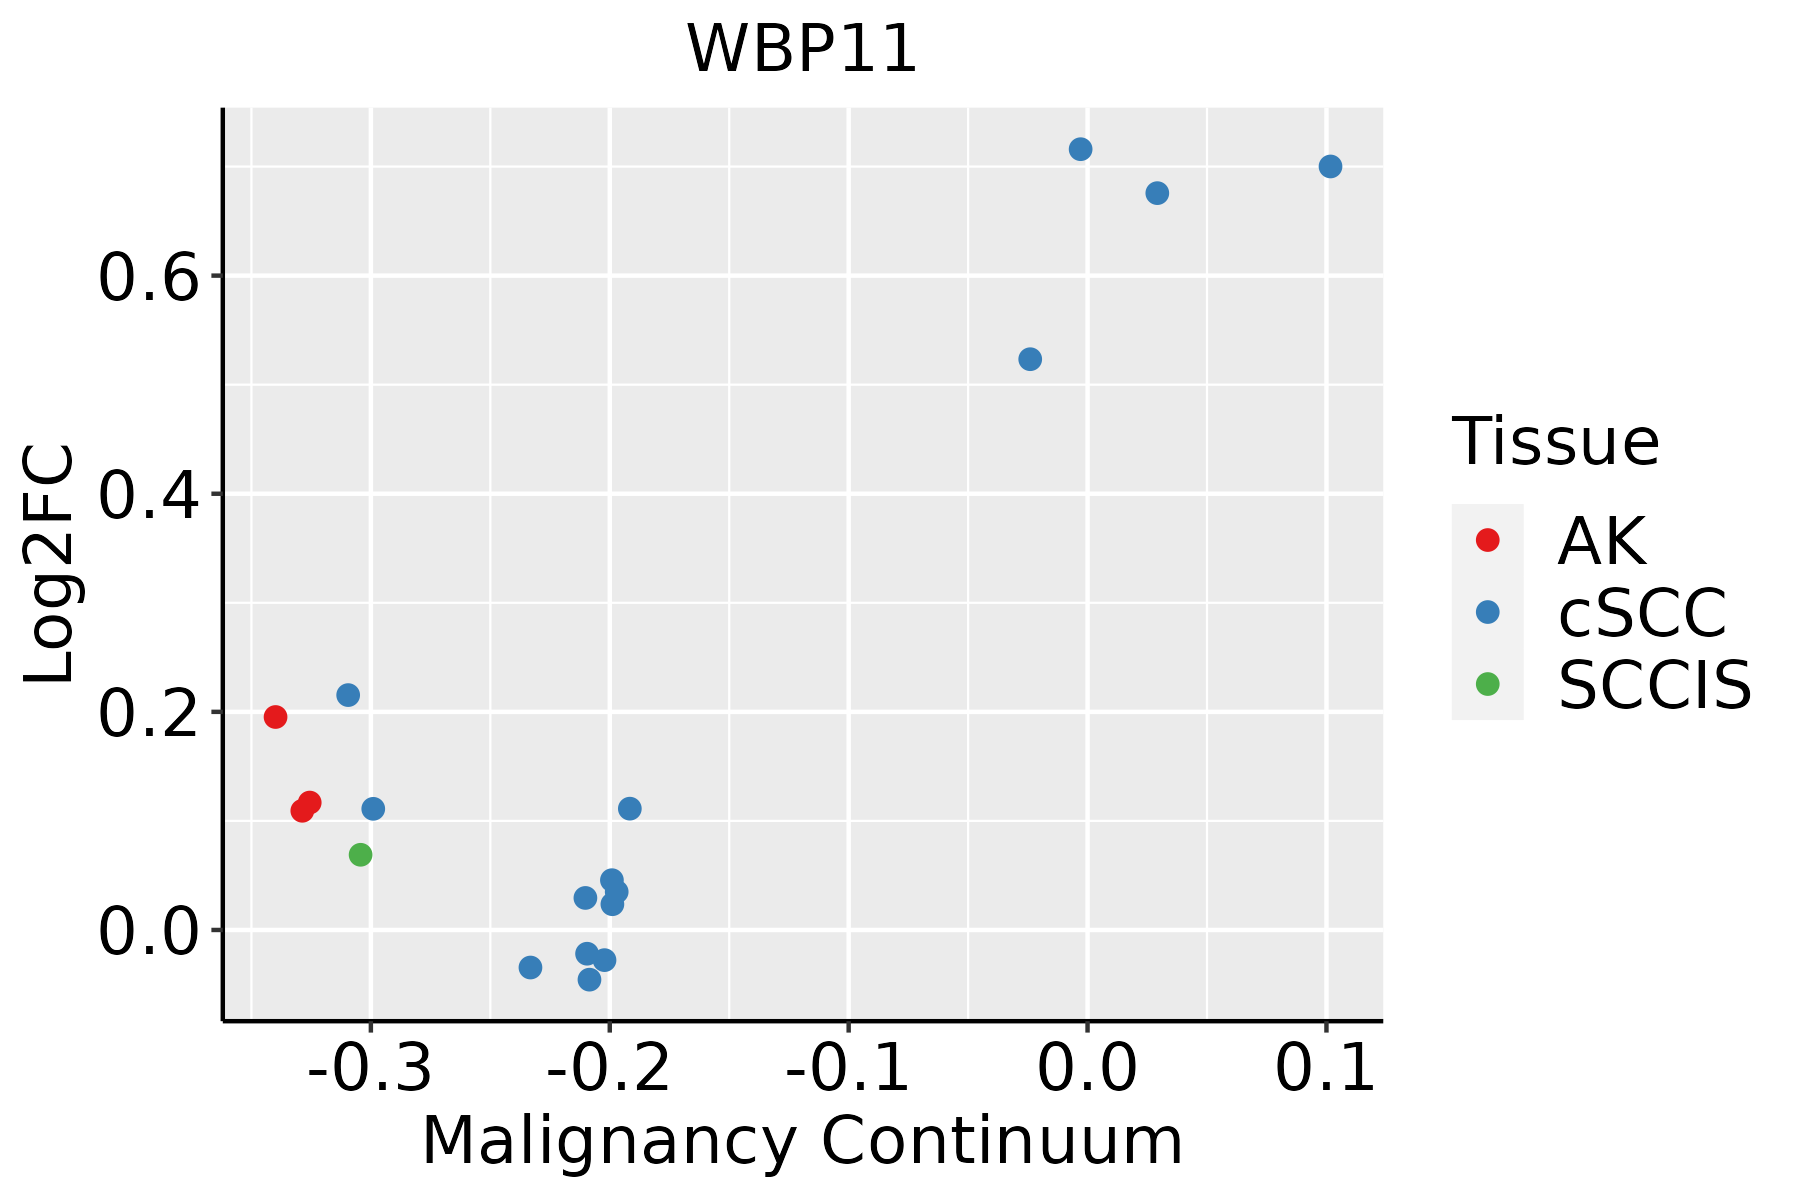 | AK: Actinic keratosis |
| cSCC: Cutaneous squamous cell carcinoma | ||
| SCCIS:squamous cell carcinoma in situ | ||
| Thyroid |  | ATC: Anaplastic thyroid cancer |
| HT: Hashimoto's thyroiditis | ||
| PTC: Papillary thyroid cancer |
| ∗log2FC in expression of this searched gene in stem-like cells from each diseased tissue sample relative to stem-like cells in normal samples in each tissue plotted against the malignancy continuum. Samples are colored based on if they are from different disease stage. |
Top |
Malignant transformation related pathway analysis |
| Find out the enriched GO biological processes and KEGG pathways involved in transition from healthy to precancer to cancer |
| Tissue | Disease Stage | Enriched GO biological Processes |
| Colorectum | AD |  |
| Colorectum | SER |  |
| Colorectum | MSS |  |
| Colorectum | MSI-H |  |
| Colorectum | FAP |  |
| ∗Top 15 enriched GO BP terms are showed in the bar plot of each disease state in each tissue. Each row represents a significant GO biological process which is colored according to the -log10(p.adjust). |
| Page: 1 2 3 4 5 6 7 8 9 |
| GO ID | Tissue | Disease Stage | Description | Gene Ratio | Bg Ratio | pvalue | p.adjust | Count |
| GO:0008380 | Colorectum | AD | RNA splicing | 169/3918 | 434/18723 | 3.59e-18 | 2.04e-15 | 169 |
| GO:0000377 | Colorectum | AD | RNA splicing, via transesterification reactions with bulged adenosine as nucleophile | 130/3918 | 320/18723 | 5.88e-16 | 2.16e-13 | 130 |
| GO:0000398 | Colorectum | AD | mRNA splicing, via spliceosome | 130/3918 | 320/18723 | 5.88e-16 | 2.16e-13 | 130 |
| GO:0000375 | Colorectum | AD | RNA splicing, via transesterification reactions | 131/3918 | 324/18723 | 7.11e-16 | 2.22e-13 | 131 |
| GO:0022613 | Colorectum | AD | ribonucleoprotein complex biogenesis | 151/3918 | 463/18723 | 1.96e-09 | 1.39e-07 | 151 |
| GO:0042254 | Colorectum | AD | ribosome biogenesis | 84/3918 | 299/18723 | 1.82e-03 | 1.50e-02 | 84 |
| GO:00083802 | Colorectum | MSS | RNA splicing | 159/3467 | 434/18723 | 1.75e-19 | 1.22e-16 | 159 |
| GO:00003772 | Colorectum | MSS | RNA splicing, via transesterification reactions with bulged adenosine as nucleophile | 121/3467 | 320/18723 | 2.52e-16 | 8.27e-14 | 121 |
| GO:00003982 | Colorectum | MSS | mRNA splicing, via spliceosome | 121/3467 | 320/18723 | 2.52e-16 | 8.27e-14 | 121 |
| GO:00003752 | Colorectum | MSS | RNA splicing, via transesterification reactions | 122/3467 | 324/18723 | 2.75e-16 | 8.58e-14 | 122 |
| GO:00226132 | Colorectum | MSS | ribonucleoprotein complex biogenesis | 144/3467 | 463/18723 | 2.76e-11 | 3.67e-09 | 144 |
| GO:00422542 | Colorectum | MSS | ribosome biogenesis | 79/3467 | 299/18723 | 4.32e-04 | 5.23e-03 | 79 |
| GO:0006364 | Colorectum | MSS | rRNA processing | 58/3467 | 225/18723 | 4.17e-03 | 3.03e-02 | 58 |
| GO:0016072 | Colorectum | MSS | rRNA metabolic process | 60/3467 | 236/18723 | 5.01e-03 | 3.46e-02 | 60 |
| GO:00226133 | Colorectum | MSI-H | ribonucleoprotein complex biogenesis | 95/1319 | 463/18723 | 1.04e-21 | 8.32e-19 | 95 |
| GO:00083803 | Colorectum | MSI-H | RNA splicing | 82/1319 | 434/18723 | 1.22e-16 | 4.53e-14 | 82 |
| GO:00003753 | Colorectum | MSI-H | RNA splicing, via transesterification reactions | 67/1319 | 324/18723 | 7.99e-16 | 2.61e-13 | 67 |
| GO:00003773 | Colorectum | MSI-H | RNA splicing, via transesterification reactions with bulged adenosine as nucleophile | 66/1319 | 320/18723 | 1.51e-15 | 4.41e-13 | 66 |
| GO:00003983 | Colorectum | MSI-H | mRNA splicing, via spliceosome | 66/1319 | 320/18723 | 1.51e-15 | 4.41e-13 | 66 |
| GO:00422543 | Colorectum | MSI-H | ribosome biogenesis | 54/1319 | 299/18723 | 1.27e-10 | 2.07e-08 | 54 |
| Page: 1 2 3 4 5 6 |
| Pathway ID | Tissue | Disease Stage | Description | Gene Ratio | Bg Ratio | pvalue | p.adjust | qvalue | Count |
| hsa03040 | Colorectum | AD | Spliceosome | 73/2092 | 217/8465 | 1.73e-03 | 9.68e-03 | 6.18e-03 | 73 |
| hsa030401 | Colorectum | AD | Spliceosome | 73/2092 | 217/8465 | 1.73e-03 | 9.68e-03 | 6.18e-03 | 73 |
| hsa030402 | Colorectum | MSS | Spliceosome | 66/1875 | 217/8465 | 2.58e-03 | 1.27e-02 | 7.81e-03 | 66 |
| hsa030403 | Colorectum | MSS | Spliceosome | 66/1875 | 217/8465 | 2.58e-03 | 1.27e-02 | 7.81e-03 | 66 |
| hsa0304018 | Esophagus | HGIN | Spliceosome | 79/1383 | 217/8465 | 3.22e-13 | 7.00e-12 | 5.56e-12 | 79 |
| hsa0304019 | Esophagus | HGIN | Spliceosome | 79/1383 | 217/8465 | 3.22e-13 | 7.00e-12 | 5.56e-12 | 79 |
| hsa0304027 | Esophagus | ESCC | Spliceosome | 128/4205 | 217/8465 | 3.31e-03 | 8.79e-03 | 4.50e-03 | 128 |
| hsa0304037 | Esophagus | ESCC | Spliceosome | 128/4205 | 217/8465 | 3.31e-03 | 8.79e-03 | 4.50e-03 | 128 |
| hsa030407 | Liver | Cirrhotic | Spliceosome | 102/2530 | 217/8465 | 5.69e-08 | 9.47e-07 | 5.84e-07 | 102 |
| hsa0304012 | Liver | Cirrhotic | Spliceosome | 102/2530 | 217/8465 | 5.69e-08 | 9.47e-07 | 5.84e-07 | 102 |
| hsa0304022 | Liver | HCC | Spliceosome | 122/4020 | 217/8465 | 5.55e-03 | 1.60e-02 | 8.91e-03 | 122 |
| hsa0304032 | Liver | HCC | Spliceosome | 122/4020 | 217/8465 | 5.55e-03 | 1.60e-02 | 8.91e-03 | 122 |
| hsa0304016 | Oral cavity | OSCC | Spliceosome | 123/3704 | 217/8465 | 7.21e-05 | 2.74e-04 | 1.40e-04 | 123 |
| hsa0304017 | Oral cavity | OSCC | Spliceosome | 123/3704 | 217/8465 | 7.21e-05 | 2.74e-04 | 1.40e-04 | 123 |
| Page: 1 |
Top |
Cell-cell communication analysis |
| Identification of potential cell-cell interactions between two cell types and their ligand-receptor pairs for different disease states |
| Ligand | Receptor | LRpair | Pathway | Tissue | Disease Stage |
| Page: 1 |
Top |
Single-cell gene regulatory network inference analysis |
| Find out the significant the regulons (TFs) and the target genes of each regulon across cell types for different disease states |
| TF | Cell Type | Tissue | Disease Stage | Target Gene | RSS | Regulon Activity |
| ∗The dot plots of a searched regulon are shown for all cell subpopulations in each disease state of each tissue based on the regulon specific score inferred using pySCENIC and by calculating the average expression. |
| Page: 1 |
Top |
Somatic mutation of malignant transformation related genes |
| Annotation of somatic variants for genes involved in malignant transformation |
| Hugo Symbol | Variant Class | Variant Classification | dbSNP RS | HGVSc | HGVSp | HGVSp Short | SWISSPROT | BIOTYPE | SIFT | PolyPhen | Tumor Sample Barcode | Tissue | Histology | Sex | Age | Stage | Therapy Types | Drugs | Outcome |
| WBP11 | SNV | Missense_Mutation | c.358N>G | p.Gln120Glu | p.Q120E | Q9Y2W2 | protein_coding | tolerated(0.14) | benign(0.441) | TCGA-A2-A0CX-01 | Breast | breast invasive carcinoma | Female | <65 | I/II | Chemotherapy | adriamycin | SD | |
| WBP11 | SNV | Missense_Mutation | novel | c.914N>T | p.Gly305Val | p.G305V | Q9Y2W2 | protein_coding | tolerated_low_confidence(0.08) | probably_damaging(0.972) | TCGA-AC-A3W6-01 | Breast | breast invasive carcinoma | Female | >=65 | III/IV | Unknown | Unknown | SD |
| WBP11 | SNV | Missense_Mutation | novel | c.65N>T | p.Arg22Leu | p.R22L | Q9Y2W2 | protein_coding | deleterious(0) | possibly_damaging(0.569) | TCGA-AN-A046-01 | Breast | breast invasive carcinoma | Female | >=65 | I/II | Unknown | Unknown | SD |
| WBP11 | SNV | Missense_Mutation | c.407T>C | p.Val136Ala | p.V136A | Q9Y2W2 | protein_coding | tolerated(0.13) | benign(0.402) | TCGA-EW-A1IZ-01 | Breast | breast invasive carcinoma | Female | <65 | III/IV | Chemotherapy | taxotere | SD | |
| WBP11 | SNV | Missense_Mutation | novel | c.814N>A | p.Asp272Asn | p.D272N | Q9Y2W2 | protein_coding | tolerated_low_confidence(0.25) | probably_damaging(0.956) | TCGA-LQ-A4E4-01 | Breast | breast invasive carcinoma | Female | >=65 | III/IV | Hormone Therapy | anastrozole | PD |
| WBP11 | SNV | Missense_Mutation | novel | c.1139N>G | p.Ser380Cys | p.S380C | Q9Y2W2 | protein_coding | tolerated_low_confidence(0.09) | benign(0.157) | TCGA-C5-A8YR-01 | Cervix | cervical & endocervical cancer | Female | <65 | I/II | Unknown | Unknown | PD |
| WBP11 | SNV | Missense_Mutation | novel | c.198N>G | p.Asn66Lys | p.N66K | Q9Y2W2 | protein_coding | deleterious(0) | possibly_damaging(0.802) | TCGA-DS-A1OA-01 | Cervix | cervical & endocervical cancer | Female | >=65 | I/II | Chemotherapy | carboplatin | PD |
| WBP11 | insertion | Frame_Shift_Ins | novel | c.198_199insG | p.Pro67AlafsTer9 | p.P67Afs*9 | Q9Y2W2 | protein_coding | TCGA-DS-A1OA-01 | Cervix | cervical & endocervical cancer | Female | >=65 | I/II | Chemotherapy | carboplatin | PD | ||
| WBP11 | SNV | Missense_Mutation | c.256N>T | p.Arg86Cys | p.R86C | Q9Y2W2 | protein_coding | tolerated(0.07) | probably_damaging(0.957) | TCGA-AA-3713-01 | Colorectum | colon adenocarcinoma | Male | >=65 | III/IV | Chemotherapy | 5-fluorouracil | PR | |
| WBP11 | SNV | Missense_Mutation | rs368323504 | c.1637N>T | p.Ala546Val | p.A546V | Q9Y2W2 | protein_coding | tolerated(0.48) | benign(0.07) | TCGA-AA-3864-01 | Colorectum | colon adenocarcinoma | Male | >=65 | I/II | Unknown | Unknown | SD |
| Page: 1 2 3 4 5 6 7 8 9 |
Top |
Related drugs of malignant transformation related genes |
| Identification of chemicals and drugs interact with genes involved in malignant transfromation |
| (DGIdb 4.0) |
| Entrez ID | Symbol | Category | Interaction Types | Drug Claim Name | Drug Name | PMIDs |
| Page: 1 |

Copyright 2023-Present -The University of Texas Health Science Center at Houston |