
|
|||||
|
 | |
| |
| |
| |
| |
| |
|
Gene: WBP1 |
Gene summary for WBP1 |
| Gene information | Species | Human | Gene symbol | WBP1 | Gene ID | 23559 |
| Gene name | WW domain binding protein 1 | |
| Gene Alias | WBP-1 | |
| Cytomap | 2p13.1 | |
| Gene Type | protein-coding | GO ID | GO:0008150 | UniProtAcc | Q96G27 |
Top |
Malignant transformation analysis |
| Identification of the aberrant gene expression in precancerous and cancerous lesions by comparing the gene expression of stem-like cells in diseased tissues with normal stem cells |
| Entrez ID | Symbol | Replicates | Species | Organ | Tissue | Adj P-value | Log2FC | Malignancy |
| 23559 | WBP1 | HTA11_3410_2000001011 | Human | Colorectum | AD | 1.08e-08 | 1.93e-01 | 0.0155 |
| 23559 | WBP1 | HTA11_2487_2000001011 | Human | Colorectum | SER | 1.65e-07 | 2.41e-01 | -0.1808 |
| 23559 | WBP1 | HTA11_2951_2000001011 | Human | Colorectum | AD | 3.34e-04 | 2.80e-01 | 0.0216 |
| 23559 | WBP1 | HTA11_1938_2000001011 | Human | Colorectum | AD | 6.59e-07 | 2.76e-01 | -0.0811 |
| 23559 | WBP1 | HTA11_78_2000001011 | Human | Colorectum | AD | 8.38e-10 | 2.70e-01 | -0.1088 |
| 23559 | WBP1 | HTA11_347_2000001011 | Human | Colorectum | AD | 3.42e-16 | 3.03e-01 | -0.1954 |
| 23559 | WBP1 | HTA11_411_2000001011 | Human | Colorectum | SER | 5.61e-03 | 4.03e-01 | -0.2602 |
| 23559 | WBP1 | HTA11_3361_2000001011 | Human | Colorectum | AD | 6.03e-08 | 2.57e-01 | -0.1207 |
| 23559 | WBP1 | HTA11_83_2000001011 | Human | Colorectum | SER | 7.35e-06 | 2.45e-01 | -0.1526 |
| 23559 | WBP1 | HTA11_696_2000001011 | Human | Colorectum | AD | 6.35e-15 | 2.94e-01 | -0.1464 |
| 23559 | WBP1 | HTA11_866_2000001011 | Human | Colorectum | AD | 4.47e-08 | 1.81e-01 | -0.1001 |
| 23559 | WBP1 | HTA11_1391_2000001011 | Human | Colorectum | AD | 5.12e-18 | 4.26e-01 | -0.059 |
| 23559 | WBP1 | HTA11_5212_2000001011 | Human | Colorectum | AD | 2.28e-02 | 2.15e-01 | -0.2061 |
| 23559 | WBP1 | HTA11_5216_2000001011 | Human | Colorectum | SER | 3.40e-02 | 2.52e-01 | -0.1462 |
| 23559 | WBP1 | HTA11_546_2000001011 | Human | Colorectum | AD | 4.83e-05 | 2.30e-01 | -0.0842 |
| 23559 | WBP1 | HTA11_866_3004761011 | Human | Colorectum | AD | 1.77e-13 | 3.09e-01 | 0.096 |
| 23559 | WBP1 | HTA11_4255_2000001011 | Human | Colorectum | SER | 3.03e-06 | 3.36e-01 | 0.0446 |
| 23559 | WBP1 | HTA11_9408_2000001011 | Human | Colorectum | AD | 6.03e-05 | 4.04e-01 | 0.0451 |
| 23559 | WBP1 | HTA11_8622_2000001021 | Human | Colorectum | SER | 1.49e-06 | 3.07e-01 | 0.0528 |
| 23559 | WBP1 | HTA11_7663_2000001011 | Human | Colorectum | SER | 7.76e-07 | 3.59e-01 | 0.0131 |
| Page: 1 2 3 4 5 6 |
| Tissue | Expression Dynamics | Abbreviation |
| Colorectum (GSE201348) |  | FAP: Familial adenomatous polyposis |
| CRC: Colorectal cancer | ||
| Colorectum (HTA11) |  | AD: Adenomas |
| SER: Sessile serrated lesions | ||
| MSI-H: Microsatellite-high colorectal cancer | ||
| MSS: Microsatellite stable colorectal cancer | ||
| Esophagus |  | ESCC: Esophageal squamous cell carcinoma |
| HGIN: High-grade intraepithelial neoplasias | ||
| LGIN: Low-grade intraepithelial neoplasias | ||
| Liver | 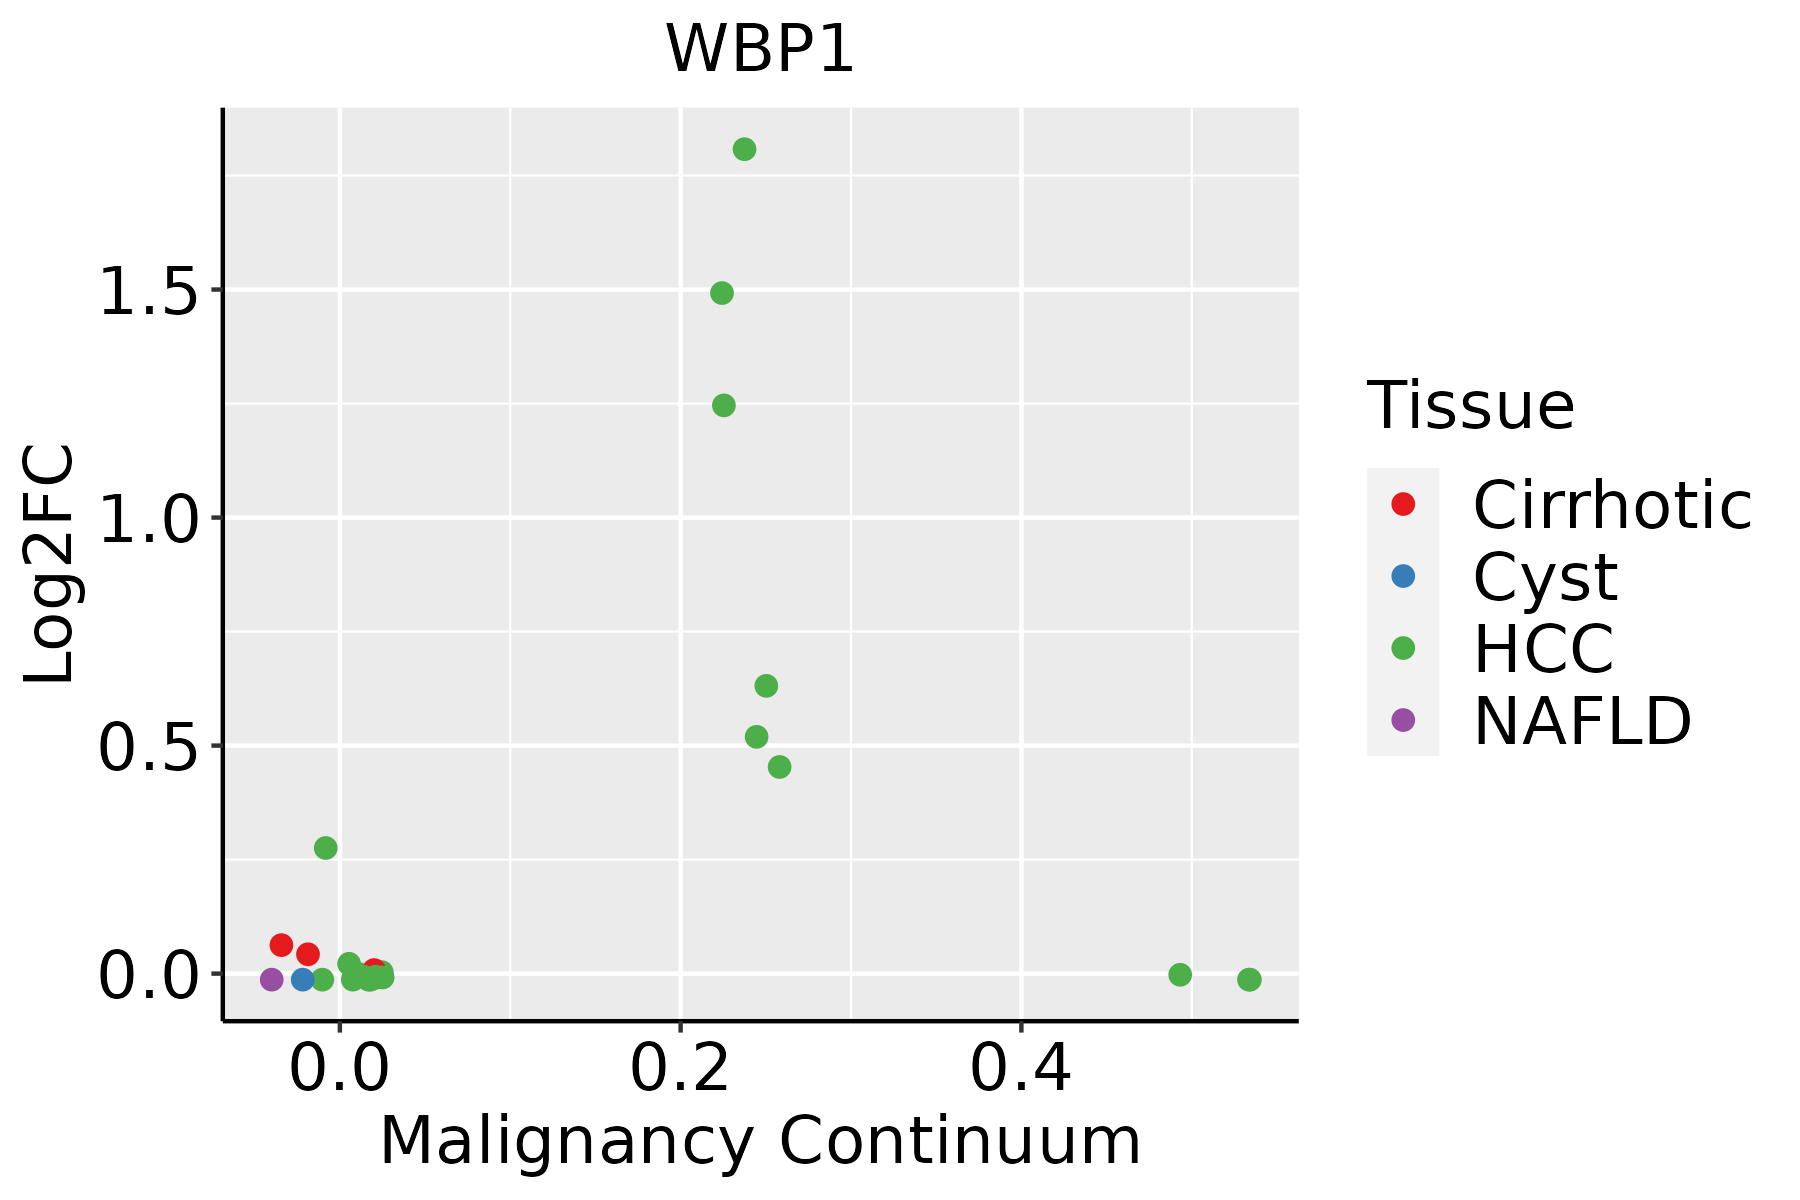 | HCC: Hepatocellular carcinoma |
| NAFLD: Non-alcoholic fatty liver disease |
| ∗log2FC in expression of this searched gene in stem-like cells from each diseased tissue sample relative to stem-like cells in normal samples in each tissue plotted against the malignancy continuum. Samples are colored based on if they are from different disease stage. |
Top |
Malignant transformation related pathway analysis |
| Find out the enriched GO biological processes and KEGG pathways involved in transition from healthy to precancer to cancer |
| Tissue | Disease Stage | Enriched GO biological Processes |
| Colorectum | AD |  |
| Colorectum | SER |  |
| Colorectum | MSS |  |
| Colorectum | MSI-H |  |
| Colorectum | FAP |  |
| ∗Top 15 enriched GO BP terms are showed in the bar plot of each disease state in each tissue. Each row represents a significant GO biological process which is colored according to the -log10(p.adjust). |
| Page: 1 2 3 4 5 6 7 8 9 |
| GO ID | Tissue | Disease Stage | Description | Gene Ratio | Bg Ratio | pvalue | p.adjust | Count |
| GO:0008380 | Colorectum | AD | RNA splicing | 169/3918 | 434/18723 | 3.59e-18 | 2.04e-15 | 169 |
| GO:0000377 | Colorectum | AD | RNA splicing, via transesterification reactions with bulged adenosine as nucleophile | 130/3918 | 320/18723 | 5.88e-16 | 2.16e-13 | 130 |
| GO:0000398 | Colorectum | AD | mRNA splicing, via spliceosome | 130/3918 | 320/18723 | 5.88e-16 | 2.16e-13 | 130 |
| GO:0000375 | Colorectum | AD | RNA splicing, via transesterification reactions | 131/3918 | 324/18723 | 7.11e-16 | 2.22e-13 | 131 |
| GO:0022613 | Colorectum | AD | ribonucleoprotein complex biogenesis | 151/3918 | 463/18723 | 1.96e-09 | 1.39e-07 | 151 |
| GO:0042254 | Colorectum | AD | ribosome biogenesis | 84/3918 | 299/18723 | 1.82e-03 | 1.50e-02 | 84 |
| GO:00083802 | Colorectum | MSS | RNA splicing | 159/3467 | 434/18723 | 1.75e-19 | 1.22e-16 | 159 |
| GO:00003772 | Colorectum | MSS | RNA splicing, via transesterification reactions with bulged adenosine as nucleophile | 121/3467 | 320/18723 | 2.52e-16 | 8.27e-14 | 121 |
| GO:00003982 | Colorectum | MSS | mRNA splicing, via spliceosome | 121/3467 | 320/18723 | 2.52e-16 | 8.27e-14 | 121 |
| GO:00003752 | Colorectum | MSS | RNA splicing, via transesterification reactions | 122/3467 | 324/18723 | 2.75e-16 | 8.58e-14 | 122 |
| GO:00226132 | Colorectum | MSS | ribonucleoprotein complex biogenesis | 144/3467 | 463/18723 | 2.76e-11 | 3.67e-09 | 144 |
| GO:00422542 | Colorectum | MSS | ribosome biogenesis | 79/3467 | 299/18723 | 4.32e-04 | 5.23e-03 | 79 |
| GO:0006364 | Colorectum | MSS | rRNA processing | 58/3467 | 225/18723 | 4.17e-03 | 3.03e-02 | 58 |
| GO:0016072 | Colorectum | MSS | rRNA metabolic process | 60/3467 | 236/18723 | 5.01e-03 | 3.46e-02 | 60 |
| GO:00226133 | Colorectum | MSI-H | ribonucleoprotein complex biogenesis | 95/1319 | 463/18723 | 1.04e-21 | 8.32e-19 | 95 |
| GO:00083803 | Colorectum | MSI-H | RNA splicing | 82/1319 | 434/18723 | 1.22e-16 | 4.53e-14 | 82 |
| GO:00003753 | Colorectum | MSI-H | RNA splicing, via transesterification reactions | 67/1319 | 324/18723 | 7.99e-16 | 2.61e-13 | 67 |
| GO:00003773 | Colorectum | MSI-H | RNA splicing, via transesterification reactions with bulged adenosine as nucleophile | 66/1319 | 320/18723 | 1.51e-15 | 4.41e-13 | 66 |
| GO:00003983 | Colorectum | MSI-H | mRNA splicing, via spliceosome | 66/1319 | 320/18723 | 1.51e-15 | 4.41e-13 | 66 |
| GO:00422543 | Colorectum | MSI-H | ribosome biogenesis | 54/1319 | 299/18723 | 1.27e-10 | 2.07e-08 | 54 |
| Page: 1 2 3 4 5 6 |
| Pathway ID | Tissue | Disease Stage | Description | Gene Ratio | Bg Ratio | pvalue | p.adjust | qvalue | Count |
| Page: 1 |
Top |
Cell-cell communication analysis |
| Identification of potential cell-cell interactions between two cell types and their ligand-receptor pairs for different disease states |
| Ligand | Receptor | LRpair | Pathway | Tissue | Disease Stage |
| Page: 1 |
Top |
Single-cell gene regulatory network inference analysis |
| Find out the significant the regulons (TFs) and the target genes of each regulon across cell types for different disease states |
| TF | Cell Type | Tissue | Disease Stage | Target Gene | RSS | Regulon Activity |
| ∗The dot plots of a searched regulon are shown for all cell subpopulations in each disease state of each tissue based on the regulon specific score inferred using pySCENIC and by calculating the average expression. |
| Page: 1 |
Top |
Somatic mutation of malignant transformation related genes |
| Annotation of somatic variants for genes involved in malignant transformation |
| Hugo Symbol | Variant Class | Variant Classification | dbSNP RS | HGVSc | HGVSp | HGVSp Short | SWISSPROT | BIOTYPE | SIFT | PolyPhen | Tumor Sample Barcode | Tissue | Histology | Sex | Age | Stage | Therapy Types | Drugs | Outcome |
| WBP1 | SNV | Missense_Mutation | novel | c.249N>T | p.Arg83Ser | p.R83S | Q96G27 | protein_coding | deleterious(0) | probably_damaging(0.994) | TCGA-E9-A3HO-01 | Breast | breast invasive carcinoma | Female | <65 | I/II | Chemotherapy | cyclophosphamide | CR |
| WBP1 | SNV | Missense_Mutation | novel | c.274N>C | p.Glu92Gln | p.E92Q | Q96G27 | protein_coding | deleterious(0) | probably_damaging(0.996) | TCGA-JW-AAVH-01 | Cervix | cervical & endocervical cancer | Female | <65 | I/II | Unknown | Unknown | SD |
| WBP1 | SNV | Missense_Mutation | c.31N>C | p.Glu11Gln | p.E11Q | Q96G27 | protein_coding | deleterious_low_confidence(0.01) | benign(0.171) | TCGA-Q1-A73O-01 | Cervix | cervical & endocervical cancer | Female | <65 | I/II | Chemotherapy | cisplatin | CR | |
| WBP1 | insertion | Frame_Shift_Ins | rs547055147 | c.551dupC | p.His185SerfsTer5 | p.H185Sfs*5 | Q96G27 | protein_coding | TCGA-C5-A7CM-01 | Cervix | cervical & endocervical cancer | Female | <65 | I/II | Chemotherapy | cisplatin | SD | ||
| WBP1 | SNV | Missense_Mutation | c.458N>A | p.Ser153Asn | p.S153N | Q96G27 | protein_coding | deleterious(0.04) | benign(0) | TCGA-A6-6653-01 | Colorectum | colon adenocarcinoma | Male | >=65 | I/II | Unknown | Unknown | SD | |
| WBP1 | SNV | Missense_Mutation | novel | c.278N>A | p.Ile93Asn | p.I93N | Q96G27 | protein_coding | deleterious(0) | probably_damaging(0.998) | TCGA-AA-3715-01 | Colorectum | colon adenocarcinoma | Male | >=65 | I/II | Unknown | Unknown | PD |
| WBP1 | deletion | Frame_Shift_Del | rs773064295 | c.552delN | p.His185IlefsTer10 | p.H185Ifs*10 | Q96G27 | protein_coding | TCGA-A6-2672-01 | Colorectum | colon adenocarcinoma | Female | >=65 | III/IV | Unknown | Unknown | SD | ||
| WBP1 | deletion | Frame_Shift_Del | c.545delN | p.Pro184LeufsTer11 | p.P184Lfs*11 | Q96G27 | protein_coding | TCGA-A6-6780-01 | Colorectum | colon adenocarcinoma | Male | >=65 | I/II | Unknown | Unknown | SD | |||
| WBP1 | deletion | Frame_Shift_Del | rs773064295 | c.552delT | p.His185IlefsTer10 | p.H185Ifs*10 | Q96G27 | protein_coding | TCGA-AA-3845-01 | Colorectum | colon adenocarcinoma | Female | >=65 | I/II | Unknown | Unknown | PD | ||
| WBP1 | deletion | Frame_Shift_Del | rs773064295 | c.552delN | p.His185IlefsTer10 | p.H185Ifs*10 | Q96G27 | protein_coding | TCGA-DM-A1HB-01 | Colorectum | colon adenocarcinoma | Male | >=65 | III/IV | Unknown | Unknown | SD |
| Page: 1 2 3 4 |
Top |
Related drugs of malignant transformation related genes |
| Identification of chemicals and drugs interact with genes involved in malignant transfromation |
| (DGIdb 4.0) |
| Entrez ID | Symbol | Category | Interaction Types | Drug Claim Name | Drug Name | PMIDs |
| Page: 1 |

Copyright 2023-Present -The University of Texas Health Science Center at Houston |