
|
|||||
|
 | |
| |
| |
| |
| |
| |
|
Gene: WASL |
Gene summary for WASL |
| Gene information | Species | Human | Gene symbol | WASL | Gene ID | 8976 |
| Gene name | WASP like actin nucleation promoting factor | |
| Gene Alias | N-WASP | |
| Cytomap | 7q31.32 | |
| Gene Type | protein-coding | GO ID | GO:0000902 | UniProtAcc | O00401 |
Top |
Malignant transformation analysis |
| Identification of the aberrant gene expression in precancerous and cancerous lesions by comparing the gene expression of stem-like cells in diseased tissues with normal stem cells |
| Entrez ID | Symbol | Replicates | Species | Organ | Tissue | Adj P-value | Log2FC | Malignancy |
| 8976 | WASL | HTA11_3410_2000001011 | Human | Colorectum | AD | 5.83e-20 | -6.15e-01 | 0.0155 |
| 8976 | WASL | HTA11_2487_2000001011 | Human | Colorectum | SER | 6.37e-03 | -3.98e-01 | -0.1808 |
| 8976 | WASL | HTA11_2951_2000001011 | Human | Colorectum | AD | 2.58e-02 | -6.47e-01 | 0.0216 |
| 8976 | WASL | HTA11_3361_2000001011 | Human | Colorectum | AD | 1.18e-02 | -4.68e-01 | -0.1207 |
| 8976 | WASL | HTA11_866_2000001011 | Human | Colorectum | AD | 2.49e-04 | -3.22e-01 | -0.1001 |
| 8976 | WASL | HTA11_1391_2000001011 | Human | Colorectum | AD | 4.47e-03 | -4.01e-01 | -0.059 |
| 8976 | WASL | HTA11_866_3004761011 | Human | Colorectum | AD | 4.57e-10 | -5.15e-01 | 0.096 |
| 8976 | WASL | HTA11_8622_2000001021 | Human | Colorectum | SER | 2.87e-03 | -6.09e-01 | 0.0528 |
| 8976 | WASL | HTA11_10623_2000001011 | Human | Colorectum | AD | 4.32e-02 | -5.33e-01 | -0.0177 |
| 8976 | WASL | HTA11_10711_2000001011 | Human | Colorectum | AD | 8.96e-07 | -5.46e-01 | 0.0338 |
| 8976 | WASL | HTA11_7696_3000711011 | Human | Colorectum | AD | 5.48e-16 | -5.04e-01 | 0.0674 |
| 8976 | WASL | HTA11_11156_2000001011 | Human | Colorectum | AD | 3.94e-02 | -6.81e-01 | 0.0397 |
| 8976 | WASL | HTA11_6818_2000001021 | Human | Colorectum | AD | 3.98e-05 | -5.48e-01 | 0.0588 |
| 8976 | WASL | HTA11_99999970781_79442 | Human | Colorectum | MSS | 2.31e-11 | -4.41e-01 | 0.294 |
| 8976 | WASL | HTA11_99999971662_82457 | Human | Colorectum | MSS | 2.02e-12 | -4.63e-01 | 0.3859 |
| 8976 | WASL | HTA11_99999974143_84620 | Human | Colorectum | MSS | 2.91e-21 | -5.56e-01 | 0.3005 |
| 8976 | WASL | A002-C-010 | Human | Colorectum | FAP | 1.41e-03 | -2.50e-01 | 0.242 |
| 8976 | WASL | A001-C-207 | Human | Colorectum | FAP | 5.38e-07 | -3.22e-01 | 0.1278 |
| 8976 | WASL | A015-C-203 | Human | Colorectum | FAP | 5.25e-28 | -5.31e-01 | -0.1294 |
| 8976 | WASL | A015-C-204 | Human | Colorectum | FAP | 1.24e-07 | -3.31e-01 | -0.0228 |
| Page: 1 2 3 4 5 6 7 8 9 |
| Tissue | Expression Dynamics | Abbreviation |
| Colorectum (GSE201348) |  | FAP: Familial adenomatous polyposis |
| CRC: Colorectal cancer | ||
| Colorectum (HTA11) |  | AD: Adenomas |
| SER: Sessile serrated lesions | ||
| MSI-H: Microsatellite-high colorectal cancer | ||
| MSS: Microsatellite stable colorectal cancer | ||
| Esophagus | 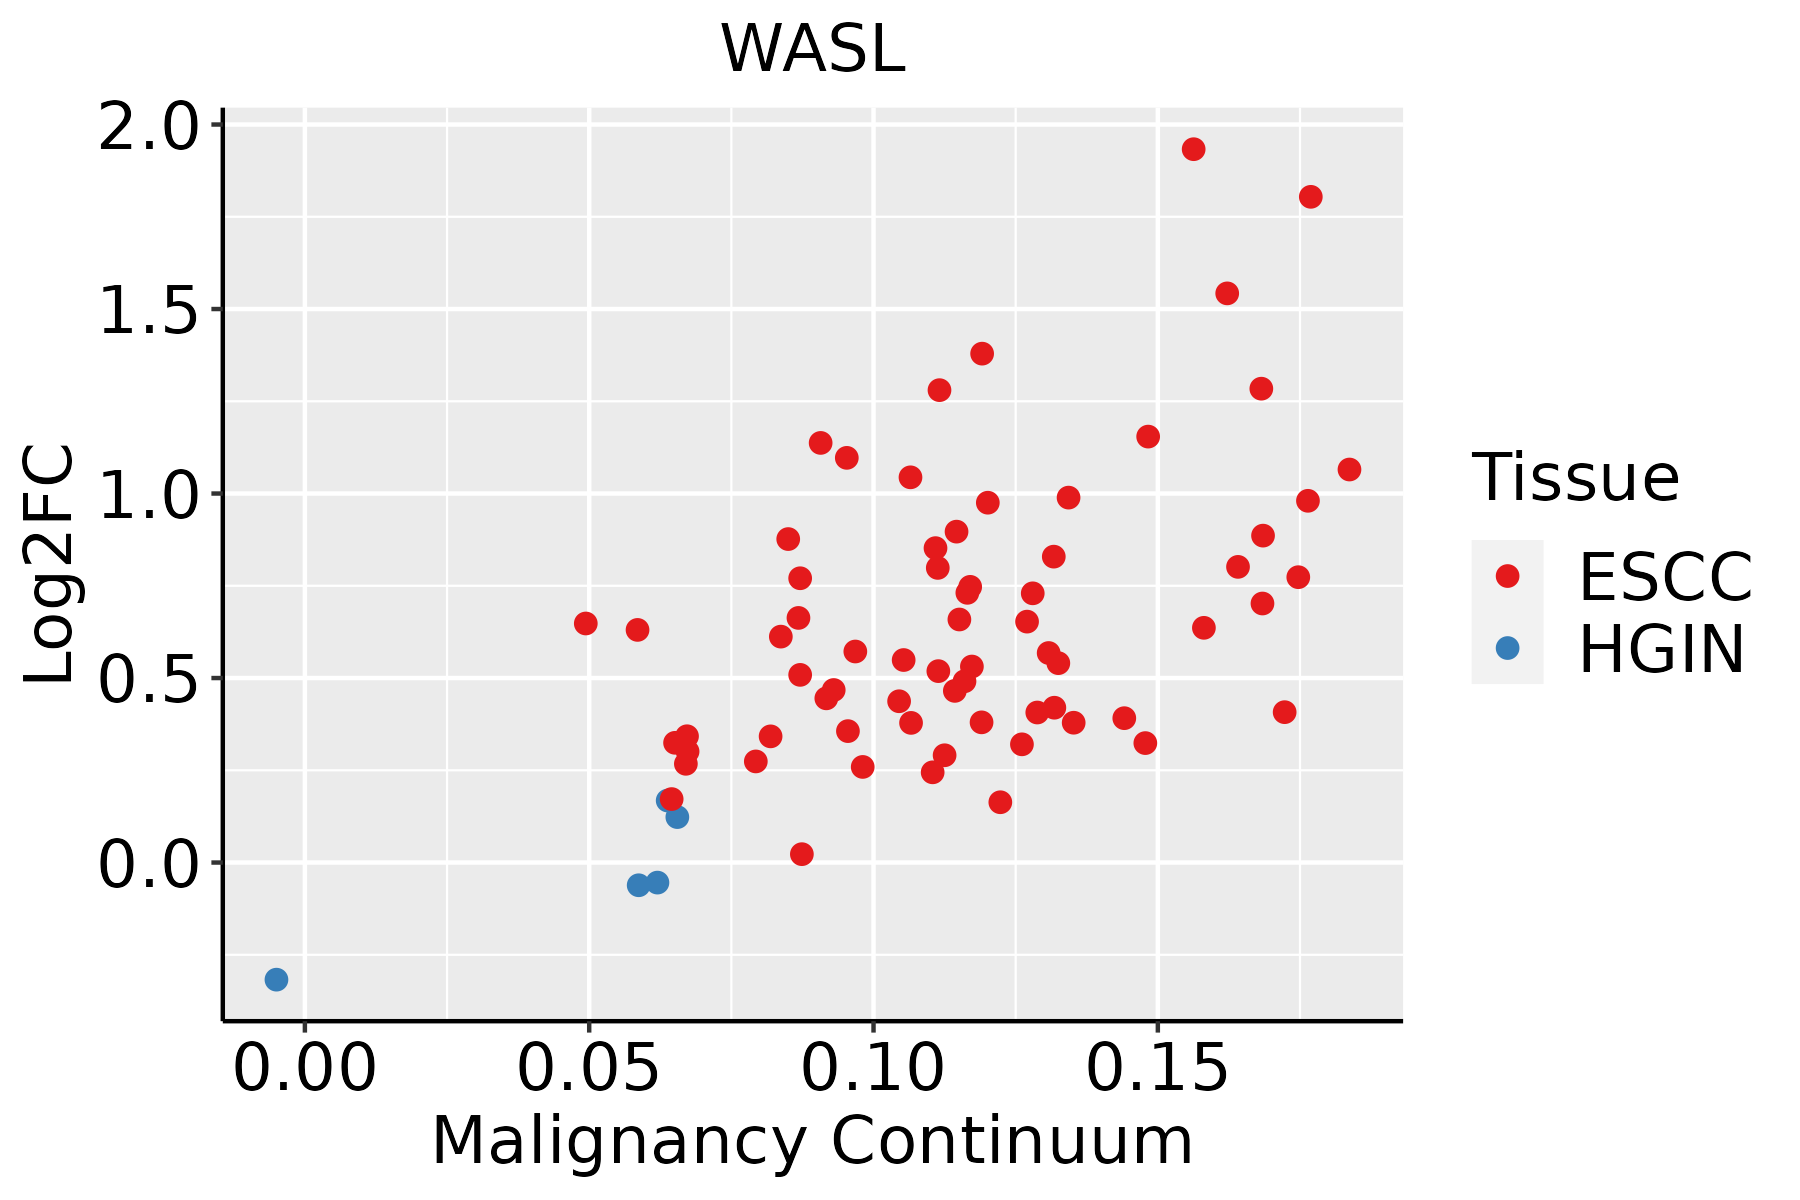 | ESCC: Esophageal squamous cell carcinoma |
| HGIN: High-grade intraepithelial neoplasias | ||
| LGIN: Low-grade intraepithelial neoplasias | ||
| Liver | 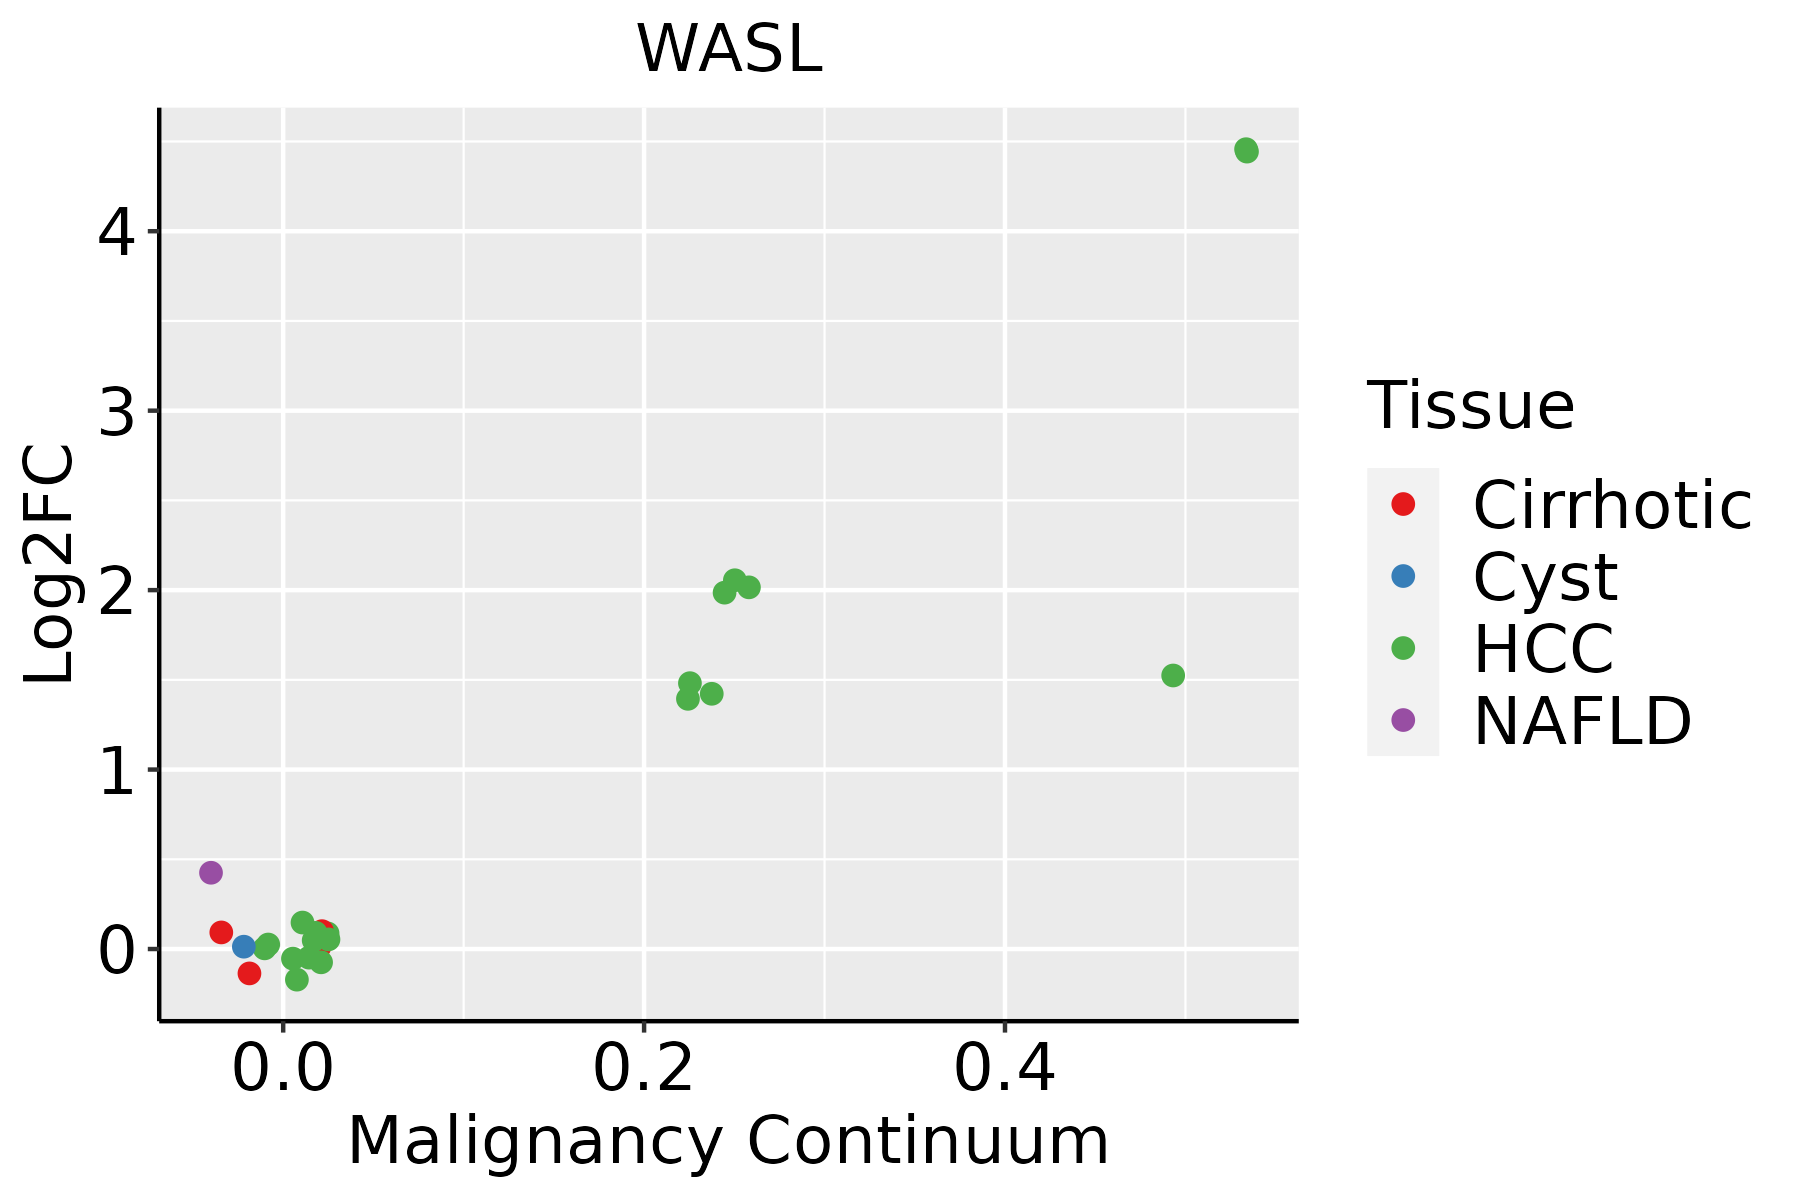 | HCC: Hepatocellular carcinoma |
| NAFLD: Non-alcoholic fatty liver disease | ||
| Oral Cavity | 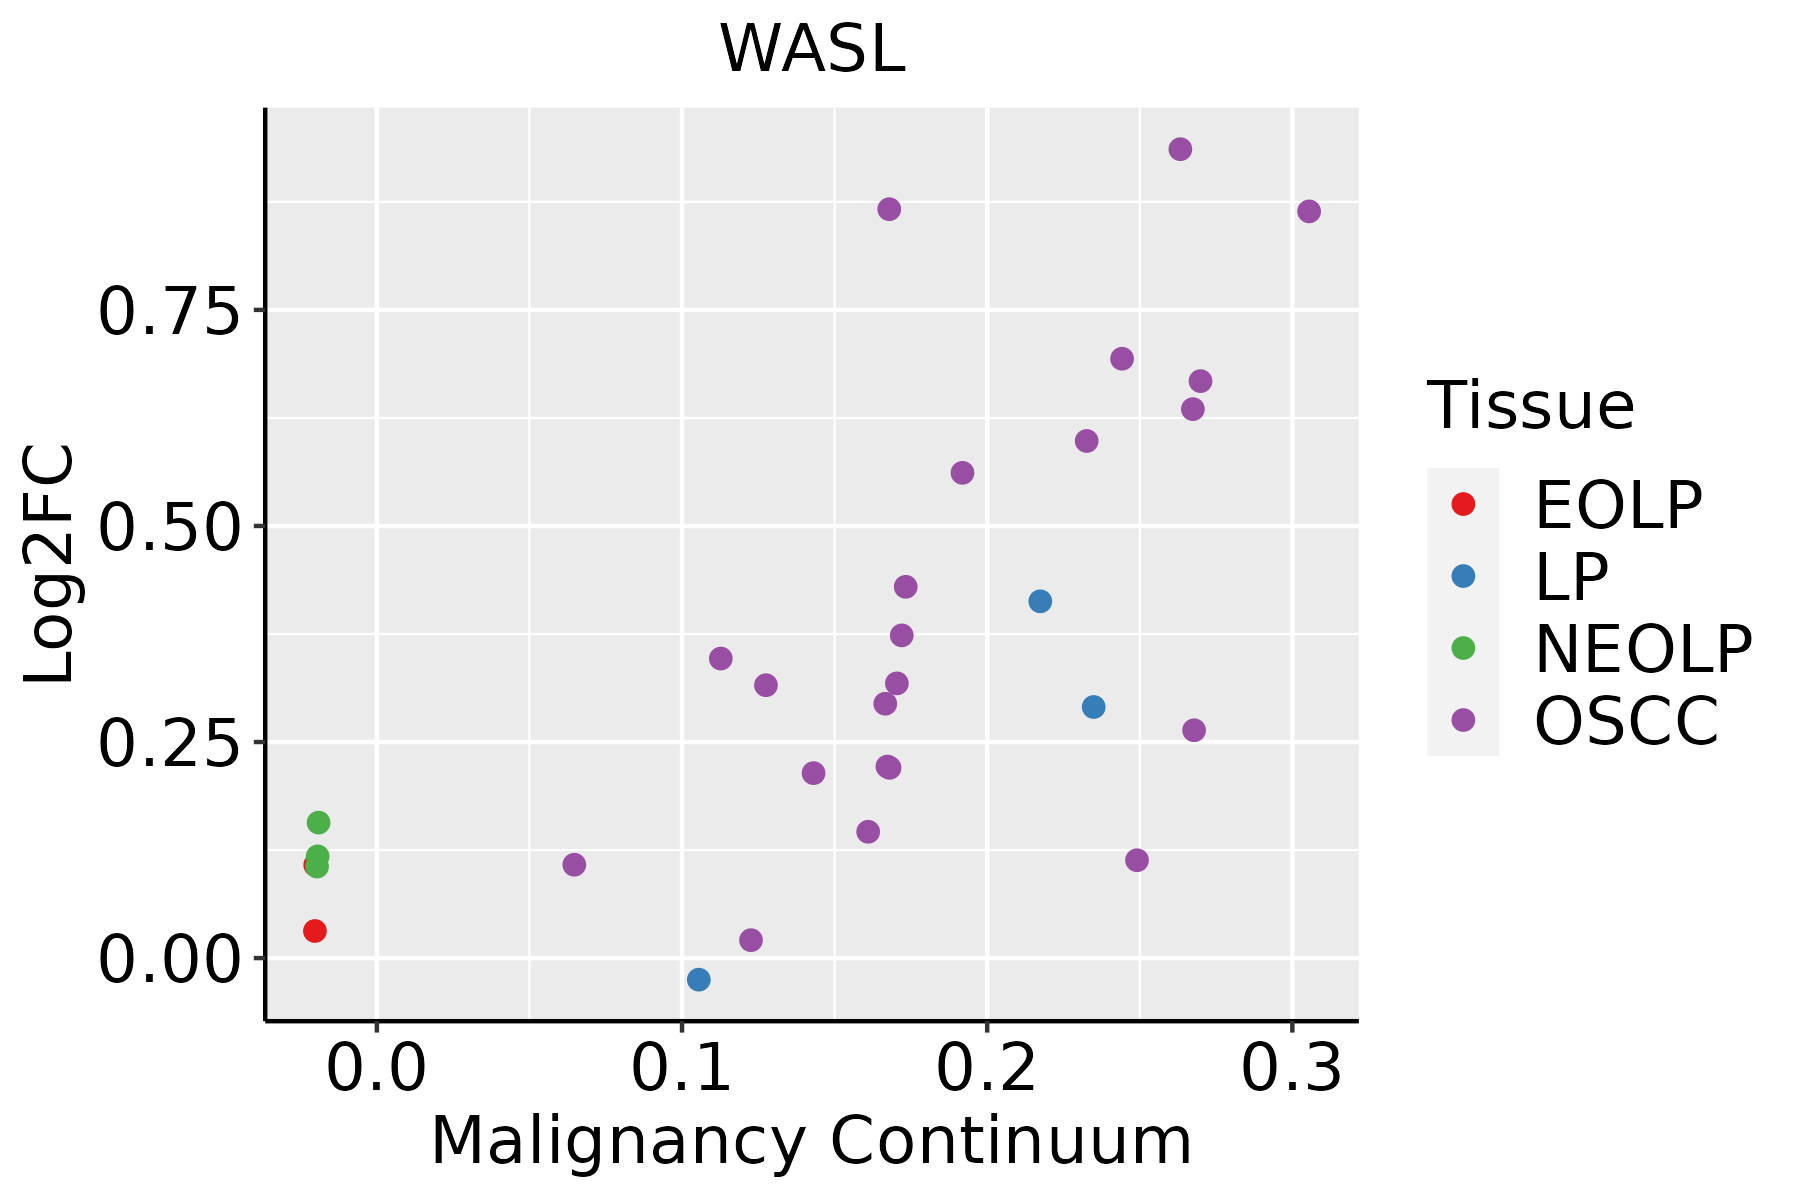 | EOLP: Erosive Oral lichen planus |
| LP: leukoplakia | ||
| NEOLP: Non-erosive oral lichen planus | ||
| OSCC: Oral squamous cell carcinoma | ||
| Prostate | 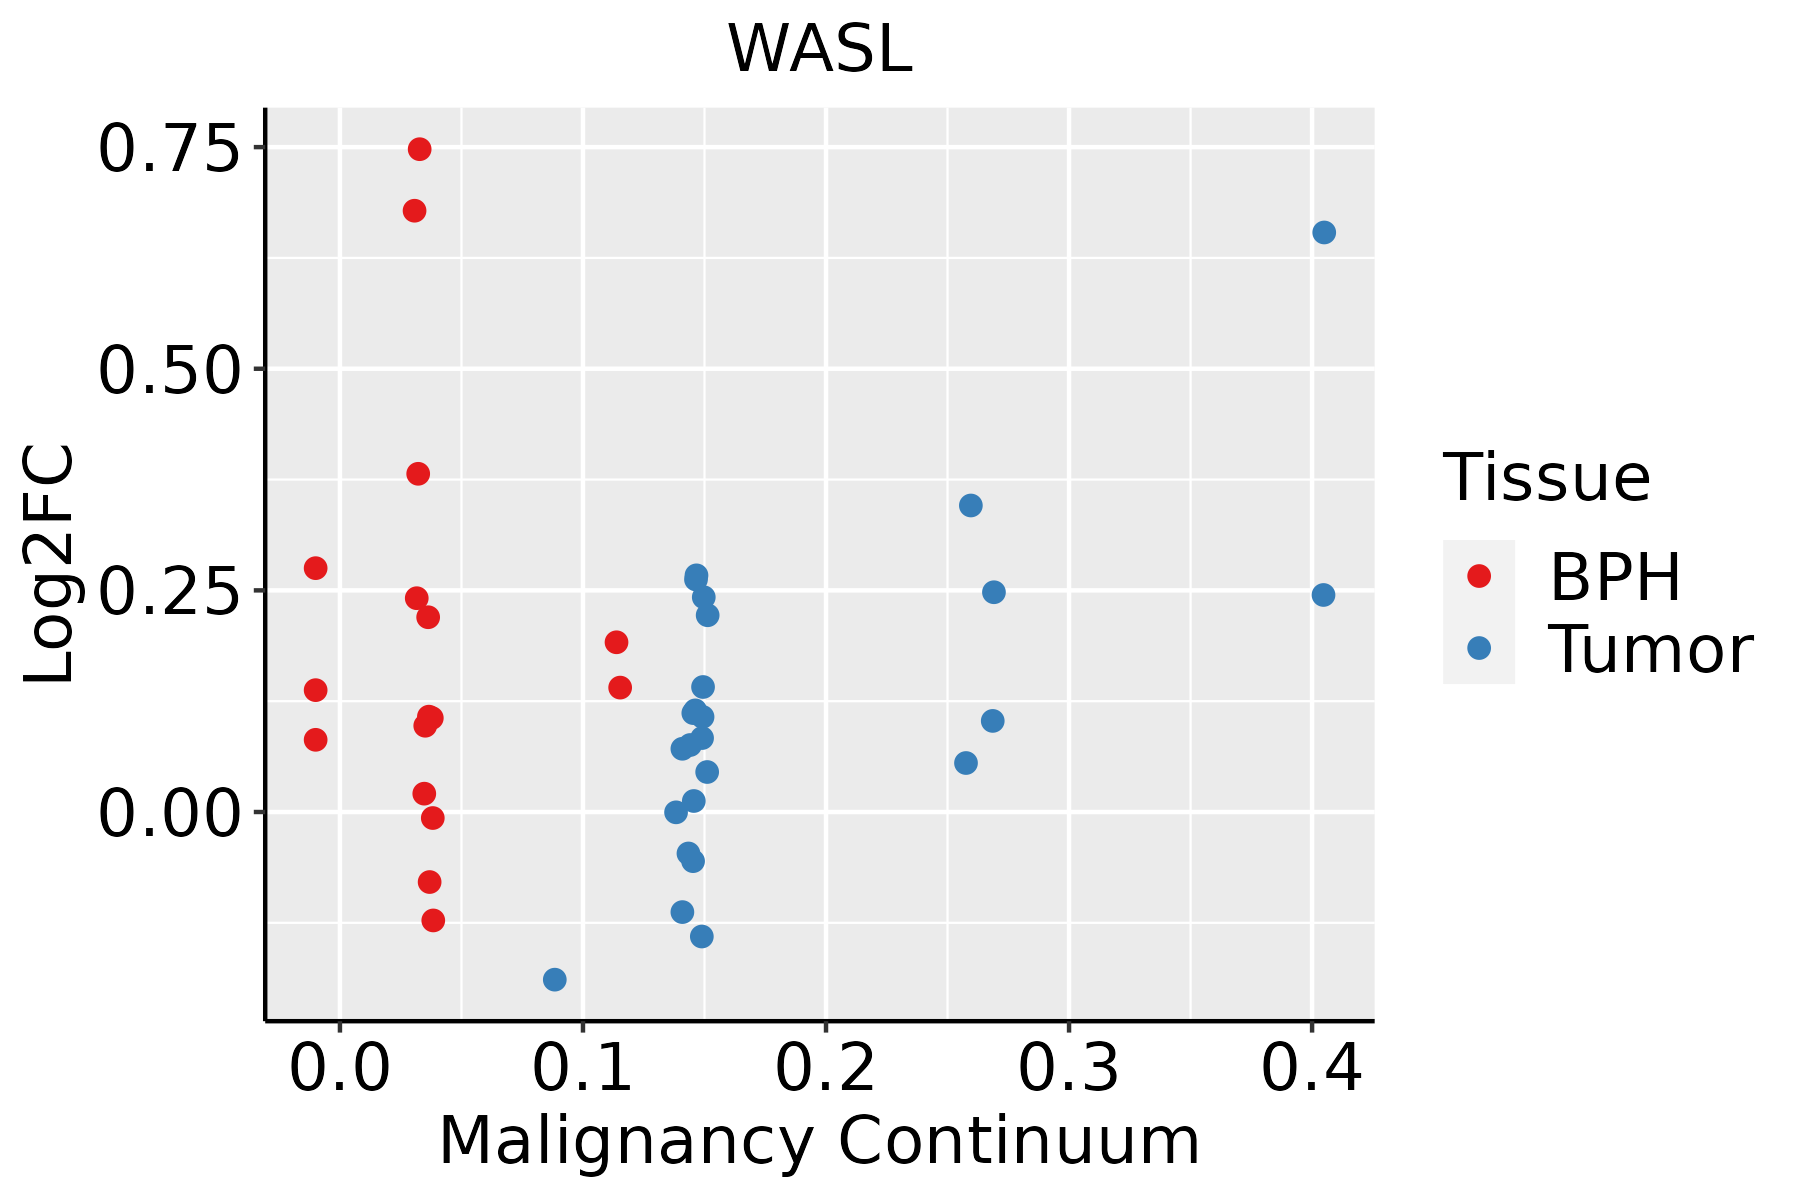 | BPH: Benign Prostatic Hyperplasia |
| Thyroid | 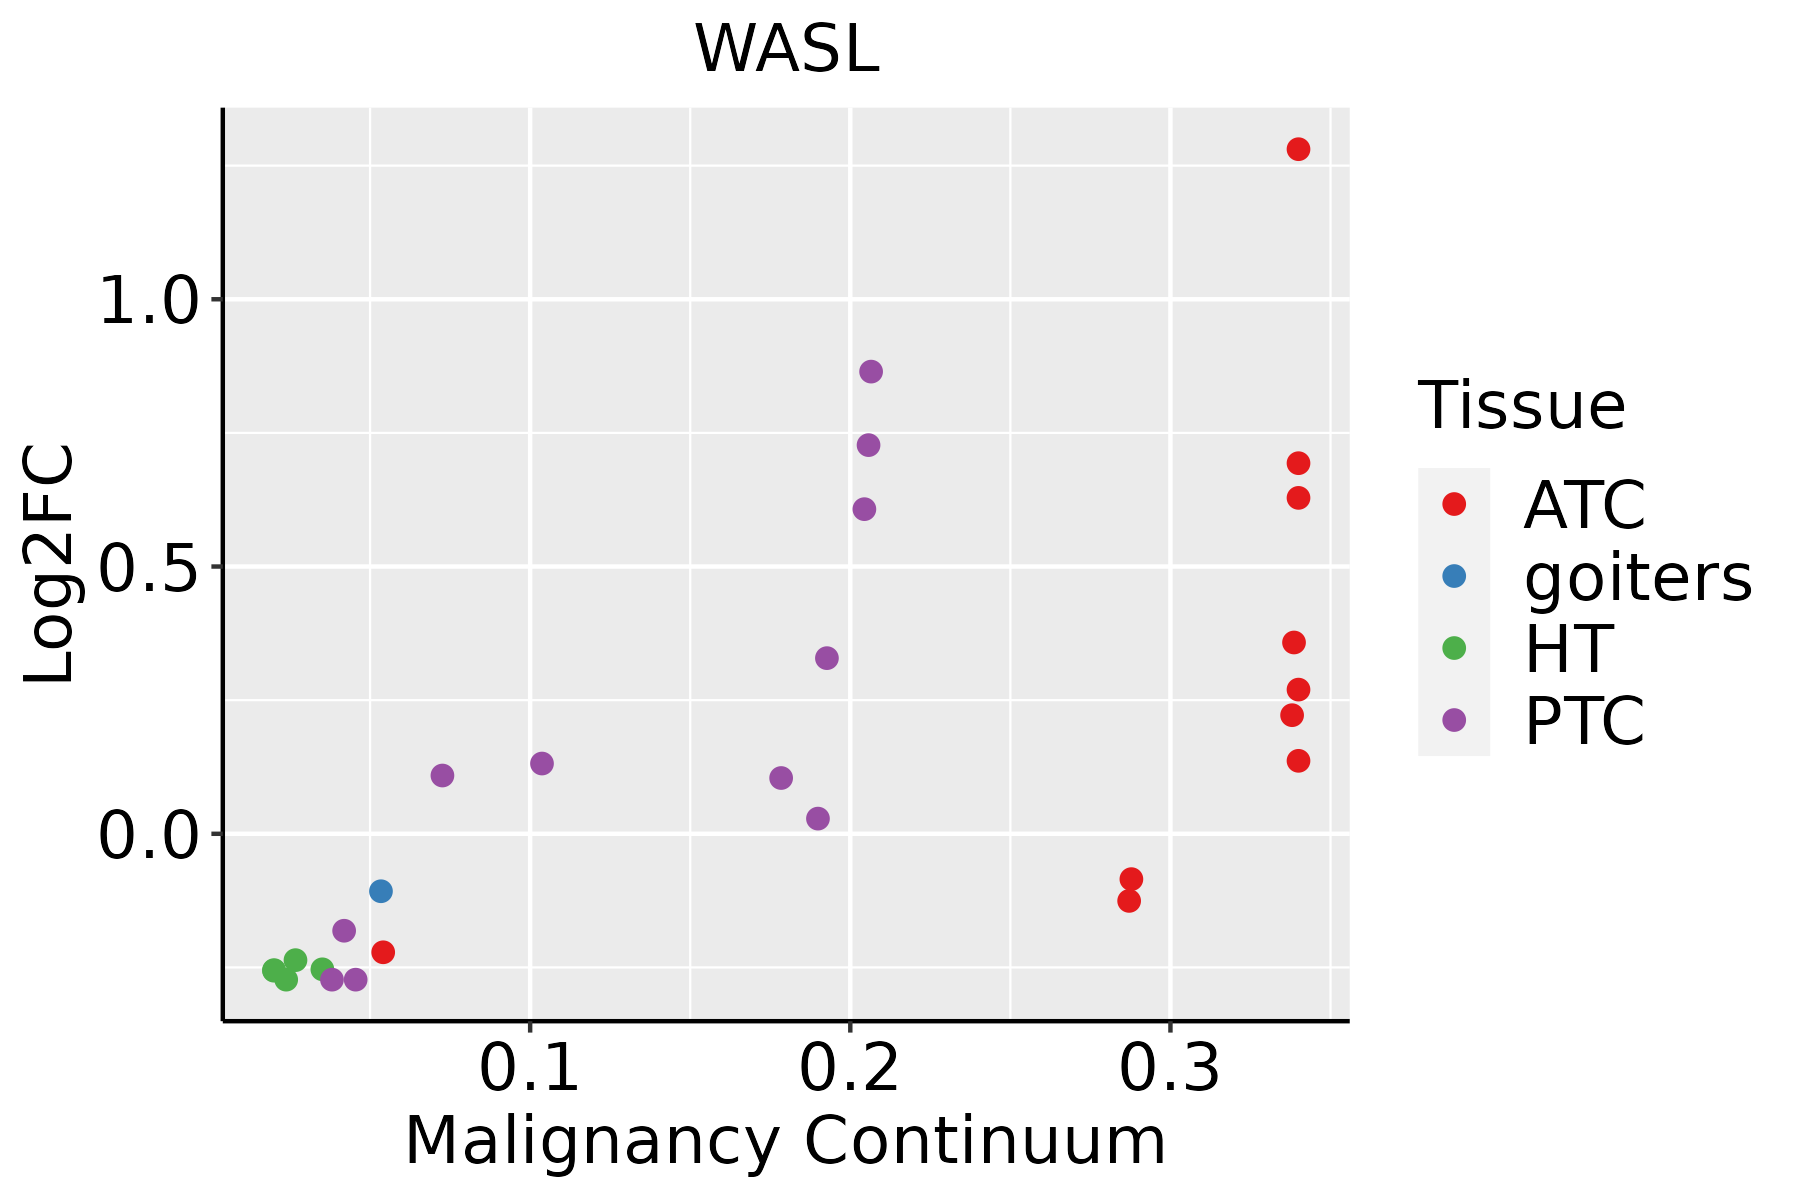 | ATC: Anaplastic thyroid cancer |
| HT: Hashimoto's thyroiditis | ||
| PTC: Papillary thyroid cancer |
| ∗log2FC in expression of this searched gene in stem-like cells from each diseased tissue sample relative to stem-like cells in normal samples in each tissue plotted against the malignancy continuum. Samples are colored based on if they are from different disease stage. |
Top |
Malignant transformation related pathway analysis |
| Find out the enriched GO biological processes and KEGG pathways involved in transition from healthy to precancer to cancer |
| Tissue | Disease Stage | Enriched GO biological Processes |
| Colorectum | AD |  |
| Colorectum | SER |  |
| Colorectum | MSS |  |
| Colorectum | MSI-H |  |
| Colorectum | FAP |  |
| ∗Top 15 enriched GO BP terms are showed in the bar plot of each disease state in each tissue. Each row represents a significant GO biological process which is colored according to the -log10(p.adjust). |
| Page: 1 2 3 4 5 6 7 8 9 |
| GO ID | Tissue | Disease Stage | Description | Gene Ratio | Bg Ratio | pvalue | p.adjust | Count |
| GO:0007015 | Colorectum | AD | actin filament organization | 167/3918 | 442/18723 | 1.65e-16 | 7.94e-14 | 167 |
| GO:0032535 | Colorectum | AD | regulation of cellular component size | 142/3918 | 383/18723 | 1.74e-13 | 3.41e-11 | 142 |
| GO:1902903 | Colorectum | AD | regulation of supramolecular fiber organization | 139/3918 | 383/18723 | 2.01e-12 | 3.19e-10 | 139 |
| GO:0032970 | Colorectum | AD | regulation of actin filament-based process | 142/3918 | 397/18723 | 4.05e-12 | 5.90e-10 | 142 |
| GO:0110053 | Colorectum | AD | regulation of actin filament organization | 108/3918 | 278/18723 | 5.02e-12 | 6.98e-10 | 108 |
| GO:0008154 | Colorectum | AD | actin polymerization or depolymerization | 90/3918 | 218/18723 | 6.14e-12 | 8.23e-10 | 90 |
| GO:0032271 | Colorectum | AD | regulation of protein polymerization | 94/3918 | 233/18723 | 1.01e-11 | 1.29e-09 | 94 |
| GO:0030041 | Colorectum | AD | actin filament polymerization | 81/3918 | 191/18723 | 1.35e-11 | 1.69e-09 | 81 |
| GO:0051258 | Colorectum | AD | protein polymerization | 112/3918 | 297/18723 | 1.85e-11 | 2.27e-09 | 112 |
| GO:0043254 | Colorectum | AD | regulation of protein-containing complex assembly | 148/3918 | 428/18723 | 2.64e-11 | 3.18e-09 | 148 |
| GO:0008064 | Colorectum | AD | regulation of actin polymerization or depolymerization | 79/3918 | 188/18723 | 4.17e-11 | 4.74e-09 | 79 |
| GO:0030833 | Colorectum | AD | regulation of actin filament polymerization | 74/3918 | 172/18723 | 4.50e-11 | 5.03e-09 | 74 |
| GO:0030832 | Colorectum | AD | regulation of actin filament length | 79/3918 | 189/18723 | 5.71e-11 | 6.27e-09 | 79 |
| GO:1902905 | Colorectum | AD | positive regulation of supramolecular fiber organization | 85/3918 | 209/18723 | 5.95e-11 | 6.33e-09 | 85 |
| GO:0032956 | Colorectum | AD | regulation of actin cytoskeleton organization | 127/3918 | 358/18723 | 1.03e-10 | 1.04e-08 | 127 |
| GO:0051495 | Colorectum | AD | positive regulation of cytoskeleton organization | 89/3918 | 226/18723 | 1.61e-10 | 1.56e-08 | 89 |
| GO:0032273 | Colorectum | AD | positive regulation of protein polymerization | 62/3918 | 138/18723 | 1.94e-10 | 1.76e-08 | 62 |
| GO:0031334 | Colorectum | AD | positive regulation of protein-containing complex assembly | 91/3918 | 237/18723 | 4.78e-10 | 3.99e-08 | 91 |
| GO:0030838 | Colorectum | AD | positive regulation of actin filament polymerization | 48/3918 | 99/18723 | 9.21e-10 | 7.03e-08 | 48 |
| GO:0051656 | Colorectum | AD | establishment of organelle localization | 131/3918 | 390/18723 | 3.00e-09 | 2.06e-07 | 131 |
| Page: 1 2 3 4 5 6 7 8 9 10 11 12 13 14 15 16 17 18 19 20 21 22 23 24 25 26 27 28 29 30 31 32 33 34 35 36 37 |
| Pathway ID | Tissue | Disease Stage | Description | Gene Ratio | Bg Ratio | pvalue | p.adjust | qvalue | Count |
| hsa04144 | Colorectum | AD | Endocytosis | 111/2092 | 251/8465 | 5.95e-12 | 1.42e-10 | 9.08e-11 | 111 |
| hsa05131 | Colorectum | AD | Shigellosis | 109/2092 | 247/8465 | 1.09e-11 | 2.44e-10 | 1.55e-10 | 109 |
| hsa05100 | Colorectum | AD | Bacterial invasion of epithelial cells | 44/2092 | 77/8465 | 1.13e-09 | 2.22e-08 | 1.42e-08 | 44 |
| hsa04520 | Colorectum | AD | Adherens junction | 50/2092 | 93/8465 | 1.52e-09 | 2.83e-08 | 1.81e-08 | 50 |
| hsa05132 | Colorectum | AD | Salmonella infection | 102/2092 | 249/8465 | 7.65e-09 | 1.28e-07 | 8.17e-08 | 102 |
| hsa05130 | Colorectum | AD | Pathogenic Escherichia coli infection | 79/2092 | 197/8465 | 1.05e-06 | 1.36e-05 | 8.65e-06 | 79 |
| hsa05135 | Colorectum | AD | Yersinia infection | 58/2092 | 137/8465 | 3.90e-06 | 4.35e-05 | 2.78e-05 | 58 |
| hsa04810 | Colorectum | AD | Regulation of actin cytoskeleton | 75/2092 | 229/8465 | 3.36e-03 | 1.76e-02 | 1.12e-02 | 75 |
| hsa041441 | Colorectum | AD | Endocytosis | 111/2092 | 251/8465 | 5.95e-12 | 1.42e-10 | 9.08e-11 | 111 |
| hsa051311 | Colorectum | AD | Shigellosis | 109/2092 | 247/8465 | 1.09e-11 | 2.44e-10 | 1.55e-10 | 109 |
| hsa051001 | Colorectum | AD | Bacterial invasion of epithelial cells | 44/2092 | 77/8465 | 1.13e-09 | 2.22e-08 | 1.42e-08 | 44 |
| hsa045201 | Colorectum | AD | Adherens junction | 50/2092 | 93/8465 | 1.52e-09 | 2.83e-08 | 1.81e-08 | 50 |
| hsa051321 | Colorectum | AD | Salmonella infection | 102/2092 | 249/8465 | 7.65e-09 | 1.28e-07 | 8.17e-08 | 102 |
| hsa051301 | Colorectum | AD | Pathogenic Escherichia coli infection | 79/2092 | 197/8465 | 1.05e-06 | 1.36e-05 | 8.65e-06 | 79 |
| hsa051351 | Colorectum | AD | Yersinia infection | 58/2092 | 137/8465 | 3.90e-06 | 4.35e-05 | 2.78e-05 | 58 |
| hsa048101 | Colorectum | AD | Regulation of actin cytoskeleton | 75/2092 | 229/8465 | 3.36e-03 | 1.76e-02 | 1.12e-02 | 75 |
| hsa051312 | Colorectum | SER | Shigellosis | 87/1580 | 247/8465 | 3.07e-10 | 7.27e-09 | 5.28e-09 | 87 |
| hsa051002 | Colorectum | SER | Bacterial invasion of epithelial cells | 36/1580 | 77/8465 | 1.56e-08 | 3.45e-07 | 2.50e-07 | 36 |
| hsa041442 | Colorectum | SER | Endocytosis | 81/1580 | 251/8465 | 1.14e-07 | 2.36e-06 | 1.71e-06 | 81 |
| hsa045202 | Colorectum | SER | Adherens junction | 37/1580 | 93/8465 | 1.54e-06 | 2.35e-05 | 1.71e-05 | 37 |
| Page: 1 2 3 4 5 6 7 8 9 10 |
Top |
Cell-cell communication analysis |
| Identification of potential cell-cell interactions between two cell types and their ligand-receptor pairs for different disease states |
| Ligand | Receptor | LRpair | Pathway | Tissue | Disease Stage |
| Page: 1 |
Top |
Single-cell gene regulatory network inference analysis |
| Find out the significant the regulons (TFs) and the target genes of each regulon across cell types for different disease states |
| TF | Cell Type | Tissue | Disease Stage | Target Gene | RSS | Regulon Activity |
| ∗The dot plots of a searched regulon are shown for all cell subpopulations in each disease state of each tissue based on the regulon specific score inferred using pySCENIC and by calculating the average expression. |
| Page: 1 |
Top |
Somatic mutation of malignant transformation related genes |
| Annotation of somatic variants for genes involved in malignant transformation |
| Hugo Symbol | Variant Class | Variant Classification | dbSNP RS | HGVSc | HGVSp | HGVSp Short | SWISSPROT | BIOTYPE | SIFT | PolyPhen | Tumor Sample Barcode | Tissue | Histology | Sex | Age | Stage | Therapy Types | Drugs | Outcome |
| WASL | SNV | Missense_Mutation | novel | c.588G>T | p.Lys196Asn | p.K196N | O00401 | protein_coding | deleterious(0) | benign(0.247) | TCGA-AN-A046-01 | Breast | breast invasive carcinoma | Female | >=65 | I/II | Unknown | Unknown | SD |
| WASL | SNV | Missense_Mutation | c.670N>C | p.Asp224His | p.D224H | O00401 | protein_coding | tolerated(0.07) | probably_damaging(0.999) | TCGA-D8-A1JA-01 | Breast | breast invasive carcinoma | Female | <65 | III/IV | Chemotherapy | adriamycin | PD | |
| WASL | SNV | Missense_Mutation | novel | c.989N>A | p.Pro330Gln | p.P330Q | O00401 | protein_coding | tolerated(0.63) | possibly_damaging(0.526) | TCGA-D8-A1XQ-01 | Breast | breast invasive carcinoma | Female | >=65 | I/II | Unknown | Unknown | SD |
| WASL | SNV | Missense_Mutation | c.1364A>T | p.Glu455Val | p.E455V | O00401 | protein_coding | tolerated(0.09) | probably_damaging(0.931) | TCGA-C5-A7UE-01 | Cervix | cervical & endocervical cancer | Female | <65 | I/II | Chemotherapy | cisplatin | SD | |
| WASL | SNV | Missense_Mutation | c.422N>A | p.Arg141Gln | p.R141Q | O00401 | protein_coding | deleterious(0) | probably_damaging(0.929) | TCGA-AA-3510-01 | Colorectum | colon adenocarcinoma | Male | >=65 | I/II | Unknown | Unknown | SD | |
| WASL | SNV | Missense_Mutation | novel | c.799N>T | p.Ala267Ser | p.A267S | O00401 | protein_coding | tolerated(0.08) | probably_damaging(0.978) | TCGA-AA-3811-01 | Colorectum | colon adenocarcinoma | Female | >=65 | III/IV | Unknown | Unknown | PD |
| WASL | SNV | Missense_Mutation | c.584A>C | p.Lys195Thr | p.K195T | O00401 | protein_coding | deleterious(0.01) | benign(0.309) | TCGA-AA-3977-01 | Colorectum | colon adenocarcinoma | Male | >=65 | I/II | Unknown | Unknown | SD | |
| WASL | SNV | Missense_Mutation | c.709N>A | p.Asp237Asn | p.D237N | O00401 | protein_coding | deleterious(0.02) | probably_damaging(0.996) | TCGA-AA-A00N-01 | Colorectum | colon adenocarcinoma | Male | >=65 | I/II | Unknown | Unknown | PD | |
| WASL | SNV | Missense_Mutation | c.443N>T | p.Arg148Ile | p.R148I | O00401 | protein_coding | deleterious(0.01) | benign(0) | TCGA-AA-A010-01 | Colorectum | colon adenocarcinoma | Female | <65 | I/II | Chemotherapy | folinic | CR | |
| WASL | SNV | Missense_Mutation | c.337N>T | p.Asp113Tyr | p.D113Y | O00401 | protein_coding | deleterious(0.02) | probably_damaging(0.952) | TCGA-AA-A010-01 | Colorectum | colon adenocarcinoma | Female | <65 | I/II | Chemotherapy | folinic | CR |
| Page: 1 2 3 4 5 6 7 |
Top |
Related drugs of malignant transformation related genes |
| Identification of chemicals and drugs interact with genes involved in malignant transfromation |
| (DGIdb 4.0) |
| Entrez ID | Symbol | Category | Interaction Types | Drug Claim Name | Drug Name | PMIDs |
| Page: 1 |

Copyright 2023-Present -The University of Texas Health Science Center at Houston |