
|
|||||
|
 | |
| |
| |
| |
| |
| |
|
Gene: WASHC4 |
Gene summary for WASHC4 |
| Gene information | Species | Human | Gene symbol | WASHC4 | Gene ID | 23325 |
| Gene name | WASH complex subunit 4 | |
| Gene Alias | KIAA1033 | |
| Cytomap | 12q23.3 | |
| Gene Type | protein-coding | GO ID | GO:0006810 | UniProtAcc | A0A087X256 |
Top |
Malignant transformation analysis |
| Identification of the aberrant gene expression in precancerous and cancerous lesions by comparing the gene expression of stem-like cells in diseased tissues with normal stem cells |
| Entrez ID | Symbol | Replicates | Species | Organ | Tissue | Adj P-value | Log2FC | Malignancy |
| 23325 | WASHC4 | CCI_2 | Human | Cervix | CC | 2.51e-03 | 8.18e-01 | 0.5249 |
| 23325 | WASHC4 | Tumor | Human | Cervix | CC | 1.63e-12 | -2.57e-01 | 0.1241 |
| 23325 | WASHC4 | NAFLD1 | Human | Liver | NAFLD | 2.22e-04 | 5.43e-01 | -0.04 |
| 23325 | WASHC4 | S41 | Human | Liver | Cirrhotic | 6.12e-06 | 5.75e-01 | -0.0343 |
| 23325 | WASHC4 | HCC1 | Human | Liver | HCC | 4.05e-06 | 2.94e+00 | 0.5336 |
| 23325 | WASHC4 | HCC2 | Human | Liver | HCC | 2.46e-34 | 4.54e+00 | 0.5341 |
| 23325 | WASHC4 | S014 | Human | Liver | HCC | 8.87e-12 | 5.21e-01 | 0.2254 |
| 23325 | WASHC4 | S015 | Human | Liver | HCC | 5.51e-18 | 7.37e-01 | 0.2375 |
| 23325 | WASHC4 | S016 | Human | Liver | HCC | 2.28e-17 | 6.80e-01 | 0.2243 |
| 23325 | WASHC4 | S027 | Human | Liver | HCC | 1.12e-10 | 1.05e+00 | 0.2446 |
| 23325 | WASHC4 | S028 | Human | Liver | HCC | 8.56e-24 | 9.61e-01 | 0.2503 |
| 23325 | WASHC4 | S029 | Human | Liver | HCC | 3.21e-24 | 1.21e+00 | 0.2581 |
| 23325 | WASHC4 | RNA-P25T1-P25T1-1 | Human | Lung | AIS | 1.60e-12 | 5.48e-01 | -0.2116 |
| 23325 | WASHC4 | RNA-P25T1-P25T1-2 | Human | Lung | AIS | 3.94e-06 | 5.72e-01 | -0.1941 |
| 23325 | WASHC4 | RNA-P25T1-P25T1-3 | Human | Lung | AIS | 7.22e-04 | 4.61e-01 | -0.2107 |
| 23325 | WASHC4 | RNA-P25T1-P25T1-4 | Human | Lung | AIS | 2.98e-05 | 3.69e-01 | -0.2119 |
| 23325 | WASHC4 | RNA-P6T2-P6T2-1 | Human | Lung | IAC | 3.79e-05 | 2.77e-01 | -0.0166 |
| 23325 | WASHC4 | RNA-P6T2-P6T2-2 | Human | Lung | IAC | 1.88e-06 | 2.90e-01 | -0.0132 |
| 23325 | WASHC4 | RNA-P6T2-P6T2-3 | Human | Lung | IAC | 1.17e-04 | 2.04e-01 | -0.013 |
| 23325 | WASHC4 | RNA-P6T2-P6T2-4 | Human | Lung | IAC | 2.01e-02 | 1.73e-01 | -0.0121 |
| Page: 1 2 |
| Tissue | Expression Dynamics | Abbreviation |
| Cervix | 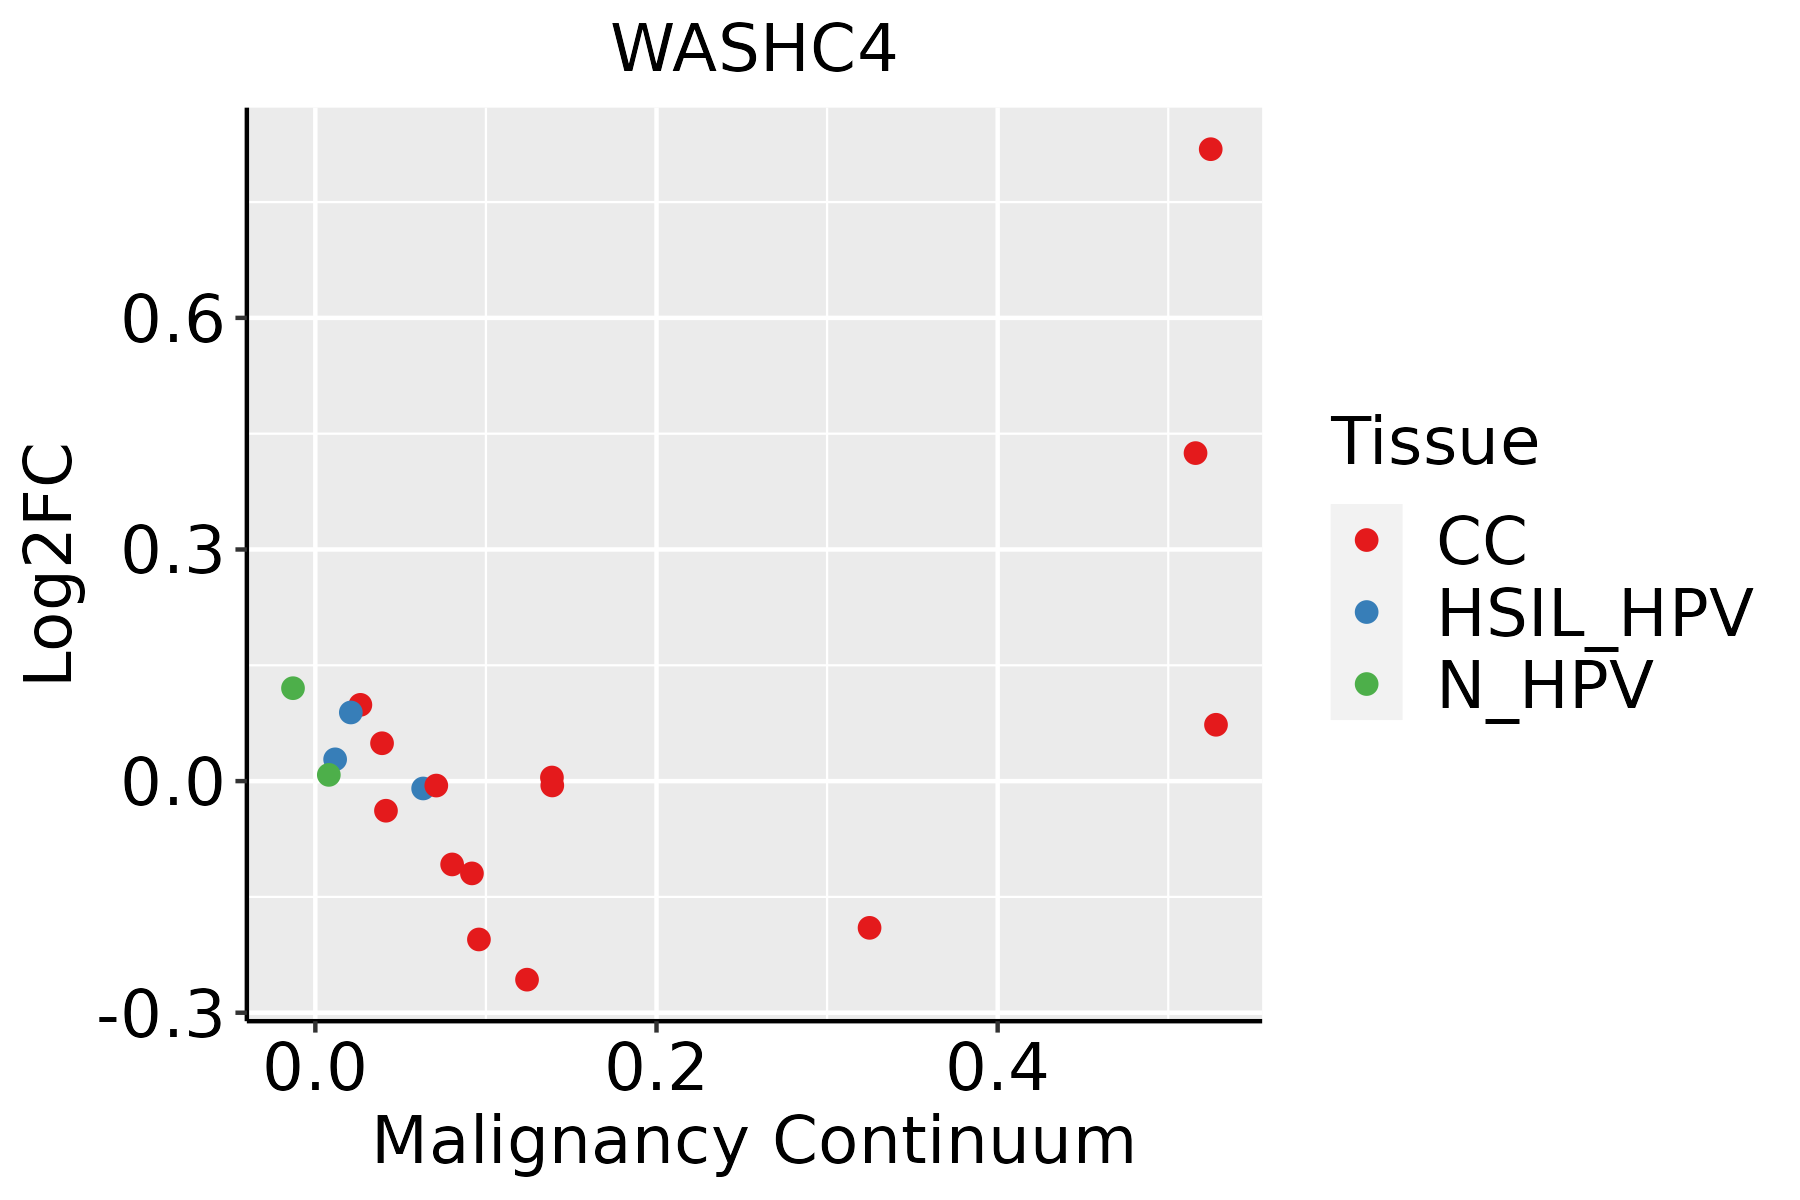 | CC: Cervix cancer |
| HSIL_HPV: HPV-infected high-grade squamous intraepithelial lesions | ||
| N_HPV: HPV-infected normal cervix | ||
| Liver |  | HCC: Hepatocellular carcinoma |
| NAFLD: Non-alcoholic fatty liver disease | ||
| Lung |  | AAH: Atypical adenomatous hyperplasia |
| AIS: Adenocarcinoma in situ | ||
| IAC: Invasive lung adenocarcinoma | ||
| MIA: Minimally invasive adenocarcinoma | ||
| Thyroid |  | ATC: Anaplastic thyroid cancer |
| HT: Hashimoto's thyroiditis | ||
| PTC: Papillary thyroid cancer |
| ∗log2FC in expression of this searched gene in stem-like cells from each diseased tissue sample relative to stem-like cells in normal samples in each tissue plotted against the malignancy continuum. Samples are colored based on if they are from different disease stage. |
Top |
Malignant transformation related pathway analysis |
| Find out the enriched GO biological processes and KEGG pathways involved in transition from healthy to precancer to cancer |
| Tissue | Disease Stage | Enriched GO biological Processes |
| Colorectum | AD |  |
| Colorectum | SER |  |
| Colorectum | MSS |  |
| Colorectum | MSI-H |  |
| Colorectum | FAP |  |
| ∗Top 15 enriched GO BP terms are showed in the bar plot of each disease state in each tissue. Each row represents a significant GO biological process which is colored according to the -log10(p.adjust). |
| Page: 1 2 3 4 5 6 7 8 9 |
| GO ID | Tissue | Disease Stage | Description | Gene Ratio | Bg Ratio | pvalue | p.adjust | Count |
| GO:00069139 | Cervix | CC | nucleocytoplasmic transport | 71/2311 | 301/18723 | 4.04e-08 | 2.54e-06 | 71 |
| GO:00511699 | Cervix | CC | nuclear transport | 71/2311 | 301/18723 | 4.04e-08 | 2.54e-06 | 71 |
| GO:00511689 | Cervix | CC | nuclear export | 38/2311 | 154/18723 | 1.86e-05 | 3.46e-04 | 38 |
| GO:00161977 | Cervix | CC | endosomal transport | 48/2311 | 230/18723 | 1.65e-04 | 1.97e-03 | 48 |
| GO:00160506 | Cervix | CC | vesicle organization | 54/2311 | 300/18723 | 2.71e-03 | 1.85e-02 | 54 |
| GO:00069137 | Liver | NAFLD | nucleocytoplasmic transport | 51/1882 | 301/18723 | 1.39e-04 | 2.62e-03 | 51 |
| GO:00511697 | Liver | NAFLD | nuclear transport | 51/1882 | 301/18723 | 1.39e-04 | 2.62e-03 | 51 |
| GO:00161975 | Liver | NAFLD | endosomal transport | 41/1882 | 230/18723 | 2.02e-04 | 3.53e-03 | 41 |
| GO:00160505 | Liver | NAFLD | vesicle organization | 50/1882 | 300/18723 | 2.42e-04 | 4.06e-03 | 50 |
| GO:00511687 | Liver | NAFLD | nuclear export | 28/1882 | 154/18723 | 1.42e-03 | 1.58e-02 | 28 |
| GO:001605011 | Liver | Cirrhotic | vesicle organization | 133/4634 | 300/18723 | 7.35e-14 | 6.41e-12 | 133 |
| GO:000691312 | Liver | Cirrhotic | nucleocytoplasmic transport | 118/4634 | 301/18723 | 1.71e-08 | 6.27e-07 | 118 |
| GO:005116912 | Liver | Cirrhotic | nuclear transport | 118/4634 | 301/18723 | 1.71e-08 | 6.27e-07 | 118 |
| GO:001619711 | Liver | Cirrhotic | endosomal transport | 93/4634 | 230/18723 | 1.01e-07 | 2.93e-06 | 93 |
| GO:005116812 | Liver | Cirrhotic | nuclear export | 67/4634 | 154/18723 | 2.57e-07 | 6.41e-06 | 67 |
| GO:00070325 | Liver | Cirrhotic | endosome organization | 41/4634 | 82/18723 | 6.91e-07 | 1.47e-05 | 41 |
| GO:000691322 | Liver | HCC | nucleocytoplasmic transport | 208/7958 | 301/18723 | 5.51e-21 | 8.12e-19 | 208 |
| GO:005116922 | Liver | HCC | nuclear transport | 208/7958 | 301/18723 | 5.51e-21 | 8.12e-19 | 208 |
| GO:001605021 | Liver | HCC | vesicle organization | 194/7958 | 300/18723 | 5.58e-15 | 3.97e-13 | 194 |
| GO:005116822 | Liver | HCC | nuclear export | 113/7958 | 154/18723 | 6.30e-15 | 4.39e-13 | 113 |
| Page: 1 2 3 |
| Pathway ID | Tissue | Disease Stage | Description | Gene Ratio | Bg Ratio | pvalue | p.adjust | qvalue | Count |
| hsa0414418 | Cervix | CC | Endocytosis | 64/1267 | 251/8465 | 6.97e-06 | 6.10e-05 | 3.61e-05 | 64 |
| hsa0414419 | Cervix | CC | Endocytosis | 64/1267 | 251/8465 | 6.97e-06 | 6.10e-05 | 3.61e-05 | 64 |
| hsa0414412 | Liver | Cirrhotic | Endocytosis | 119/2530 | 251/8465 | 2.33e-09 | 4.56e-08 | 2.81e-08 | 119 |
| hsa0414413 | Liver | Cirrhotic | Endocytosis | 119/2530 | 251/8465 | 2.33e-09 | 4.56e-08 | 2.81e-08 | 119 |
| hsa0414422 | Liver | HCC | Endocytosis | 178/4020 | 251/8465 | 2.03e-14 | 5.22e-13 | 2.91e-13 | 178 |
| hsa0414432 | Liver | HCC | Endocytosis | 178/4020 | 251/8465 | 2.03e-14 | 5.22e-13 | 2.91e-13 | 178 |
| hsa0414414 | Lung | IAC | Endocytosis | 51/1053 | 251/8465 | 2.25e-04 | 2.54e-03 | 1.68e-03 | 51 |
| hsa0414415 | Lung | IAC | Endocytosis | 51/1053 | 251/8465 | 2.25e-04 | 2.54e-03 | 1.68e-03 | 51 |
| hsa0414423 | Lung | AIS | Endocytosis | 52/961 | 251/8465 | 9.74e-06 | 3.04e-04 | 1.95e-04 | 52 |
| hsa0414433 | Lung | AIS | Endocytosis | 52/961 | 251/8465 | 9.74e-06 | 3.04e-04 | 1.95e-04 | 52 |
| Page: 1 |
Top |
Cell-cell communication analysis |
| Identification of potential cell-cell interactions between two cell types and their ligand-receptor pairs for different disease states |
| Ligand | Receptor | LRpair | Pathway | Tissue | Disease Stage |
| Page: 1 |
Top |
Single-cell gene regulatory network inference analysis |
| Find out the significant the regulons (TFs) and the target genes of each regulon across cell types for different disease states |
| TF | Cell Type | Tissue | Disease Stage | Target Gene | RSS | Regulon Activity |
| ∗The dot plots of a searched regulon are shown for all cell subpopulations in each disease state of each tissue based on the regulon specific score inferred using pySCENIC and by calculating the average expression. |
| Page: 1 |
Top |
Somatic mutation of malignant transformation related genes |
| Annotation of somatic variants for genes involved in malignant transformation |
| Hugo Symbol | Variant Class | Variant Classification | dbSNP RS | HGVSc | HGVSp | HGVSp Short | SWISSPROT | BIOTYPE | SIFT | PolyPhen | Tumor Sample Barcode | Tissue | Histology | Sex | Age | Stage | Therapy Types | Drugs | Outcome |
| WASHC4 | SNV | Missense_Mutation | novel | c.472G>T | p.Val158Leu | p.V158L | protein_coding | tolerated(0.17) | benign(0.028) | TCGA-A2-A25A-01 | Breast | breast invasive carcinoma | Female | <65 | I/II | Unspecific | Cytoxan | SD | |
| WASHC4 | SNV | Missense_Mutation | c.1418N>T | p.Ser473Leu | p.S473L | protein_coding | tolerated(0.29) | benign(0.007) | TCGA-A8-A06Q-01 | Breast | breast invasive carcinoma | Female | <65 | III/IV | Unknown | Unknown | SD | ||
| WASHC4 | SNV | Missense_Mutation | c.695N>T | p.Ser232Leu | p.S232L | protein_coding | tolerated(0.16) | benign(0.118) | TCGA-AC-A23H-01 | Breast | breast invasive carcinoma | Female | >=65 | I/II | Unknown | Unknown | PD | ||
| WASHC4 | SNV | Missense_Mutation | novel | c.88N>C | p.Asn30His | p.N30H | protein_coding | deleterious(0.02) | benign(0.023) | TCGA-AN-A046-01 | Breast | breast invasive carcinoma | Female | >=65 | I/II | Unknown | Unknown | SD | |
| WASHC4 | SNV | Missense_Mutation | rs773207031 | c.2948N>A | p.Arg983Gln | p.R983Q | protein_coding | tolerated(0.26) | benign(0.007) | TCGA-AN-A046-01 | Breast | breast invasive carcinoma | Female | >=65 | I/II | Unknown | Unknown | SD | |
| WASHC4 | SNV | Missense_Mutation | novel | c.1242N>A | p.Met414Ile | p.M414I | protein_coding | tolerated(0.19) | benign(0) | TCGA-BH-A0B6-01 | Breast | breast invasive carcinoma | Female | <65 | I/II | Unknown | Unknown | SD | |
| WASHC4 | SNV | Missense_Mutation | c.1186C>G | p.Gln396Glu | p.Q396E | protein_coding | tolerated(0.22) | benign(0.015) | TCGA-BH-A0DG-01 | Breast | breast invasive carcinoma | Female | <65 | I/II | Chemotherapy | taxotere | CR | ||
| WASHC4 | SNV | Missense_Mutation | c.3257N>A | p.Arg1086Lys | p.R1086K | protein_coding | tolerated(0.75) | benign(0) | TCGA-BH-A0W7-01 | Breast | breast invasive carcinoma | Female | <65 | I/II | Chemotherapy | taxotere | CR | ||
| WASHC4 | SNV | Missense_Mutation | c.2960N>G | p.Glu987Gly | p.E987G | protein_coding | deleterious(0.03) | possibly_damaging(0.447) | TCGA-BH-A18G-01 | Breast | breast invasive carcinoma | Female | >=65 | I/II | Unknown | Unknown | SD | ||
| WASHC4 | SNV | Missense_Mutation | c.2074C>G | p.His692Asp | p.H692D | protein_coding | deleterious(0.01) | benign(0.412) | TCGA-C8-A26Y-01 | Breast | breast invasive carcinoma | Female | >=65 | I/II | Unknown | Unknown | SD |
| Page: 1 2 3 4 5 6 7 8 9 10 11 |
Top |
Related drugs of malignant transformation related genes |
| Identification of chemicals and drugs interact with genes involved in malignant transfromation |
| (DGIdb 4.0) |
| Entrez ID | Symbol | Category | Interaction Types | Drug Claim Name | Drug Name | PMIDs |
| Page: 1 |

Copyright 2023-Present -The University of Texas Health Science Center at Houston |