
|
|||||
|
 | |
| |
| |
| |
| |
| |
|
Gene: WASHC3 |
Gene summary for WASHC3 |
| Gene information | Species | Human | Gene symbol | WASHC3 | Gene ID | 51019 |
| Gene name | WASH complex subunit 3 | |
| Gene Alias | CCDC53 | |
| Cytomap | 12q23.2 | |
| Gene Type | protein-coding | GO ID | GO:0006810 | UniProtAcc | F5GZ97 |
Top |
Malignant transformation analysis |
| Identification of the aberrant gene expression in precancerous and cancerous lesions by comparing the gene expression of stem-like cells in diseased tissues with normal stem cells |
| Entrez ID | Symbol | Replicates | Species | Organ | Tissue | Adj P-value | Log2FC | Malignancy |
| 51019 | WASHC3 | LZE2D | Human | Esophagus | HGIN | 3.64e-03 | 3.79e-01 | 0.0642 |
| 51019 | WASHC3 | LZE4T | Human | Esophagus | ESCC | 2.39e-17 | 4.15e-01 | 0.0811 |
| 51019 | WASHC3 | LZE5T | Human | Esophagus | ESCC | 1.40e-06 | 5.38e-01 | 0.0514 |
| 51019 | WASHC3 | LZE7T | Human | Esophagus | ESCC | 7.39e-21 | 8.57e-01 | 0.0667 |
| 51019 | WASHC3 | LZE8T | Human | Esophagus | ESCC | 4.82e-12 | 3.37e-01 | 0.067 |
| 51019 | WASHC3 | LZE20T | Human | Esophagus | ESCC | 3.61e-13 | 3.51e-01 | 0.0662 |
| 51019 | WASHC3 | LZE22D1 | Human | Esophagus | HGIN | 1.90e-05 | 2.38e-01 | 0.0595 |
| 51019 | WASHC3 | LZE22T | Human | Esophagus | ESCC | 1.57e-03 | 3.08e-01 | 0.068 |
| 51019 | WASHC3 | LZE24T | Human | Esophagus | ESCC | 4.72e-43 | 9.72e-01 | 0.0596 |
| 51019 | WASHC3 | LZE21T | Human | Esophagus | ESCC | 2.14e-10 | 4.49e-01 | 0.0655 |
| 51019 | WASHC3 | LZE6T | Human | Esophagus | ESCC | 7.09e-15 | 5.91e-01 | 0.0845 |
| 51019 | WASHC3 | HCC1 | Human | Liver | HCC | 5.00e-11 | 3.28e+00 | 0.5336 |
| 51019 | WASHC3 | HCC2 | Human | Liver | HCC | 4.50e-13 | 3.39e+00 | 0.5341 |
| 51019 | WASHC3 | S014 | Human | Liver | HCC | 1.16e-42 | 1.31e+00 | 0.2254 |
| 51019 | WASHC3 | S015 | Human | Liver | HCC | 1.10e-18 | 8.96e-01 | 0.2375 |
| 51019 | WASHC3 | S016 | Human | Liver | HCC | 3.42e-43 | 1.19e+00 | 0.2243 |
| 51019 | WASHC3 | S027 | Human | Liver | HCC | 1.97e-10 | 7.00e-01 | 0.2446 |
| 51019 | WASHC3 | S028 | Human | Liver | HCC | 1.23e-23 | 7.12e-01 | 0.2503 |
| 51019 | WASHC3 | S029 | Human | Liver | HCC | 1.84e-22 | 7.90e-01 | 0.2581 |
| 51019 | WASHC3 | male-WTA | Human | Thyroid | PTC | 3.62e-26 | 2.47e-01 | 0.1037 |
| Page: 1 2 |
| Tissue | Expression Dynamics | Abbreviation |
| Esophagus |  | ESCC: Esophageal squamous cell carcinoma |
| HGIN: High-grade intraepithelial neoplasias | ||
| LGIN: Low-grade intraepithelial neoplasias | ||
| Liver | 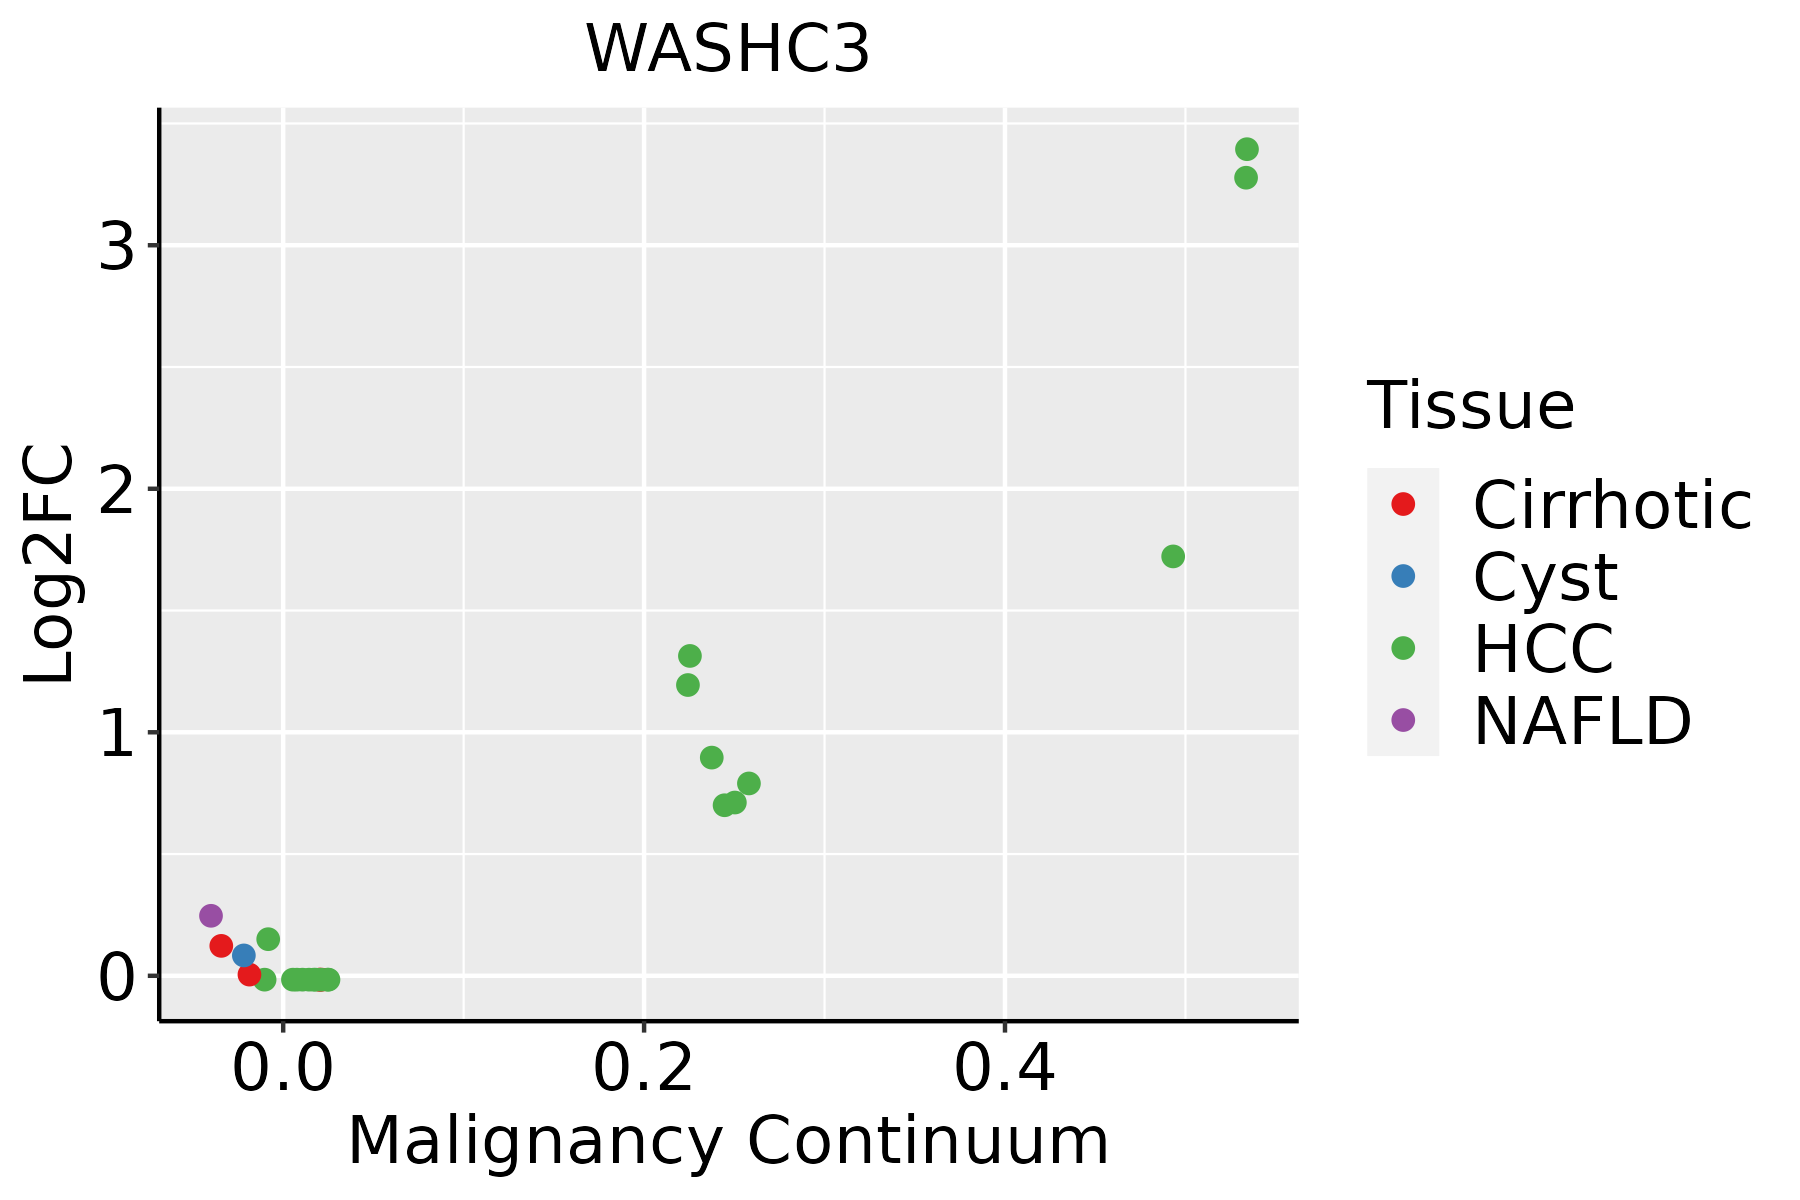 | HCC: Hepatocellular carcinoma |
| NAFLD: Non-alcoholic fatty liver disease | ||
| Thyroid | 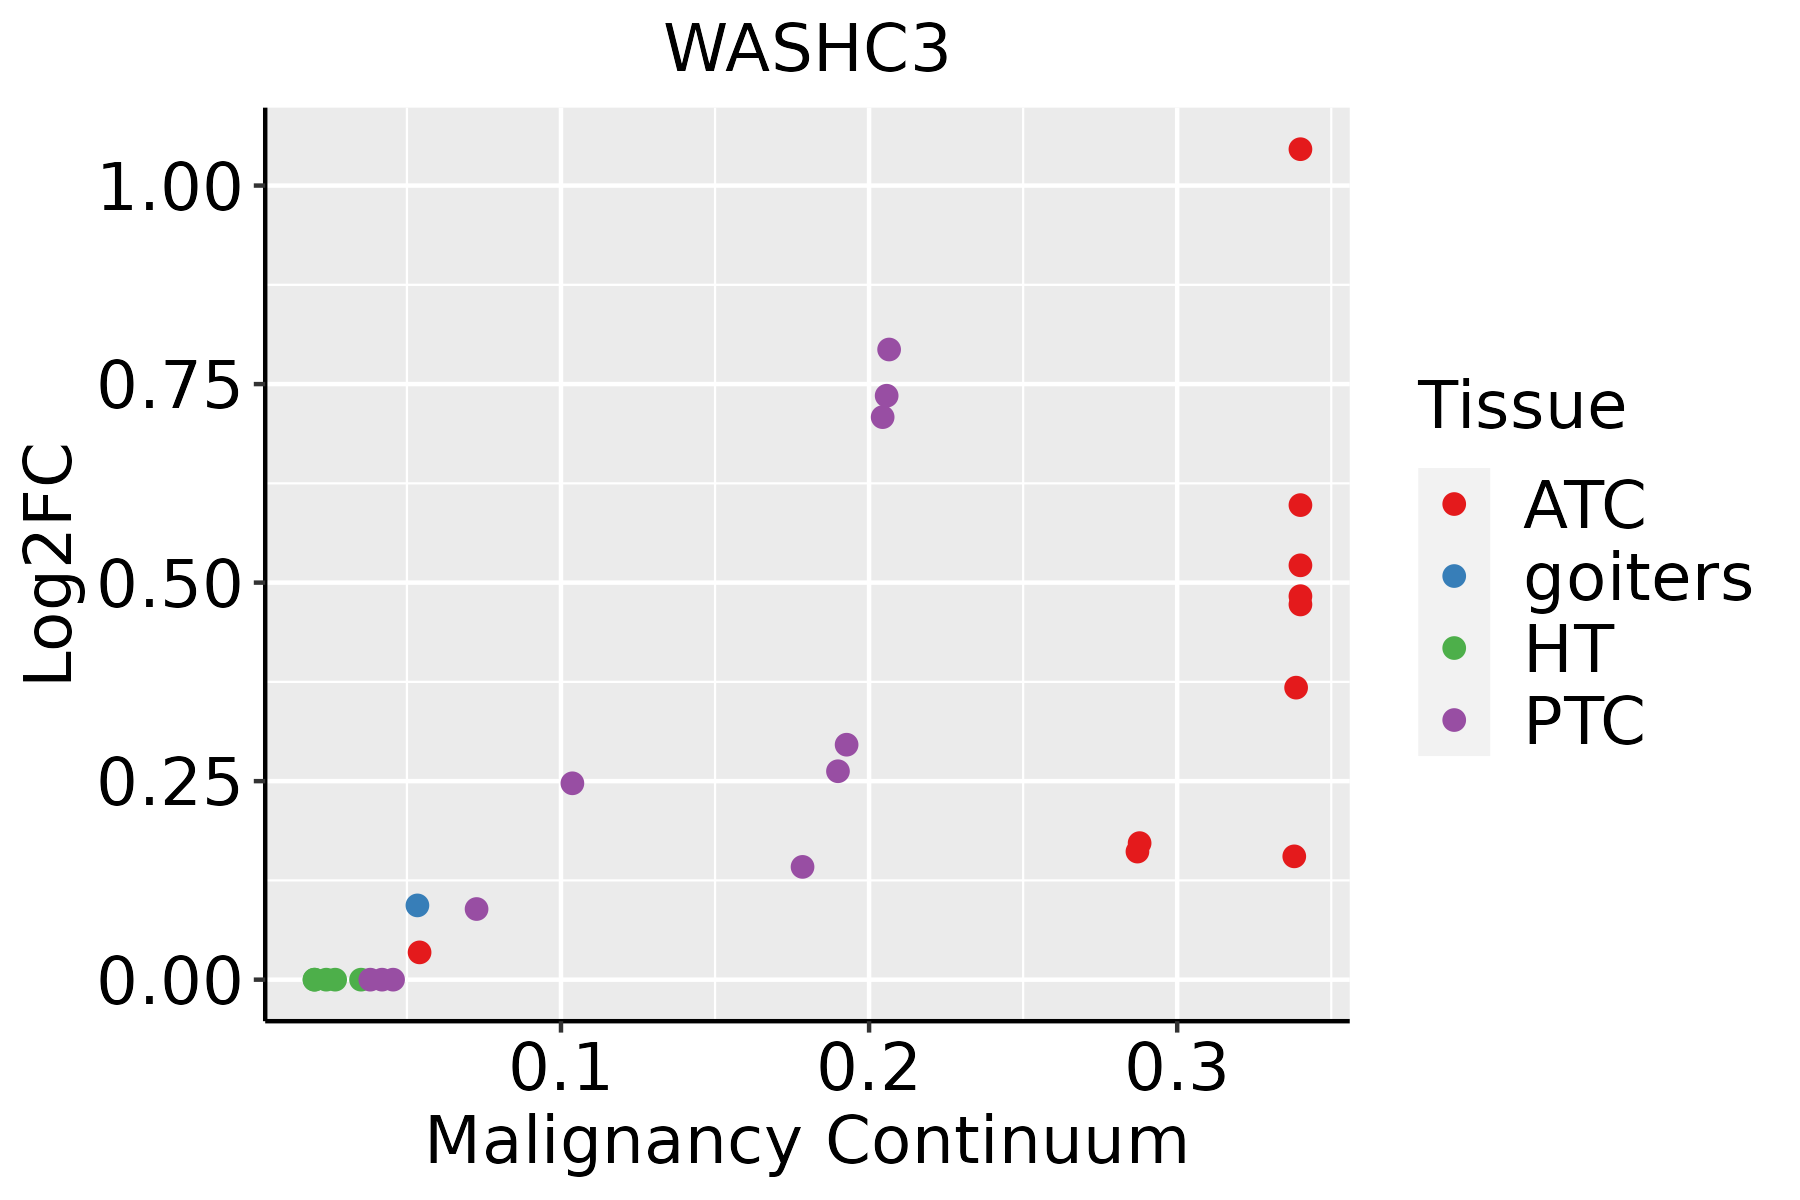 | ATC: Anaplastic thyroid cancer |
| HT: Hashimoto's thyroiditis | ||
| PTC: Papillary thyroid cancer |
| ∗log2FC in expression of this searched gene in stem-like cells from each diseased tissue sample relative to stem-like cells in normal samples in each tissue plotted against the malignancy continuum. Samples are colored based on if they are from different disease stage. |
Top |
Malignant transformation related pathway analysis |
| Find out the enriched GO biological processes and KEGG pathways involved in transition from healthy to precancer to cancer |
| Tissue | Disease Stage | Enriched GO biological Processes |
| Colorectum | AD |  |
| Colorectum | SER |  |
| Colorectum | MSS |  |
| Colorectum | MSI-H |  |
| Colorectum | FAP |  |
| ∗Top 15 enriched GO BP terms are showed in the bar plot of each disease state in each tissue. Each row represents a significant GO biological process which is colored according to the -log10(p.adjust). |
| Page: 1 2 3 4 5 6 7 8 9 |
| GO ID | Tissue | Disease Stage | Description | Gene Ratio | Bg Ratio | pvalue | p.adjust | Count |
| GO:005125826 | Esophagus | HGIN | protein polymerization | 66/2587 | 297/18723 | 4.96e-05 | 1.19e-03 | 66 |
| GO:003004120 | Esophagus | HGIN | actin filament polymerization | 40/2587 | 191/18723 | 4.29e-03 | 3.82e-02 | 40 |
| GO:0051258111 | Esophagus | ESCC | protein polymerization | 183/8552 | 297/18723 | 1.94e-08 | 3.75e-07 | 183 |
| GO:000701527 | Esophagus | ESCC | actin filament organization | 259/8552 | 442/18723 | 2.37e-08 | 4.50e-07 | 259 |
| GO:000815420 | Esophagus | ESCC | actin polymerization or depolymerization | 130/8552 | 218/18723 | 2.19e-05 | 1.88e-04 | 130 |
| GO:0030041110 | Esophagus | ESCC | actin filament polymerization | 114/8552 | 191/18723 | 6.46e-05 | 4.92e-04 | 114 |
| GO:005125822 | Liver | HCC | protein polymerization | 182/7958 | 297/18723 | 4.17e-11 | 1.58e-09 | 182 |
| GO:000701522 | Liver | HCC | actin filament organization | 252/7958 | 442/18723 | 3.83e-10 | 1.25e-08 | 252 |
| GO:000815422 | Liver | HCC | actin polymerization or depolymerization | 130/7958 | 218/18723 | 2.31e-07 | 4.14e-06 | 130 |
| GO:003004122 | Liver | HCC | actin filament polymerization | 116/7958 | 191/18723 | 2.66e-07 | 4.68e-06 | 116 |
| GO:0007015112 | Thyroid | PTC | actin filament organization | 225/5968 | 442/18723 | 3.76e-17 | 3.44e-15 | 225 |
| GO:0051258113 | Thyroid | PTC | protein polymerization | 154/5968 | 297/18723 | 5.35e-13 | 2.66e-11 | 154 |
| GO:000815426 | Thyroid | PTC | actin polymerization or depolymerization | 117/5968 | 218/18723 | 1.85e-11 | 7.21e-10 | 117 |
| GO:003004125 | Thyroid | PTC | actin filament polymerization | 99/5968 | 191/18723 | 7.40e-09 | 1.85e-07 | 99 |
| GO:0007015210 | Thyroid | ATC | actin filament organization | 227/6293 | 442/18723 | 5.96e-15 | 3.85e-13 | 227 |
| GO:005125829 | Thyroid | ATC | protein polymerization | 159/6293 | 297/18723 | 9.33e-13 | 3.96e-11 | 159 |
| GO:0008154111 | Thyroid | ATC | actin polymerization or depolymerization | 119/6293 | 218/18723 | 1.32e-10 | 4.08e-09 | 119 |
| GO:0030041111 | Thyroid | ATC | actin filament polymerization | 101/6293 | 191/18723 | 2.91e-08 | 5.50e-07 | 101 |
| Page: 1 |
| Pathway ID | Tissue | Disease Stage | Description | Gene Ratio | Bg Ratio | pvalue | p.adjust | qvalue | Count |
| hsa0414429 | Esophagus | HGIN | Endocytosis | 76/1383 | 251/8465 | 1.74e-08 | 3.34e-07 | 2.65e-07 | 76 |
| hsa04144113 | Esophagus | HGIN | Endocytosis | 76/1383 | 251/8465 | 1.74e-08 | 3.34e-07 | 2.65e-07 | 76 |
| hsa04144210 | Esophagus | ESCC | Endocytosis | 186/4205 | 251/8465 | 9.74e-16 | 4.66e-14 | 2.39e-14 | 186 |
| hsa0414437 | Esophagus | ESCC | Endocytosis | 186/4205 | 251/8465 | 9.74e-16 | 4.66e-14 | 2.39e-14 | 186 |
| hsa0414422 | Liver | HCC | Endocytosis | 178/4020 | 251/8465 | 2.03e-14 | 5.22e-13 | 2.91e-13 | 178 |
| hsa0414432 | Liver | HCC | Endocytosis | 178/4020 | 251/8465 | 2.03e-14 | 5.22e-13 | 2.91e-13 | 178 |
| Page: 1 |
Top |
Cell-cell communication analysis |
| Identification of potential cell-cell interactions between two cell types and their ligand-receptor pairs for different disease states |
| Ligand | Receptor | LRpair | Pathway | Tissue | Disease Stage |
| Page: 1 |
Top |
Single-cell gene regulatory network inference analysis |
| Find out the significant the regulons (TFs) and the target genes of each regulon across cell types for different disease states |
| TF | Cell Type | Tissue | Disease Stage | Target Gene | RSS | Regulon Activity |
| ∗The dot plots of a searched regulon are shown for all cell subpopulations in each disease state of each tissue based on the regulon specific score inferred using pySCENIC and by calculating the average expression. |
| Page: 1 |
Top |
Somatic mutation of malignant transformation related genes |
| Annotation of somatic variants for genes involved in malignant transformation |
| Hugo Symbol | Variant Class | Variant Classification | dbSNP RS | HGVSc | HGVSp | HGVSp Short | SWISSPROT | BIOTYPE | SIFT | PolyPhen | Tumor Sample Barcode | Tissue | Histology | Sex | Age | Stage | Therapy Types | Drugs | Outcome |
| WASHC3 | SNV | Missense_Mutation | novel | c.484N>A | p.Asp162Asn | p.D162N | Q9Y3C0 | protein_coding | tolerated(0.32) | benign(0.124) | TCGA-AN-A0FJ-01 | Breast | breast invasive carcinoma | Female | <65 | III/IV | Unknown | Unknown | SD |
| WASHC3 | SNV | Missense_Mutation | rs774556047 | c.172N>T | p.Arg58Cys | p.R58C | Q9Y3C0 | protein_coding | deleterious(0) | benign(0.411) | TCGA-C5-A1BQ-01 | Cervix | cervical & endocervical cancer | Female | >=65 | III/IV | Chemotherapy | cisplatin | CR |
| WASHC3 | SNV | Missense_Mutation | rs774556047 | c.172C>T | p.Arg58Cys | p.R58C | Q9Y3C0 | protein_coding | deleterious(0) | benign(0.411) | TCGA-FU-A3HZ-01 | Cervix | cervical & endocervical cancer | Female | <65 | I/II | Chemotherapy | cisplatin | CR |
| WASHC3 | SNV | Missense_Mutation | c.110C>T | p.Thr37Ile | p.T37I | Q9Y3C0 | protein_coding | deleterious(0) | probably_damaging(0.984) | TCGA-AD-6889-01 | Colorectum | colon adenocarcinoma | Male | >=65 | I/II | Chemotherapy | xeloda | PD | |
| WASHC3 | SNV | Missense_Mutation | rs774556047 | c.172N>T | p.Arg58Cys | p.R58C | Q9Y3C0 | protein_coding | deleterious(0) | benign(0.411) | TCGA-AG-A002-01 | Colorectum | rectum adenocarcinoma | Male | <65 | I/II | Unknown | Unknown | SD |
| WASHC3 | SNV | Missense_Mutation | rs774556047 | c.172C>T | p.Arg58Cys | p.R58C | Q9Y3C0 | protein_coding | deleterious(0) | benign(0.411) | TCGA-EI-6917-01 | Colorectum | rectum adenocarcinoma | Male | <65 | III/IV | Chemotherapy | 5fluorouracil+oxaciplatina+l-folinian | SD |
| WASHC3 | SNV | Missense_Mutation | c.69G>T | p.Gln23His | p.Q23H | Q9Y3C0 | protein_coding | tolerated(0.17) | benign(0.346) | TCGA-EI-6917-01 | Colorectum | rectum adenocarcinoma | Male | <65 | III/IV | Chemotherapy | 5fluorouracil+oxaciplatina+l-folinian | SD | |
| WASHC3 | SNV | Missense_Mutation | novel | c.175N>G | p.Ile59Val | p.I59V | Q9Y3C0 | protein_coding | tolerated(0.08) | probably_damaging(0.954) | TCGA-AP-A05O-01 | Endometrium | uterine corpus endometrioid carcinoma | Female | >=65 | I/II | Chemotherapy | carboplatin | PD |
| WASHC3 | SNV | Missense_Mutation | c.110N>T | p.Thr37Ile | p.T37I | Q9Y3C0 | protein_coding | deleterious(0) | probably_damaging(0.984) | TCGA-AP-A0LP-01 | Endometrium | uterine corpus endometrioid carcinoma | Female | >=65 | I/II | Hormone Therapy | megace | SD | |
| WASHC3 | SNV | Missense_Mutation | novel | c.250G>A | p.Val84Ile | p.V84I | Q9Y3C0 | protein_coding | tolerated(0.36) | benign(0.029) | TCGA-AX-A06F-01 | Endometrium | uterine corpus endometrioid carcinoma | Female | <65 | III/IV | Chemotherapy | carboplatin | SD |
| Page: 1 2 3 |
Top |
Related drugs of malignant transformation related genes |
| Identification of chemicals and drugs interact with genes involved in malignant transfromation |
| (DGIdb 4.0) |
| Entrez ID | Symbol | Category | Interaction Types | Drug Claim Name | Drug Name | PMIDs |
| Page: 1 |

Copyright 2023-Present -The University of Texas Health Science Center at Houston |