
|
|||||
|
 | |
| |
| |
| |
| |
| |
|
Gene: WASH1 |
Gene summary for WASH1 |
| Gene information | Species | Human | Gene symbol | WASH1 | Gene ID | 100287171 |
| Gene name | WASH complex subunit 1 | |
| Gene Alias | FAM39E | |
| Cytomap | 9p24.3 | |
| Gene Type | protein-coding | GO ID | GO:0006464 | UniProtAcc | A8K0Z3 |
Top |
Malignant transformation analysis |
| Identification of the aberrant gene expression in precancerous and cancerous lesions by comparing the gene expression of stem-like cells in diseased tissues with normal stem cells |
| Entrez ID | Symbol | Replicates | Species | Organ | Tissue | Adj P-value | Log2FC | Malignancy |
| 100287171 | WASH1 | C04 | Human | Oral cavity | OSCC | 2.09e-15 | 6.35e-01 | 0.2633 |
| 100287171 | WASH1 | C21 | Human | Oral cavity | OSCC | 3.11e-57 | 1.14e+00 | 0.2678 |
| 100287171 | WASH1 | C30 | Human | Oral cavity | OSCC | 1.10e-21 | 6.99e-01 | 0.3055 |
| 100287171 | WASH1 | C38 | Human | Oral cavity | OSCC | 4.70e-15 | 1.34e+00 | 0.172 |
| 100287171 | WASH1 | C43 | Human | Oral cavity | OSCC | 9.93e-19 | 3.95e-01 | 0.1704 |
| 100287171 | WASH1 | C46 | Human | Oral cavity | OSCC | 1.41e-34 | 7.00e-01 | 0.1673 |
| 100287171 | WASH1 | C51 | Human | Oral cavity | OSCC | 4.21e-15 | 6.50e-01 | 0.2674 |
| 100287171 | WASH1 | C57 | Human | Oral cavity | OSCC | 1.91e-13 | 4.33e-01 | 0.1679 |
| 100287171 | WASH1 | C06 | Human | Oral cavity | OSCC | 1.19e-06 | 7.38e-01 | 0.2699 |
| 100287171 | WASH1 | C07 | Human | Oral cavity | OSCC | 1.16e-05 | 1.05e+00 | 0.2491 |
| 100287171 | WASH1 | C08 | Human | Oral cavity | OSCC | 1.78e-34 | 6.80e-01 | 0.1919 |
| 100287171 | WASH1 | C09 | Human | Oral cavity | OSCC | 1.26e-17 | 4.60e-01 | 0.1431 |
| 100287171 | WASH1 | LN22 | Human | Oral cavity | OSCC | 1.14e-06 | 5.74e-01 | 0.1733 |
| 100287171 | WASH1 | LN38 | Human | Oral cavity | OSCC | 2.07e-06 | 7.43e-01 | 0.168 |
| 100287171 | WASH1 | LN46 | Human | Oral cavity | OSCC | 4.68e-15 | 5.74e-01 | 0.1666 |
| 100287171 | WASH1 | LP15 | Human | Oral cavity | LP | 2.53e-14 | 1.26e+00 | 0.2174 |
| 100287171 | WASH1 | LP17 | Human | Oral cavity | LP | 1.13e-02 | 5.67e-01 | 0.2349 |
| 100287171 | WASH1 | SYSMH1 | Human | Oral cavity | OSCC | 1.42e-06 | 1.10e-01 | 0.1127 |
| 100287171 | WASH1 | SYSMH2 | Human | Oral cavity | OSCC | 1.71e-02 | 1.73e-01 | 0.2326 |
| 100287171 | WASH1 | SYSMH3 | Human | Oral cavity | OSCC | 3.40e-04 | 1.66e-01 | 0.2442 |
| Page: 1 |
| Tissue | Expression Dynamics | Abbreviation |
| Oral Cavity | 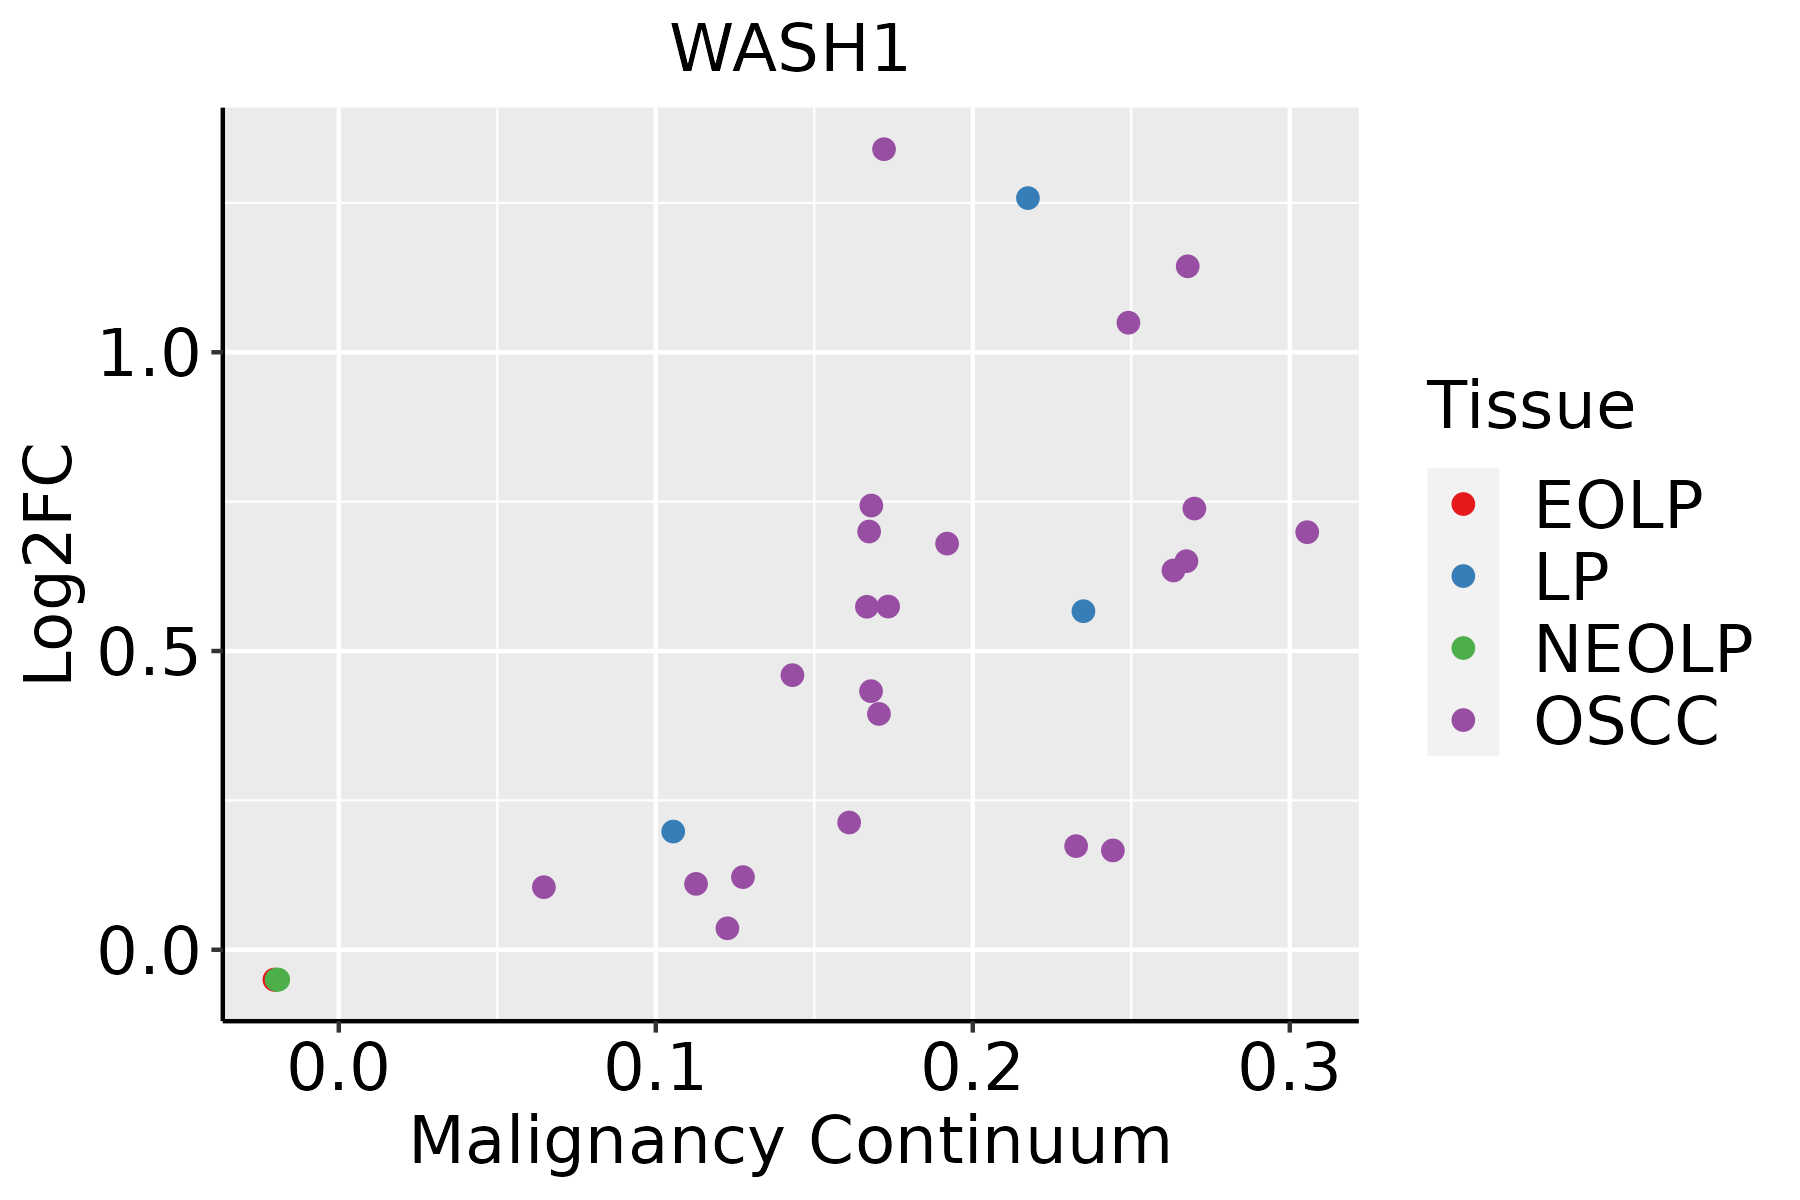 | EOLP: Erosive Oral lichen planus |
| LP: leukoplakia | ||
| NEOLP: Non-erosive oral lichen planus | ||
| OSCC: Oral squamous cell carcinoma |
| ∗log2FC in expression of this searched gene in stem-like cells from each diseased tissue sample relative to stem-like cells in normal samples in each tissue plotted against the malignancy continuum. Samples are colored based on if they are from different disease stage. |
Top |
Malignant transformation related pathway analysis |
| Find out the enriched GO biological processes and KEGG pathways involved in transition from healthy to precancer to cancer |
| Tissue | Disease Stage | Enriched GO biological Processes |
| Colorectum | AD |  |
| Colorectum | SER |  |
| Colorectum | MSS |  |
| Colorectum | MSI-H |  |
| Colorectum | FAP |  |
| ∗Top 15 enriched GO BP terms are showed in the bar plot of each disease state in each tissue. Each row represents a significant GO biological process which is colored according to the -log10(p.adjust). |
| Page: 1 2 3 4 5 6 7 8 9 |
| GO ID | Tissue | Disease Stage | Description | Gene Ratio | Bg Ratio | pvalue | p.adjust | Count |
| Page: 1 |
| Pathway ID | Tissue | Disease Stage | Description | Gene Ratio | Bg Ratio | pvalue | p.adjust | qvalue | Count |
| hsa0414418 | Cervix | CC | Endocytosis | 64/1267 | 251/8465 | 6.97e-06 | 6.10e-05 | 3.61e-05 | 64 |
| hsa0414419 | Cervix | CC | Endocytosis | 64/1267 | 251/8465 | 6.97e-06 | 6.10e-05 | 3.61e-05 | 64 |
| hsa0414429 | Esophagus | HGIN | Endocytosis | 76/1383 | 251/8465 | 1.74e-08 | 3.34e-07 | 2.65e-07 | 76 |
| hsa04144113 | Esophagus | HGIN | Endocytosis | 76/1383 | 251/8465 | 1.74e-08 | 3.34e-07 | 2.65e-07 | 76 |
| hsa04144210 | Esophagus | ESCC | Endocytosis | 186/4205 | 251/8465 | 9.74e-16 | 4.66e-14 | 2.39e-14 | 186 |
| hsa0414437 | Esophagus | ESCC | Endocytosis | 186/4205 | 251/8465 | 9.74e-16 | 4.66e-14 | 2.39e-14 | 186 |
| Page: 1 |
Top |
Cell-cell communication analysis |
| Identification of potential cell-cell interactions between two cell types and their ligand-receptor pairs for different disease states |
| Ligand | Receptor | LRpair | Pathway | Tissue | Disease Stage |
| Page: 1 |
Top |
Single-cell gene regulatory network inference analysis |
| Find out the significant the regulons (TFs) and the target genes of each regulon across cell types for different disease states |
| TF | Cell Type | Tissue | Disease Stage | Target Gene | RSS | Regulon Activity |
| ∗The dot plots of a searched regulon are shown for all cell subpopulations in each disease state of each tissue based on the regulon specific score inferred using pySCENIC and by calculating the average expression. |
| Page: 1 |
Top |
Somatic mutation of malignant transformation related genes |
| Annotation of somatic variants for genes involved in malignant transformation |
| Hugo Symbol | Variant Class | Variant Classification | dbSNP RS | HGVSc | HGVSp | HGVSp Short | SWISSPROT | BIOTYPE | SIFT | PolyPhen | Tumor Sample Barcode | Tissue | Histology | Sex | Age | Stage | Therapy Types | Drugs | Outcome |
| Page: 1 |
Top |
Related drugs of malignant transformation related genes |
| Identification of chemicals and drugs interact with genes involved in malignant transfromation |
| (DGIdb 4.0) |
| Entrez ID | Symbol | Category | Interaction Types | Drug Claim Name | Drug Name | PMIDs |
| Page: 1 |

Copyright 2023-Present -The University of Texas Health Science Center at Houston |