
|
|||||
|
 | |
| |
| |
| |
| |
| |
|
Gene: WASF3 |
Gene summary for WASF3 |
| Gene information | Species | Human | Gene symbol | WASF3 | Gene ID | 10810 |
| Gene name | WASP family member 3 | |
| Gene Alias | Brush-1 | |
| Cytomap | 13q12.13 | |
| Gene Type | protein-coding | GO ID | GO:0000902 | UniProtAcc | Q9UPY6 |
Top |
Malignant transformation analysis |
| Identification of the aberrant gene expression in precancerous and cancerous lesions by comparing the gene expression of stem-like cells in diseased tissues with normal stem cells |
| Entrez ID | Symbol | Replicates | Species | Organ | Tissue | Adj P-value | Log2FC | Malignancy |
| 10810 | WASF3 | NAFLD1 | Human | Liver | NAFLD | 6.02e-05 | 6.53e-01 | -0.04 |
| 10810 | WASF3 | HCC1_Meng | Human | Liver | HCC | 4.91e-27 | 2.44e-02 | 0.0246 |
| 10810 | WASF3 | HCC2 | Human | Liver | HCC | 1.66e-04 | 2.82e+00 | 0.5341 |
| 10810 | WASF3 | S015 | Human | Liver | HCC | 3.05e-07 | 4.14e-01 | 0.2375 |
| Page: 1 |
| Tissue | Expression Dynamics | Abbreviation |
| Liver | 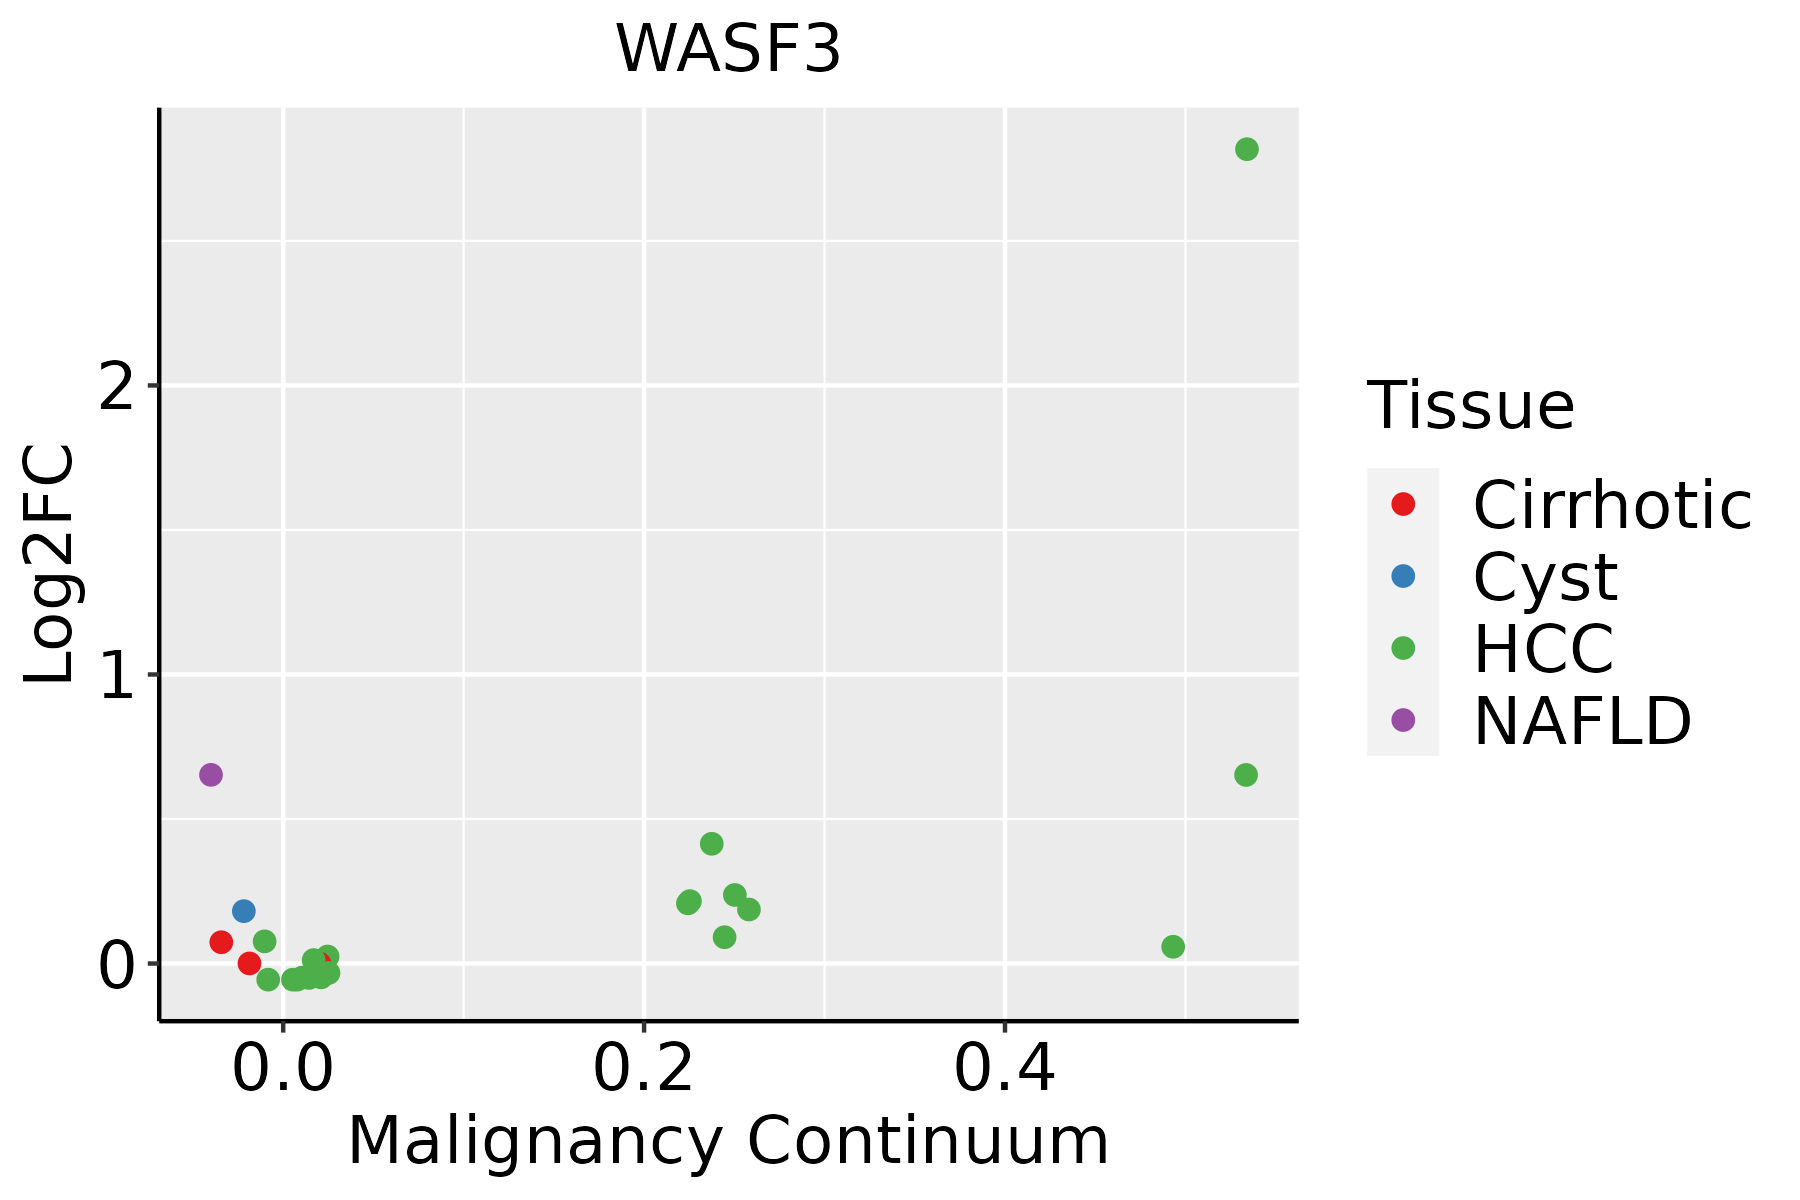 | HCC: Hepatocellular carcinoma |
| NAFLD: Non-alcoholic fatty liver disease |
| ∗log2FC in expression of this searched gene in stem-like cells from each diseased tissue sample relative to stem-like cells in normal samples in each tissue plotted against the malignancy continuum. Samples are colored based on if they are from different disease stage. |
Top |
Malignant transformation related pathway analysis |
| Find out the enriched GO biological processes and KEGG pathways involved in transition from healthy to precancer to cancer |
| Tissue | Disease Stage | Enriched GO biological Processes |
| Colorectum | AD |  |
| Colorectum | SER |  |
| Colorectum | MSS |  |
| Colorectum | MSI-H |  |
| Colorectum | FAP |  |
| ∗Top 15 enriched GO BP terms are showed in the bar plot of each disease state in each tissue. Each row represents a significant GO biological process which is colored according to the -log10(p.adjust). |
| Page: 1 2 3 4 5 6 7 8 9 |
| GO ID | Tissue | Disease Stage | Description | Gene Ratio | Bg Ratio | pvalue | p.adjust | Count |
| GO:00226047 | Liver | NAFLD | regulation of cell morphogenesis | 62/1882 | 309/18723 | 8.35e-08 | 7.09e-06 | 62 |
| GO:00070157 | Liver | NAFLD | actin filament organization | 78/1882 | 442/18723 | 5.44e-07 | 3.21e-05 | 78 |
| GO:19029037 | Liver | NAFLD | regulation of supramolecular fiber organization | 66/1882 | 383/18723 | 8.97e-06 | 2.96e-04 | 66 |
| GO:00329707 | Liver | NAFLD | regulation of actin filament-based process | 66/1882 | 397/18723 | 2.92e-05 | 7.72e-04 | 66 |
| GO:19029057 | Liver | NAFLD | positive regulation of supramolecular fiber organization | 40/1882 | 209/18723 | 4.88e-05 | 1.15e-03 | 40 |
| GO:00329567 | Liver | NAFLD | regulation of actin cytoskeleton organization | 60/1882 | 358/18723 | 5.20e-05 | 1.20e-03 | 60 |
| GO:00975816 | Liver | NAFLD | lamellipodium organization | 22/1882 | 90/18723 | 6.25e-05 | 1.37e-03 | 22 |
| GO:01100537 | Liver | NAFLD | regulation of actin filament organization | 49/1882 | 278/18723 | 6.88e-05 | 1.46e-03 | 49 |
| GO:2000601 | Liver | NAFLD | positive regulation of Arp2/3 complex-mediated actin nucleation | 6/1882 | 10/18723 | 1.50e-04 | 2.78e-03 | 6 |
| GO:00300324 | Liver | NAFLD | lamellipodium assembly | 18/1882 | 72/18723 | 2.09e-04 | 3.60e-03 | 18 |
| GO:00432547 | Liver | NAFLD | regulation of protein-containing complex assembly | 66/1882 | 428/18723 | 2.83e-04 | 4.53e-03 | 66 |
| GO:00512587 | Liver | NAFLD | protein polymerization | 49/1882 | 297/18723 | 3.54e-04 | 5.36e-03 | 49 |
| GO:00990103 | Liver | NAFLD | modification of postsynaptic structure | 7/1882 | 16/18723 | 5.17e-04 | 7.15e-03 | 7 |
| GO:00343153 | Liver | NAFLD | regulation of Arp2/3 complex-mediated actin nucleation | 8/1882 | 21/18723 | 6.29e-04 | 8.21e-03 | 8 |
| GO:00995633 | Liver | NAFLD | modification of synaptic structure | 8/1882 | 22/18723 | 9.02e-04 | 1.08e-02 | 8 |
| GO:00988852 | Liver | NAFLD | modification of postsynaptic actin cytoskeleton | 5/1882 | 10/18723 | 1.67e-03 | 1.74e-02 | 5 |
| GO:00322717 | Liver | NAFLD | regulation of protein polymerization | 38/1882 | 233/18723 | 1.90e-03 | 1.93e-02 | 38 |
| GO:00081547 | Liver | NAFLD | actin polymerization or depolymerization | 36/1882 | 218/18723 | 1.98e-03 | 1.98e-02 | 36 |
| GO:00514957 | Liver | NAFLD | positive regulation of cytoskeleton organization | 37/1882 | 226/18723 | 2.02e-03 | 2.00e-02 | 37 |
| GO:00511271 | Liver | NAFLD | positive regulation of actin nucleation | 6/1882 | 15/18723 | 2.30e-03 | 2.19e-02 | 6 |
| Page: 1 2 3 4 |
| Pathway ID | Tissue | Disease Stage | Description | Gene Ratio | Bg Ratio | pvalue | p.adjust | qvalue | Count |
| hsa0452014 | Liver | NAFLD | Adherens junction | 37/1043 | 93/8465 | 1.50e-11 | 1.64e-09 | 1.32e-09 | 37 |
| hsa0513214 | Liver | NAFLD | Salmonella infection | 55/1043 | 249/8465 | 8.48e-06 | 3.09e-04 | 2.49e-04 | 55 |
| hsa0513014 | Liver | NAFLD | Pathogenic Escherichia coli infection | 45/1043 | 197/8465 | 2.31e-05 | 6.88e-04 | 5.54e-04 | 45 |
| hsa0452015 | Liver | NAFLD | Adherens junction | 37/1043 | 93/8465 | 1.50e-11 | 1.64e-09 | 1.32e-09 | 37 |
| hsa0513215 | Liver | NAFLD | Salmonella infection | 55/1043 | 249/8465 | 8.48e-06 | 3.09e-04 | 2.49e-04 | 55 |
| hsa0513015 | Liver | NAFLD | Pathogenic Escherichia coli infection | 45/1043 | 197/8465 | 2.31e-05 | 6.88e-04 | 5.54e-04 | 45 |
| hsa0513242 | Liver | HCC | Salmonella infection | 178/4020 | 249/8465 | 5.90e-15 | 1.98e-13 | 1.10e-13 | 178 |
| hsa0513042 | Liver | HCC | Pathogenic Escherichia coli infection | 129/4020 | 197/8465 | 2.02e-07 | 2.50e-06 | 1.39e-06 | 129 |
| hsa0452042 | Liver | HCC | Adherens junction | 68/4020 | 93/8465 | 3.99e-07 | 4.46e-06 | 2.48e-06 | 68 |
| hsa0466610 | Liver | HCC | Fc gamma R-mediated phagocytosis | 58/4020 | 97/8465 | 9.65e-03 | 2.52e-02 | 1.40e-02 | 58 |
| hsa052316 | Liver | HCC | Choline metabolism in cancer | 57/4020 | 98/8465 | 2.14e-02 | 4.90e-02 | 2.72e-02 | 57 |
| hsa0513252 | Liver | HCC | Salmonella infection | 178/4020 | 249/8465 | 5.90e-15 | 1.98e-13 | 1.10e-13 | 178 |
| hsa0513052 | Liver | HCC | Pathogenic Escherichia coli infection | 129/4020 | 197/8465 | 2.02e-07 | 2.50e-06 | 1.39e-06 | 129 |
| hsa0452052 | Liver | HCC | Adherens junction | 68/4020 | 93/8465 | 3.99e-07 | 4.46e-06 | 2.48e-06 | 68 |
| hsa0466611 | Liver | HCC | Fc gamma R-mediated phagocytosis | 58/4020 | 97/8465 | 9.65e-03 | 2.52e-02 | 1.40e-02 | 58 |
| hsa0523111 | Liver | HCC | Choline metabolism in cancer | 57/4020 | 98/8465 | 2.14e-02 | 4.90e-02 | 2.72e-02 | 57 |
| Page: 1 |
Top |
Cell-cell communication analysis |
| Identification of potential cell-cell interactions between two cell types and their ligand-receptor pairs for different disease states |
| Ligand | Receptor | LRpair | Pathway | Tissue | Disease Stage |
| Page: 1 |
Top |
Single-cell gene regulatory network inference analysis |
| Find out the significant the regulons (TFs) and the target genes of each regulon across cell types for different disease states |
| TF | Cell Type | Tissue | Disease Stage | Target Gene | RSS | Regulon Activity |
| ∗The dot plots of a searched regulon are shown for all cell subpopulations in each disease state of each tissue based on the regulon specific score inferred using pySCENIC and by calculating the average expression. |
| Page: 1 |
Top |
Somatic mutation of malignant transformation related genes |
| Annotation of somatic variants for genes involved in malignant transformation |
| Hugo Symbol | Variant Class | Variant Classification | dbSNP RS | HGVSc | HGVSp | HGVSp Short | SWISSPROT | BIOTYPE | SIFT | PolyPhen | Tumor Sample Barcode | Tissue | Histology | Sex | Age | Stage | Therapy Types | Drugs | Outcome |
| WASF3 | SNV | Missense_Mutation | c.352N>G | p.Pro118Ala | p.P118A | Q9UPY6 | protein_coding | deleterious(0) | possibly_damaging(0.904) | TCGA-AC-A23H-01 | Breast | breast invasive carcinoma | Female | >=65 | I/II | Unknown | Unknown | PD | |
| WASF3 | SNV | Missense_Mutation | novel | c.203N>A | p.Ser68Tyr | p.S68Y | Q9UPY6 | protein_coding | deleterious(0) | probably_damaging(0.922) | TCGA-AN-A046-01 | Breast | breast invasive carcinoma | Female | >=65 | I/II | Unknown | Unknown | SD |
| WASF3 | SNV | Missense_Mutation | rs538866473 | c.1504N>A | p.Asp502Asn | p.D502N | Q9UPY6 | protein_coding | deleterious(0) | probably_damaging(0.99) | TCGA-AR-A0U3-01 | Breast | breast invasive carcinoma | Female | <65 | I/II | Chemotherapy | doxorubicin | SD |
| WASF3 | insertion | In_Frame_Ins | novel | c.1422_1423insAATCCAAGTATATGGGAATGTTTTTCTGCTGGTCTCATA | p.Val474_Ala475insAsnProSerIleTrpGluCysPheSerAlaGlyLeuIle | p.V474_A475insNPSIWECFSAGLI | Q9UPY6 | protein_coding | TCGA-A8-A06Q-01 | Breast | breast invasive carcinoma | Female | <65 | III/IV | Unknown | Unknown | SD | ||
| WASF3 | deletion | Frame_Shift_Del | rs764375036 | c.920delC | p.Pro307ArgfsTer28 | p.P307Rfs*28 | Q9UPY6 | protein_coding | TCGA-AN-A0AK-01 | Breast | breast invasive carcinoma | Female | >=65 | I/II | Unknown | Unknown | SD | ||
| WASF3 | SNV | Missense_Mutation | novel | c.1006N>A | p.Glu336Lys | p.E336K | Q9UPY6 | protein_coding | tolerated(0.2) | benign(0.074) | TCGA-VS-A8EK-01 | Cervix | cervical & endocervical cancer | Female | >=65 | I/II | Chemotherapy | cisplatin | PD |
| WASF3 | SNV | Missense_Mutation | c.853G>C | p.Glu285Gln | p.E285Q | Q9UPY6 | protein_coding | tolerated(0.25) | benign(0.424) | TCGA-VS-AA62-01 | Cervix | cervical & endocervical cancer | Female | <65 | I/II | Chemotherapy | cisplatin | PD | |
| WASF3 | SNV | Missense_Mutation | novel | c.1367N>G | p.Lys456Arg | p.K456R | Q9UPY6 | protein_coding | deleterious(0.04) | benign(0.193) | TCGA-5M-AAT6-01 | Colorectum | colon adenocarcinoma | Female | <65 | III/IV | Unknown | Unknown | PD |
| WASF3 | SNV | Missense_Mutation | c.471N>A | p.Phe157Leu | p.F157L | Q9UPY6 | protein_coding | deleterious(0.01) | probably_damaging(0.999) | TCGA-AA-3510-01 | Colorectum | colon adenocarcinoma | Male | >=65 | I/II | Unknown | Unknown | SD | |
| WASF3 | SNV | Missense_Mutation | rs770387834 | c.845N>T | p.Ala282Val | p.A282V | Q9UPY6 | protein_coding | tolerated(0.31) | benign(0) | TCGA-AZ-4315-01 | Colorectum | colon adenocarcinoma | Male | <65 | I/II | Unknown | Unknown | SD |
| Page: 1 2 3 4 5 6 7 8 9 10 11 12 |
Top |
Related drugs of malignant transformation related genes |
| Identification of chemicals and drugs interact with genes involved in malignant transfromation |
| (DGIdb 4.0) |
| Entrez ID | Symbol | Category | Interaction Types | Drug Claim Name | Drug Name | PMIDs |
| Page: 1 |

Copyright 2023-Present -The University of Texas Health Science Center at Houston |