
|
|||||
|
 | |
| |
| |
| |
| |
| |
|
Gene: WARS2 |
Gene summary for WARS2 |
| Gene information | Species | Human | Gene symbol | WARS2 | Gene ID | 10352 |
| Gene name | tryptophanyl tRNA synthetase 2, mitochondrial | |
| Gene Alias | NEMMLAS | |
| Cytomap | 1p12 | |
| Gene Type | protein-coding | GO ID | GO:0000959 | UniProtAcc | Q9UGM6 |
Top |
Malignant transformation analysis |
| Identification of the aberrant gene expression in precancerous and cancerous lesions by comparing the gene expression of stem-like cells in diseased tissues with normal stem cells |
| Entrez ID | Symbol | Replicates | Species | Organ | Tissue | Adj P-value | Log2FC | Malignancy |
| 10352 | WARS2 | LZE4T | Human | Esophagus | ESCC | 1.73e-07 | 1.98e-01 | 0.0811 |
| 10352 | WARS2 | LZE24T | Human | Esophagus | ESCC | 7.23e-07 | 1.85e-01 | 0.0596 |
| 10352 | WARS2 | P1T-E | Human | Esophagus | ESCC | 6.15e-06 | 2.42e-01 | 0.0875 |
| 10352 | WARS2 | P2T-E | Human | Esophagus | ESCC | 8.54e-27 | 3.76e-01 | 0.1177 |
| 10352 | WARS2 | P4T-E | Human | Esophagus | ESCC | 6.84e-16 | 3.56e-01 | 0.1323 |
| 10352 | WARS2 | P5T-E | Human | Esophagus | ESCC | 3.60e-13 | 1.77e-01 | 0.1327 |
| 10352 | WARS2 | P8T-E | Human | Esophagus | ESCC | 7.44e-18 | 2.05e-01 | 0.0889 |
| 10352 | WARS2 | P9T-E | Human | Esophagus | ESCC | 2.63e-07 | 1.55e-01 | 0.1131 |
| 10352 | WARS2 | P10T-E | Human | Esophagus | ESCC | 1.07e-24 | 3.42e-01 | 0.116 |
| 10352 | WARS2 | P12T-E | Human | Esophagus | ESCC | 7.18e-21 | 2.83e-01 | 0.1122 |
| 10352 | WARS2 | P15T-E | Human | Esophagus | ESCC | 4.08e-14 | 1.66e-01 | 0.1149 |
| 10352 | WARS2 | P16T-E | Human | Esophagus | ESCC | 1.52e-17 | 2.23e-01 | 0.1153 |
| 10352 | WARS2 | P20T-E | Human | Esophagus | ESCC | 2.88e-14 | 2.02e-01 | 0.1124 |
| 10352 | WARS2 | P21T-E | Human | Esophagus | ESCC | 1.40e-31 | 4.82e-01 | 0.1617 |
| 10352 | WARS2 | P22T-E | Human | Esophagus | ESCC | 2.37e-28 | 2.30e-01 | 0.1236 |
| 10352 | WARS2 | P23T-E | Human | Esophagus | ESCC | 4.49e-27 | 6.40e-01 | 0.108 |
| 10352 | WARS2 | P24T-E | Human | Esophagus | ESCC | 1.36e-18 | 5.82e-01 | 0.1287 |
| 10352 | WARS2 | P26T-E | Human | Esophagus | ESCC | 3.39e-27 | 3.68e-01 | 0.1276 |
| 10352 | WARS2 | P27T-E | Human | Esophagus | ESCC | 3.80e-12 | 1.08e-01 | 0.1055 |
| 10352 | WARS2 | P28T-E | Human | Esophagus | ESCC | 4.27e-15 | 1.88e-01 | 0.1149 |
| Page: 1 2 3 |
| Tissue | Expression Dynamics | Abbreviation |
| Esophagus | 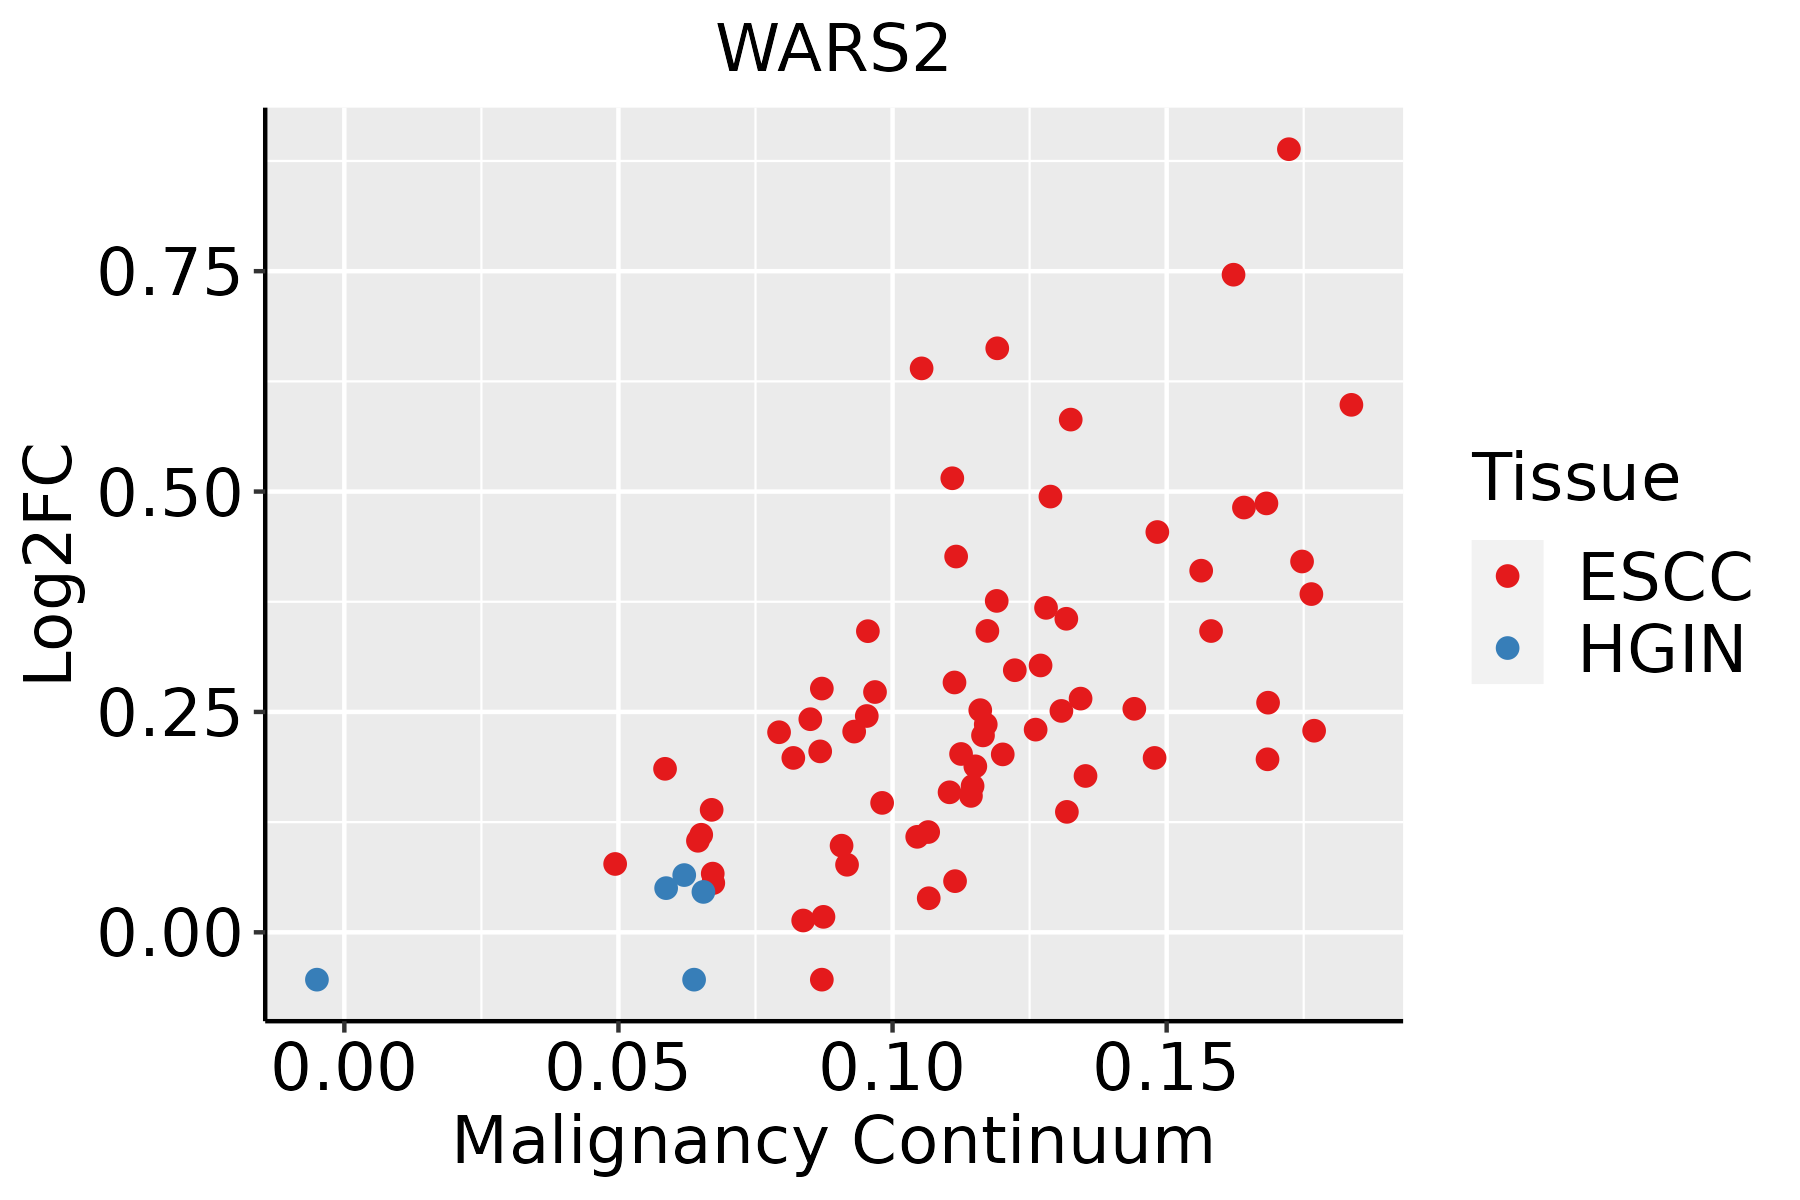 | ESCC: Esophageal squamous cell carcinoma |
| HGIN: High-grade intraepithelial neoplasias | ||
| LGIN: Low-grade intraepithelial neoplasias |
| ∗log2FC in expression of this searched gene in stem-like cells from each diseased tissue sample relative to stem-like cells in normal samples in each tissue plotted against the malignancy continuum. Samples are colored based on if they are from different disease stage. |
Top |
Malignant transformation related pathway analysis |
| Find out the enriched GO biological processes and KEGG pathways involved in transition from healthy to precancer to cancer |
| Tissue | Disease Stage | Enriched GO biological Processes |
| Colorectum | AD |  |
| Colorectum | SER |  |
| Colorectum | MSS |  |
| Colorectum | MSI-H |  |
| Colorectum | FAP |  |
| ∗Top 15 enriched GO BP terms are showed in the bar plot of each disease state in each tissue. Each row represents a significant GO biological process which is colored according to the -log10(p.adjust). |
| Page: 1 2 3 4 5 6 7 8 9 |
| GO ID | Tissue | Disease Stage | Description | Gene Ratio | Bg Ratio | pvalue | p.adjust | Count |
| GO:003466012 | Esophagus | ESCC | ncRNA metabolic process | 346/8552 | 485/18723 | 4.35e-31 | 2.51e-28 | 346 |
| GO:014005313 | Esophagus | ESCC | mitochondrial gene expression | 93/8552 | 108/18723 | 1.96e-18 | 2.03e-16 | 93 |
| GO:003254314 | Esophagus | ESCC | mitochondrial translation | 68/8552 | 76/18723 | 1.02e-15 | 6.86e-14 | 68 |
| GO:00063992 | Esophagus | ESCC | tRNA metabolic process | 122/8552 | 179/18723 | 9.03e-10 | 2.19e-08 | 122 |
| GO:00009592 | Esophagus | ESCC | mitochondrial RNA metabolic process | 39/8552 | 49/18723 | 1.20e-06 | 1.49e-05 | 39 |
| Page: 1 |
| Pathway ID | Tissue | Disease Stage | Description | Gene Ratio | Bg Ratio | pvalue | p.adjust | qvalue | Count |
| Page: 1 |
Top |
Cell-cell communication analysis |
| Identification of potential cell-cell interactions between two cell types and their ligand-receptor pairs for different disease states |
| Ligand | Receptor | LRpair | Pathway | Tissue | Disease Stage |
| Page: 1 |
Top |
Single-cell gene regulatory network inference analysis |
| Find out the significant the regulons (TFs) and the target genes of each regulon across cell types for different disease states |
| TF | Cell Type | Tissue | Disease Stage | Target Gene | RSS | Regulon Activity |
| ∗The dot plots of a searched regulon are shown for all cell subpopulations in each disease state of each tissue based on the regulon specific score inferred using pySCENIC and by calculating the average expression. |
| Page: 1 |
Top |
Somatic mutation of malignant transformation related genes |
| Annotation of somatic variants for genes involved in malignant transformation |
| Hugo Symbol | Variant Class | Variant Classification | dbSNP RS | HGVSc | HGVSp | HGVSp Short | SWISSPROT | BIOTYPE | SIFT | PolyPhen | Tumor Sample Barcode | Tissue | Histology | Sex | Age | Stage | Therapy Types | Drugs | Outcome |
| WARS2 | SNV | Missense_Mutation | c.877C>A | p.Arg293Ser | p.R293S | Q9UGM6 | protein_coding | tolerated(0.08) | benign(0.015) | TCGA-A2-A25A-01 | Breast | breast invasive carcinoma | Female | <65 | I/II | Unspecific | Cytoxan | SD | |
| WARS2 | SNV | Missense_Mutation | c.14C>T | p.Ser5Leu | p.S5L | Q9UGM6 | protein_coding | tolerated_low_confidence(0.6) | benign(0) | TCGA-FU-A3TX-01 | Cervix | cervical & endocervical cancer | Female | >=65 | I/II | Unknown | Unknown | SD | |
| WARS2 | SNV | Missense_Mutation | rs753188889 | c.317N>T | p.Pro106Leu | p.P106L | Q9UGM6 | protein_coding | deleterious(0) | probably_damaging(0.995) | TCGA-A6-3809-01 | Colorectum | colon adenocarcinoma | Female | >=65 | I/II | Unknown | Unknown | SD |
| WARS2 | SNV | Missense_Mutation | novel | c.224A>G | p.Asp75Gly | p.D75G | Q9UGM6 | protein_coding | tolerated(0.08) | possibly_damaging(0.788) | TCGA-AA-3864-01 | Colorectum | colon adenocarcinoma | Male | >=65 | I/II | Unknown | Unknown | SD |
| WARS2 | SNV | Missense_Mutation | c.712N>A | p.Val238Ile | p.V238I | Q9UGM6 | protein_coding | tolerated(1) | benign(0.009) | TCGA-AA-3968-01 | Colorectum | colon adenocarcinoma | Female | <65 | I/II | Unknown | Unknown | SD | |
| WARS2 | SNV | Missense_Mutation | rs750645277 | c.694C>A | p.Pro232Thr | p.P232T | Q9UGM6 | protein_coding | tolerated(0.07) | benign(0.444) | TCGA-AZ-4615-01 | Colorectum | colon adenocarcinoma | Male | >=65 | III/IV | Chemotherapy | xeloda | PD |
| WARS2 | SNV | Missense_Mutation | novel | c.1064N>C | p.Lys355Thr | p.K355T | Q9UGM6 | protein_coding | tolerated(0.05) | benign(0.027) | TCGA-CA-6717-01 | Colorectum | colon adenocarcinoma | Male | <65 | I/II | Chemotherapy | oxaliplatin | CR |
| WARS2 | SNV | Missense_Mutation | c.842N>T | p.Ala281Val | p.A281V | Q9UGM6 | protein_coding | tolerated(0.14) | possibly_damaging(0.581) | TCGA-D5-6927-01 | Colorectum | colon adenocarcinoma | Male | <65 | I/II | Unknown | Unknown | SD | |
| WARS2 | SNV | Missense_Mutation | rs765994519 | c.755N>A | p.Arg252His | p.R252H | Q9UGM6 | protein_coding | deleterious(0) | probably_damaging(0.985) | TCGA-DM-A28F-01 | Colorectum | colon adenocarcinoma | Male | >=65 | III/IV | Unknown | Unknown | SD |
| WARS2 | SNV | Missense_Mutation | novel | c.102G>T | p.Lys34Asn | p.K34N | Q9UGM6 | protein_coding | tolerated(0.5) | benign(0.015) | TCGA-AG-A002-01 | Colorectum | rectum adenocarcinoma | Male | <65 | I/II | Unknown | Unknown | SD |
| Page: 1 2 3 4 5 6 7 |
Top |
Related drugs of malignant transformation related genes |
| Identification of chemicals and drugs interact with genes involved in malignant transfromation |
| (DGIdb 4.0) |
| Entrez ID | Symbol | Category | Interaction Types | Drug Claim Name | Drug Name | PMIDs |
| Page: 1 |

Copyright 2023-Present -The University of Texas Health Science Center at Houston |