
|
|||||
|
 | |
| |
| |
| |
| |
| |
|
Gene: WAPL |
Gene summary for WAPL |
| Gene information | Species | Human | Gene symbol | WAPL | Gene ID | 23063 |
| Gene name | WAPL cohesin release factor | |
| Gene Alias | FOE | |
| Cytomap | 10q23.2 | |
| Gene Type | protein-coding | GO ID | GO:0000278 | UniProtAcc | A8K273 |
Top |
Malignant transformation analysis |
| Identification of the aberrant gene expression in precancerous and cancerous lesions by comparing the gene expression of stem-like cells in diseased tissues with normal stem cells |
| Entrez ID | Symbol | Replicates | Species | Organ | Tissue | Adj P-value | Log2FC | Malignancy |
| 23063 | WAPL | HTA11_3410_2000001011 | Human | Colorectum | AD | 4.20e-06 | -3.64e-01 | 0.0155 |
| 23063 | WAPL | HTA11_7696_3000711011 | Human | Colorectum | AD | 1.34e-02 | -3.47e-01 | 0.0674 |
| 23063 | WAPL | F007 | Human | Colorectum | FAP | 4.72e-05 | -3.11e-01 | 0.1176 |
| 23063 | WAPL | A002-C-010 | Human | Colorectum | FAP | 9.44e-04 | -2.38e-01 | 0.242 |
| 23063 | WAPL | A001-C-207 | Human | Colorectum | FAP | 3.31e-02 | -2.28e-01 | 0.1278 |
| 23063 | WAPL | A015-C-203 | Human | Colorectum | FAP | 1.57e-18 | -2.51e-01 | -0.1294 |
| 23063 | WAPL | A015-C-204 | Human | Colorectum | FAP | 1.15e-06 | -2.36e-01 | -0.0228 |
| 23063 | WAPL | A014-C-040 | Human | Colorectum | FAP | 3.02e-02 | -2.48e-01 | -0.1184 |
| 23063 | WAPL | A002-C-201 | Human | Colorectum | FAP | 2.69e-12 | -2.72e-01 | 0.0324 |
| 23063 | WAPL | A002-C-203 | Human | Colorectum | FAP | 1.28e-04 | -2.03e-01 | 0.2786 |
| 23063 | WAPL | A001-C-119 | Human | Colorectum | FAP | 6.53e-06 | -3.70e-01 | -0.1557 |
| 23063 | WAPL | A001-C-108 | Human | Colorectum | FAP | 2.50e-10 | -2.30e-01 | -0.0272 |
| 23063 | WAPL | A002-C-205 | Human | Colorectum | FAP | 3.53e-22 | -3.78e-01 | -0.1236 |
| 23063 | WAPL | A015-C-005 | Human | Colorectum | FAP | 3.50e-05 | -2.13e-01 | -0.0336 |
| 23063 | WAPL | A015-C-006 | Human | Colorectum | FAP | 2.55e-15 | -3.05e-01 | -0.0994 |
| 23063 | WAPL | A015-C-106 | Human | Colorectum | FAP | 3.20e-08 | -2.19e-01 | -0.0511 |
| 23063 | WAPL | A002-C-114 | Human | Colorectum | FAP | 1.81e-16 | -2.38e-01 | -0.1561 |
| 23063 | WAPL | A015-C-104 | Human | Colorectum | FAP | 2.18e-19 | -2.68e-01 | -0.1899 |
| 23063 | WAPL | A001-C-014 | Human | Colorectum | FAP | 1.22e-09 | -1.95e-01 | 0.0135 |
| 23063 | WAPL | A002-C-016 | Human | Colorectum | FAP | 2.91e-15 | -3.33e-01 | 0.0521 |
| Page: 1 2 3 4 5 6 7 8 |
| Tissue | Expression Dynamics | Abbreviation |
| Colorectum (GSE201348) |  | FAP: Familial adenomatous polyposis |
| CRC: Colorectal cancer | ||
| Colorectum (HTA11) | 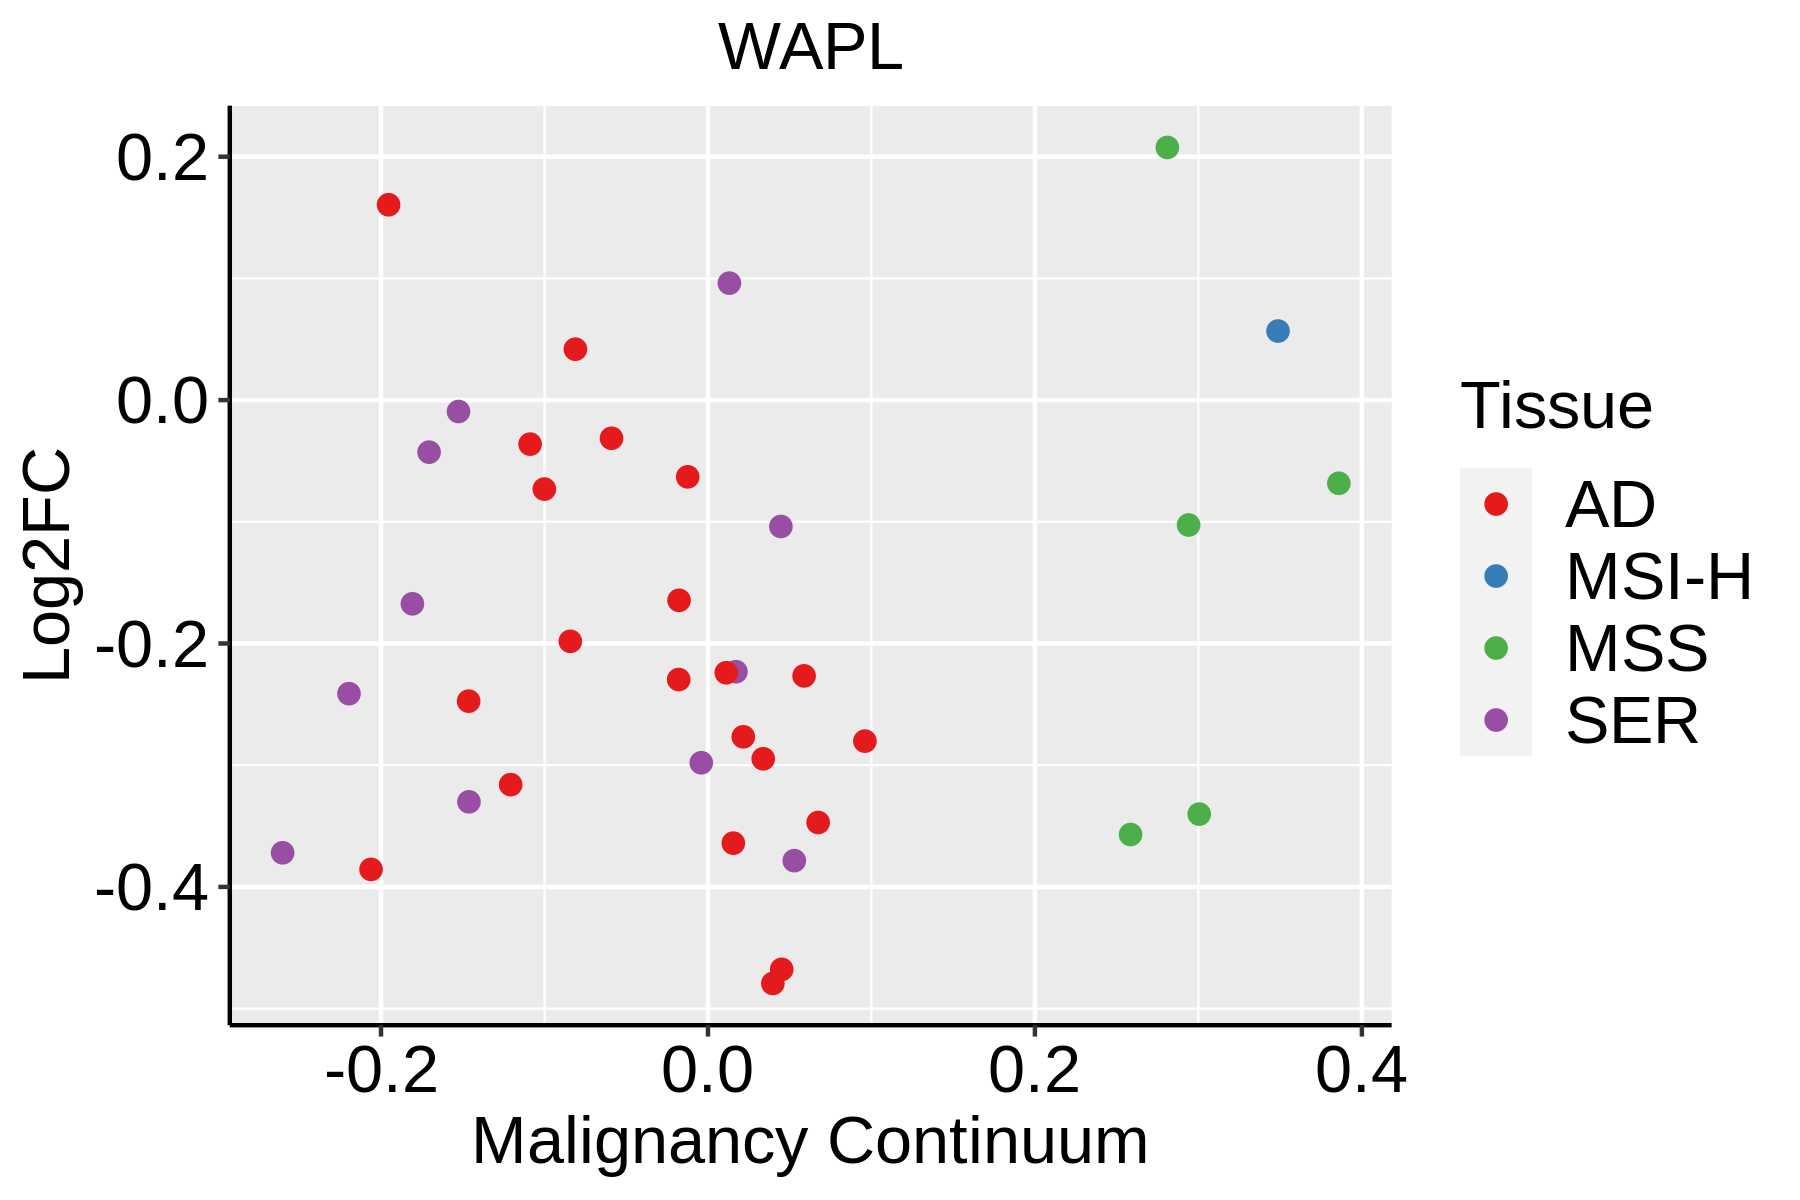 | AD: Adenomas |
| SER: Sessile serrated lesions | ||
| MSI-H: Microsatellite-high colorectal cancer | ||
| MSS: Microsatellite stable colorectal cancer | ||
| Endometrium | 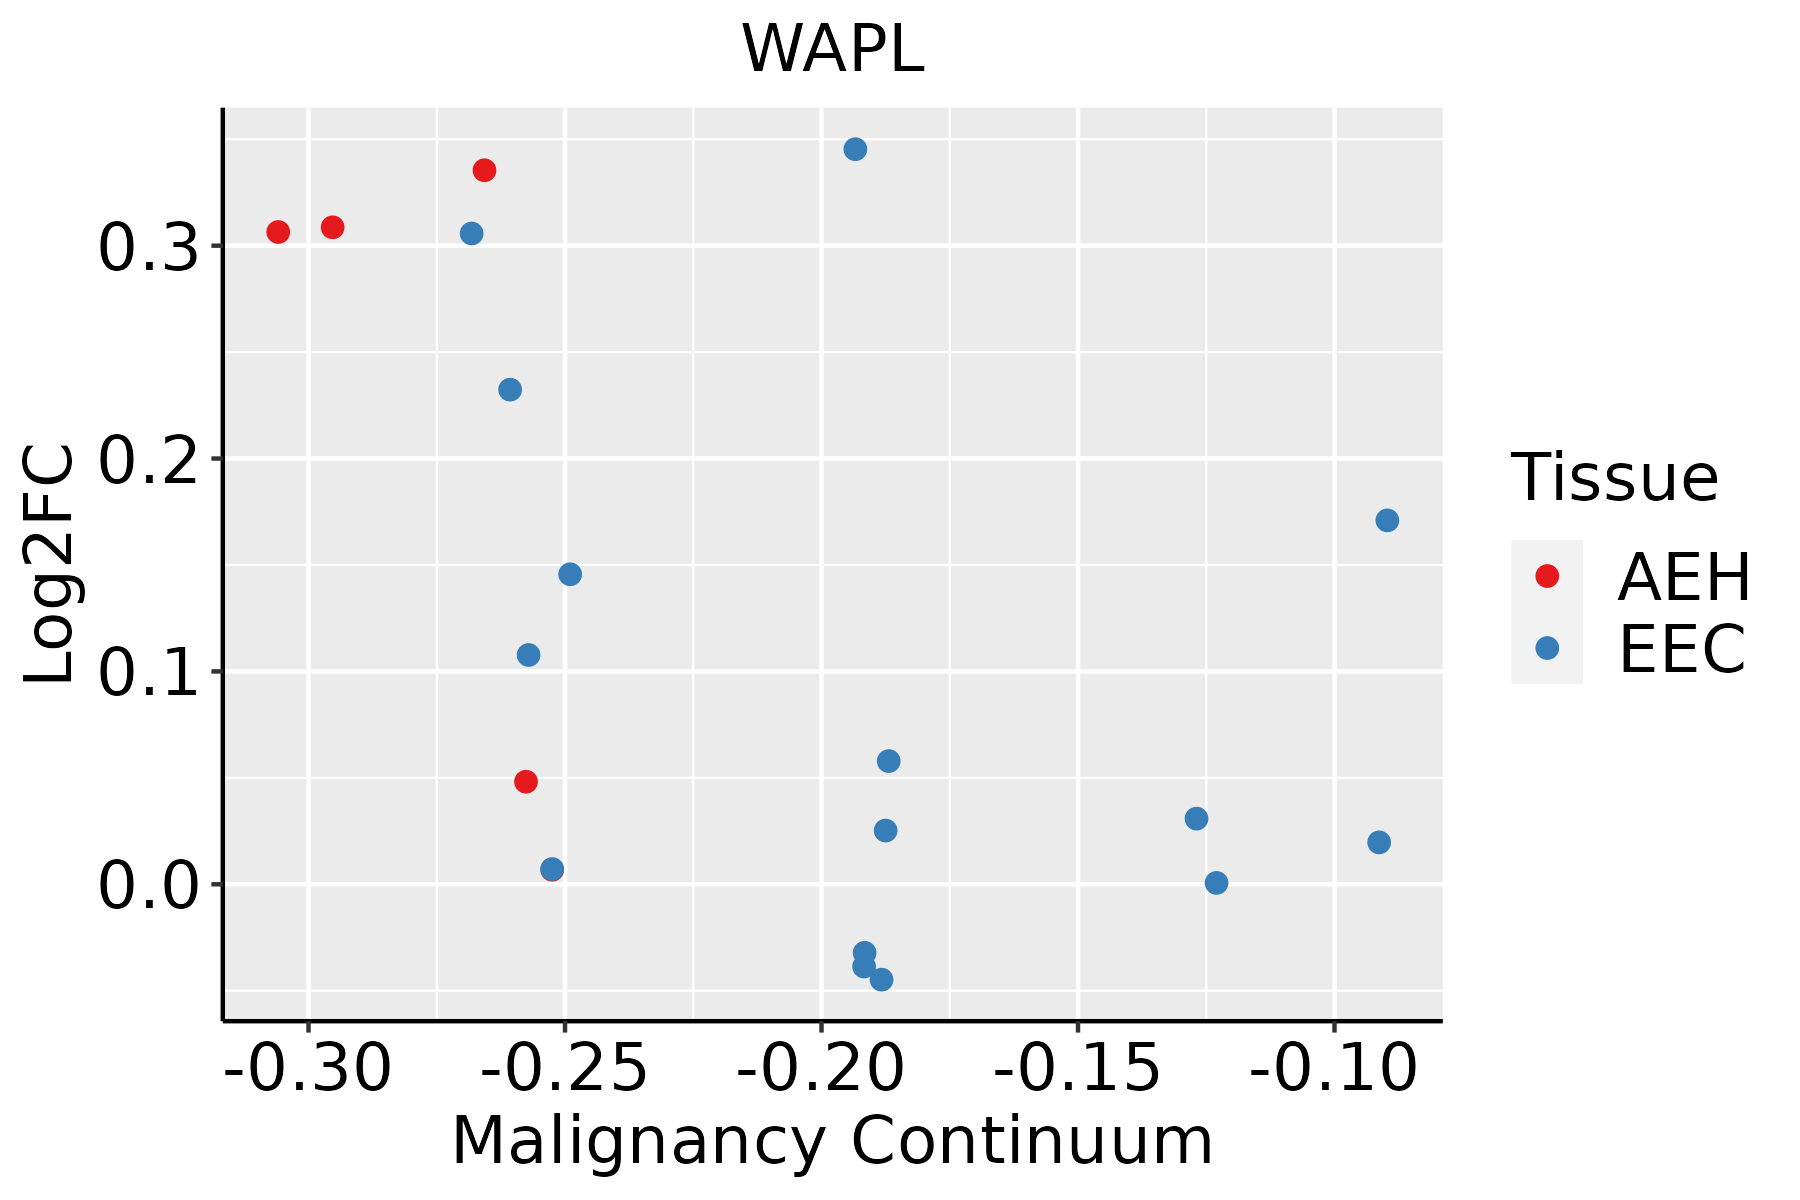 | AEH: Atypical endometrial hyperplasia |
| EEC: Endometrioid Cancer | ||
| Esophagus |  | ESCC: Esophageal squamous cell carcinoma |
| HGIN: High-grade intraepithelial neoplasias | ||
| LGIN: Low-grade intraepithelial neoplasias | ||
| Liver | 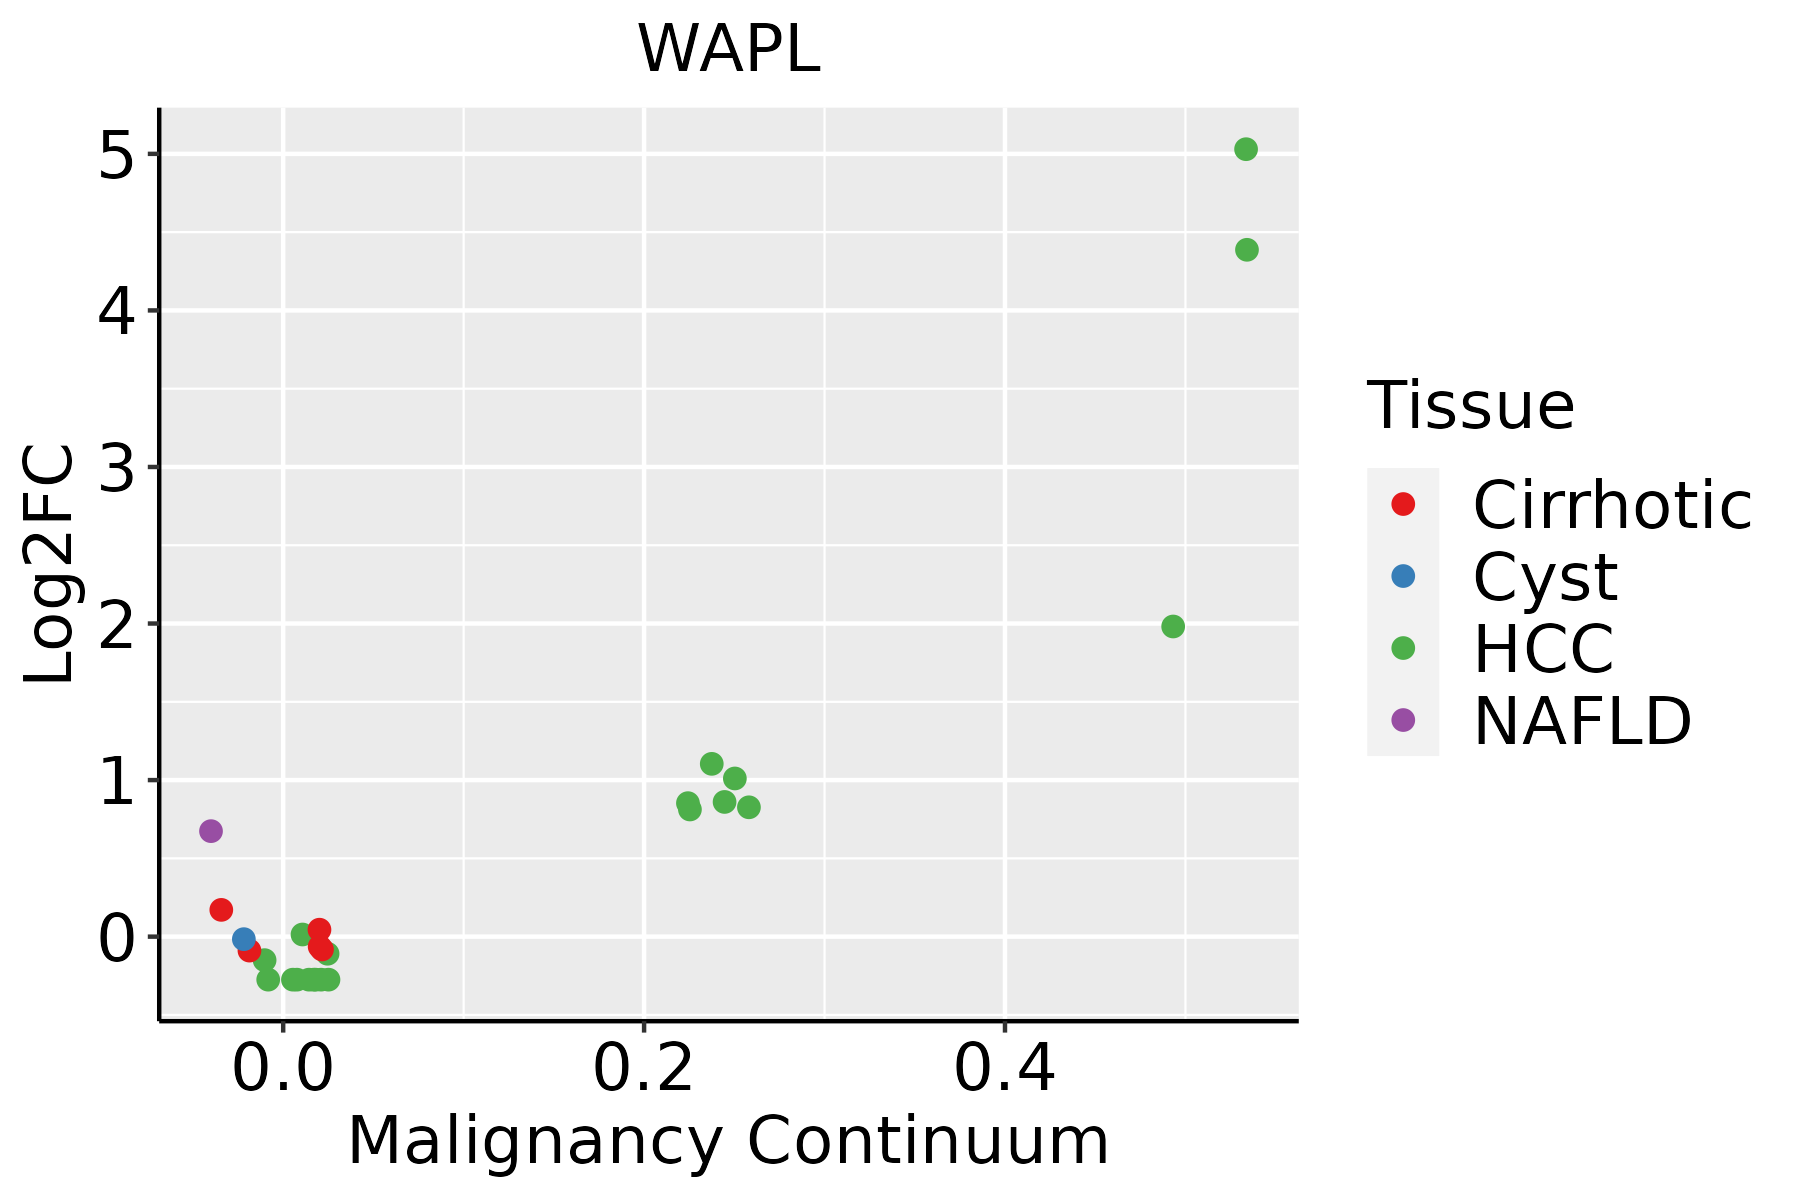 | HCC: Hepatocellular carcinoma |
| NAFLD: Non-alcoholic fatty liver disease | ||
| Oral Cavity | 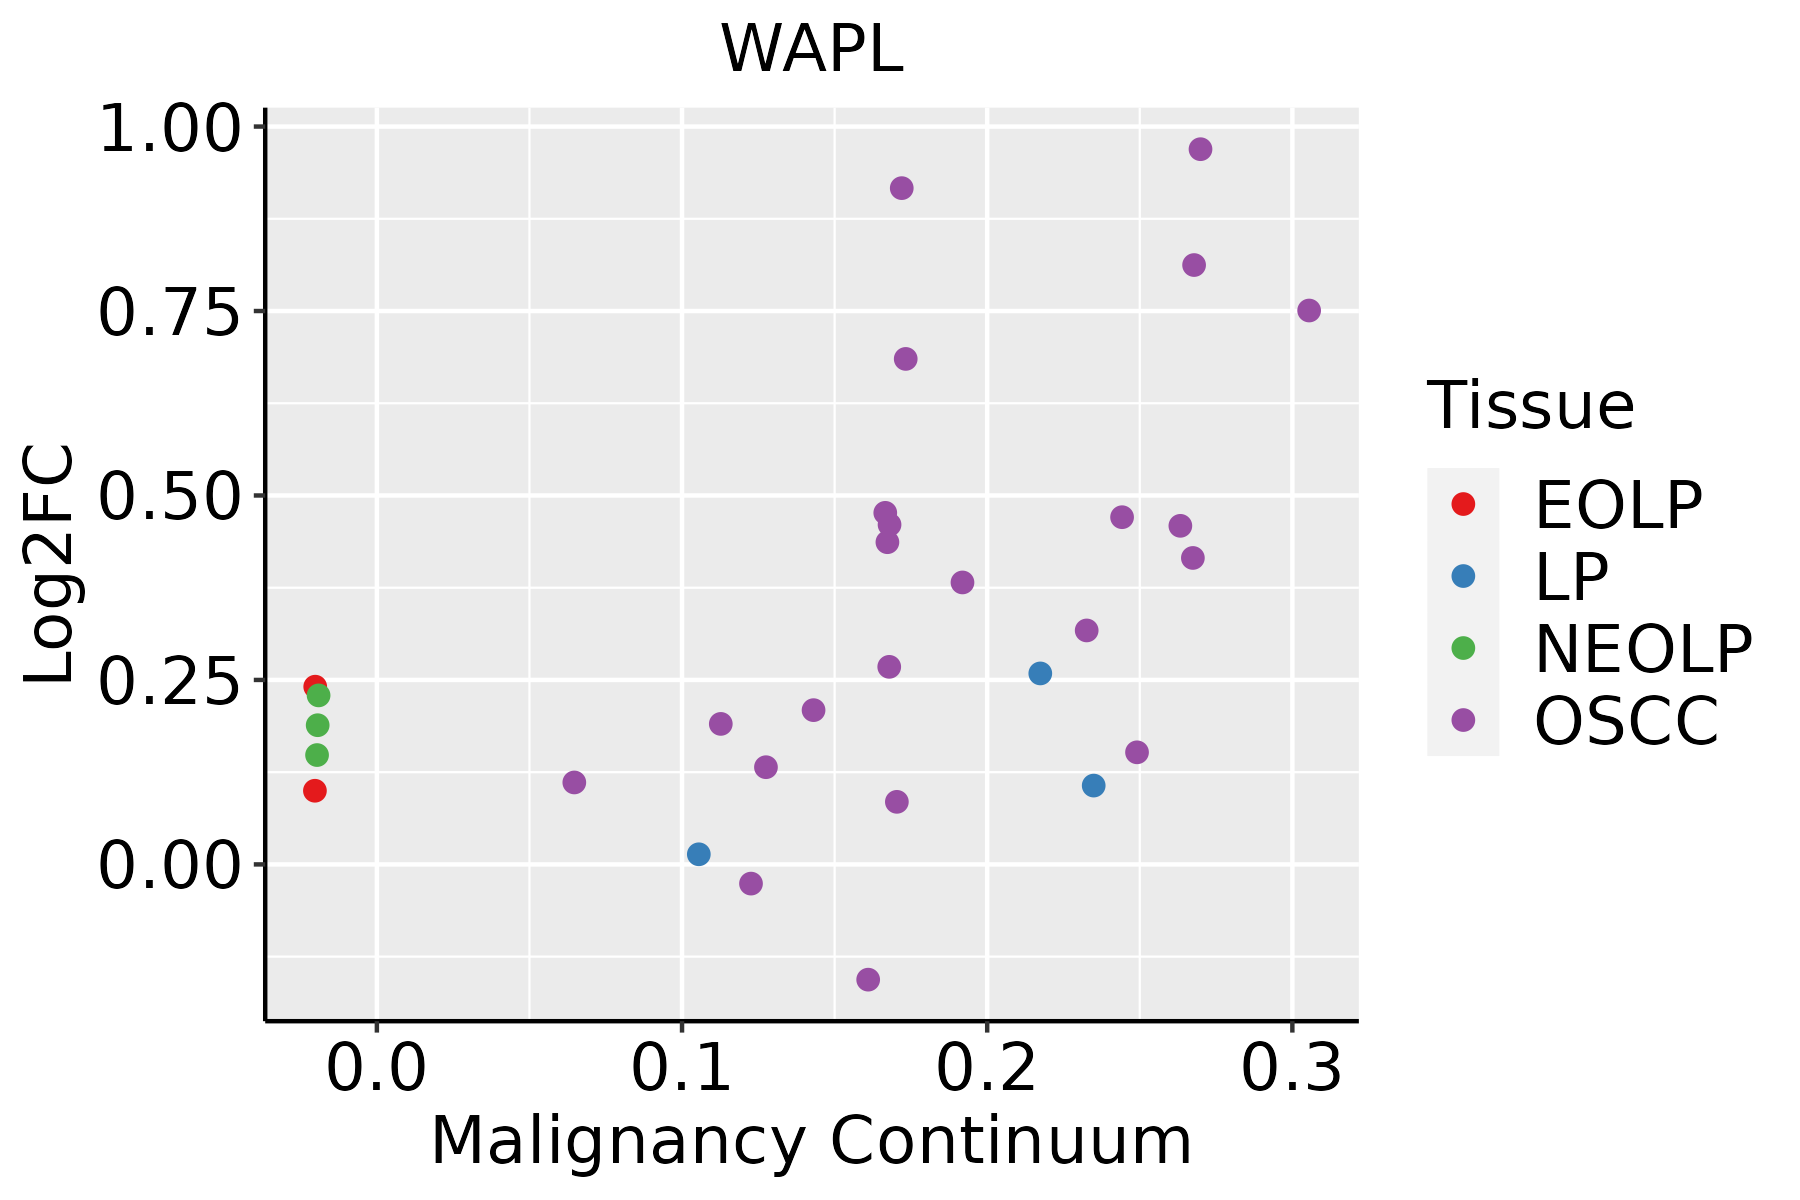 | EOLP: Erosive Oral lichen planus |
| LP: leukoplakia | ||
| NEOLP: Non-erosive oral lichen planus | ||
| OSCC: Oral squamous cell carcinoma | ||
| Thyroid |  | ATC: Anaplastic thyroid cancer |
| HT: Hashimoto's thyroiditis | ||
| PTC: Papillary thyroid cancer |
| ∗log2FC in expression of this searched gene in stem-like cells from each diseased tissue sample relative to stem-like cells in normal samples in each tissue plotted against the malignancy continuum. Samples are colored based on if they are from different disease stage. |
Top |
Malignant transformation related pathway analysis |
| Find out the enriched GO biological processes and KEGG pathways involved in transition from healthy to precancer to cancer |
| Tissue | Disease Stage | Enriched GO biological Processes |
| Colorectum | AD |  |
| Colorectum | SER |  |
| Colorectum | MSS |  |
| Colorectum | MSI-H |  |
| Colorectum | FAP |  |
| ∗Top 15 enriched GO BP terms are showed in the bar plot of each disease state in each tissue. Each row represents a significant GO biological process which is colored according to the -log10(p.adjust). |
| Page: 1 2 3 4 5 6 7 8 9 |
| GO ID | Tissue | Disease Stage | Description | Gene Ratio | Bg Ratio | pvalue | p.adjust | Count |
| GO:0051098 | Colorectum | AD | regulation of binding | 126/3918 | 363/18723 | 6.01e-10 | 4.88e-08 | 126 |
| GO:0010639 | Colorectum | AD | negative regulation of organelle organization | 114/3918 | 348/18723 | 1.41e-07 | 6.49e-06 | 114 |
| GO:0009636 | Colorectum | AD | response to toxic substance | 88/3918 | 262/18723 | 1.12e-06 | 3.72e-05 | 88 |
| GO:0033044 | Colorectum | AD | regulation of chromosome organization | 60/3918 | 187/18723 | 2.25e-04 | 2.94e-03 | 60 |
| GO:0007063 | Colorectum | AD | regulation of sister chromatid cohesion | 12/3918 | 21/18723 | 3.02e-04 | 3.62e-03 | 12 |
| GO:0051100 | Colorectum | AD | negative regulation of binding | 50/3918 | 162/18723 | 1.84e-03 | 1.51e-02 | 50 |
| GO:0007062 | Colorectum | AD | sister chromatid cohesion | 23/3918 | 62/18723 | 2.51e-03 | 1.92e-02 | 23 |
| GO:00106393 | Colorectum | FAP | negative regulation of organelle organization | 80/2622 | 348/18723 | 3.62e-06 | 1.27e-04 | 80 |
| GO:00510984 | Colorectum | FAP | regulation of binding | 81/2622 | 363/18723 | 1.04e-05 | 2.97e-04 | 81 |
| GO:00330442 | Colorectum | FAP | regulation of chromosome organization | 46/2622 | 187/18723 | 7.41e-05 | 1.36e-03 | 46 |
| GO:00070632 | Colorectum | FAP | regulation of sister chromatid cohesion | 10/2622 | 21/18723 | 2.29e-04 | 3.22e-03 | 10 |
| GO:00070622 | Colorectum | FAP | sister chromatid cohesion | 18/2622 | 62/18723 | 1.60e-03 | 1.42e-02 | 18 |
| GO:00096363 | Colorectum | FAP | response to toxic substance | 53/2622 | 262/18723 | 3.35e-03 | 2.46e-02 | 53 |
| GO:00510985 | Colorectum | CRC | regulation of binding | 72/2078 | 363/18723 | 6.43e-07 | 4.50e-05 | 72 |
| GO:00106394 | Colorectum | CRC | negative regulation of organelle organization | 63/2078 | 348/18723 | 6.09e-05 | 1.35e-03 | 63 |
| GO:00070633 | Colorectum | CRC | regulation of sister chromatid cohesion | 9/2078 | 21/18723 | 2.12e-04 | 3.56e-03 | 9 |
| GO:00330443 | Colorectum | CRC | regulation of chromosome organization | 37/2078 | 187/18723 | 3.34e-04 | 5.10e-03 | 37 |
| GO:00070623 | Colorectum | CRC | sister chromatid cohesion | 16/2078 | 62/18723 | 9.40e-04 | 1.15e-02 | 16 |
| GO:00511003 | Colorectum | CRC | negative regulation of binding | 30/2078 | 162/18723 | 3.36e-03 | 2.87e-02 | 30 |
| GO:0006275 | Colorectum | CRC | regulation of DNA replication | 21/2078 | 107/18723 | 6.56e-03 | 4.70e-02 | 21 |
| Page: 1 2 3 4 5 6 7 8 9 |
| Pathway ID | Tissue | Disease Stage | Description | Gene Ratio | Bg Ratio | pvalue | p.adjust | qvalue | Count |
| hsa04110 | Colorectum | FAP | Cell cycle | 37/1404 | 157/8465 | 1.44e-02 | 4.77e-02 | 2.90e-02 | 37 |
| hsa041101 | Colorectum | FAP | Cell cycle | 37/1404 | 157/8465 | 1.44e-02 | 4.77e-02 | 2.90e-02 | 37 |
| hsa0411023 | Esophagus | ESCC | Cell cycle | 126/4205 | 157/8465 | 1.34e-15 | 5.60e-14 | 2.87e-14 | 126 |
| hsa0411033 | Esophagus | ESCC | Cell cycle | 126/4205 | 157/8465 | 1.34e-15 | 5.60e-14 | 2.87e-14 | 126 |
| hsa041104 | Liver | Cirrhotic | Cell cycle | 61/2530 | 157/8465 | 9.53e-03 | 3.21e-02 | 1.98e-02 | 61 |
| hsa0411011 | Liver | Cirrhotic | Cell cycle | 61/2530 | 157/8465 | 9.53e-03 | 3.21e-02 | 1.98e-02 | 61 |
| hsa041102 | Liver | HCC | Cell cycle | 106/4020 | 157/8465 | 2.54e-07 | 3.04e-06 | 1.69e-06 | 106 |
| hsa041103 | Liver | HCC | Cell cycle | 106/4020 | 157/8465 | 2.54e-07 | 3.04e-06 | 1.69e-06 | 106 |
| hsa041108 | Oral cavity | OSCC | Cell cycle | 118/3704 | 157/8465 | 7.15e-16 | 2.66e-14 | 1.35e-14 | 118 |
| hsa0411015 | Oral cavity | OSCC | Cell cycle | 118/3704 | 157/8465 | 7.15e-16 | 2.66e-14 | 1.35e-14 | 118 |
| hsa0411041 | Oral cavity | EOLP | Cell cycle | 42/1218 | 157/8465 | 3.20e-05 | 1.61e-04 | 9.52e-05 | 42 |
| hsa0411051 | Oral cavity | EOLP | Cell cycle | 42/1218 | 157/8465 | 3.20e-05 | 1.61e-04 | 9.52e-05 | 42 |
| hsa0411061 | Oral cavity | NEOLP | Cell cycle | 37/1112 | 157/8465 | 2.29e-04 | 1.58e-03 | 9.95e-04 | 37 |
| hsa0411071 | Oral cavity | NEOLP | Cell cycle | 37/1112 | 157/8465 | 2.29e-04 | 1.58e-03 | 9.95e-04 | 37 |
| Page: 1 |
Top |
Cell-cell communication analysis |
| Identification of potential cell-cell interactions between two cell types and their ligand-receptor pairs for different disease states |
| Ligand | Receptor | LRpair | Pathway | Tissue | Disease Stage |
| Page: 1 |
Top |
Single-cell gene regulatory network inference analysis |
| Find out the significant the regulons (TFs) and the target genes of each regulon across cell types for different disease states |
| TF | Cell Type | Tissue | Disease Stage | Target Gene | RSS | Regulon Activity |
| ∗The dot plots of a searched regulon are shown for all cell subpopulations in each disease state of each tissue based on the regulon specific score inferred using pySCENIC and by calculating the average expression. |
| Page: 1 |
Top |
Somatic mutation of malignant transformation related genes |
| Annotation of somatic variants for genes involved in malignant transformation |
| Hugo Symbol | Variant Class | Variant Classification | dbSNP RS | HGVSc | HGVSp | HGVSp Short | SWISSPROT | BIOTYPE | SIFT | PolyPhen | Tumor Sample Barcode | Tissue | Histology | Sex | Age | Stage | Therapy Types | Drugs | Outcome |
| WAPL | SNV | Missense_Mutation | novel | c.926N>T | p.Ser309Leu | p.S309L | Q7Z5K2 | protein_coding | deleterious_low_confidence(0.05) | benign(0.04) | TCGA-A2-A0SX-01 | Breast | breast invasive carcinoma | Female | <65 | I/II | Chemotherapy | adriamycin | PD |
| WAPL | SNV | Missense_Mutation | c.2748G>C | p.Gln916His | p.Q916H | Q7Z5K2 | protein_coding | tolerated(0.13) | benign(0.007) | TCGA-AC-A23H-01 | Breast | breast invasive carcinoma | Female | >=65 | I/II | Unknown | Unknown | PD | |
| WAPL | SNV | Missense_Mutation | rs113314659 | c.3133C>T | p.Arg1045Trp | p.R1045W | Q7Z5K2 | protein_coding | deleterious(0) | probably_damaging(0.927) | TCGA-AO-A128-01 | Breast | breast invasive carcinoma | Female | <65 | I/II | Chemotherapy | doxorubicin | SD |
| WAPL | SNV | Missense_Mutation | novel | c.1207N>C | p.Asp403His | p.D403H | Q7Z5K2 | protein_coding | deleterious_low_confidence(0) | probably_damaging(0.927) | TCGA-C5-A2LZ-01 | Cervix | cervical & endocervical cancer | Female | >=65 | III/IV | Unknown | Unknown | PD |
| WAPL | SNV | Missense_Mutation | c.2869C>G | p.Leu957Val | p.L957V | Q7Z5K2 | protein_coding | tolerated(0.14) | possibly_damaging(0.755) | TCGA-MY-A5BD-01 | Cervix | cervical & endocervical cancer | Female | <65 | I/II | Chemotherapy | cisplatin | CR | |
| WAPL | SNV | Missense_Mutation | novel | c.743N>T | p.Ser248Leu | p.S248L | Q7Z5K2 | protein_coding | tolerated_low_confidence(0.32) | benign(0.018) | TCGA-VS-A9V3-01 | Cervix | cervical & endocervical cancer | Female | <65 | I/II | Chemotherapy | cisplatin | PD |
| WAPL | insertion | In_Frame_Ins | novel | c.812_813insGATTGGAGG | p.Arg271_Leu272insIleGlyGly | p.R271_L272insIGG | Q7Z5K2 | protein_coding | TCGA-EK-A2RN-01 | Cervix | cervical & endocervical cancer | Female | <65 | I/II | Unknown | Unknown | SD | ||
| WAPL | SNV | Missense_Mutation | c.673N>C | p.Ile225Leu | p.I225L | Q7Z5K2 | protein_coding | tolerated_low_confidence(0.68) | benign(0) | TCGA-AA-3510-01 | Colorectum | colon adenocarcinoma | Male | >=65 | I/II | Unknown | Unknown | SD | |
| WAPL | SNV | Missense_Mutation | c.3370N>C | p.Tyr1124His | p.Y1124H | Q7Z5K2 | protein_coding | deleterious(0.02) | probably_damaging(0.997) | TCGA-AA-3811-01 | Colorectum | colon adenocarcinoma | Female | >=65 | III/IV | Unknown | Unknown | PD | |
| WAPL | SNV | Missense_Mutation | c.3297N>T | p.Glu1099Asp | p.E1099D | Q7Z5K2 | protein_coding | tolerated(0.32) | benign(0) | TCGA-AA-3821-01 | Colorectum | colon adenocarcinoma | Female | >=65 | I/II | Unknown | Unknown | SD |
| Page: 1 2 3 4 5 6 7 8 9 10 11 12 |
Top |
Related drugs of malignant transformation related genes |
| Identification of chemicals and drugs interact with genes involved in malignant transfromation |
| (DGIdb 4.0) |
| Entrez ID | Symbol | Category | Interaction Types | Drug Claim Name | Drug Name | PMIDs |
| Page: 1 |

Copyright 2023-Present -The University of Texas Health Science Center at Houston |