
|
|||||
|
 | |
| |
| |
| |
| |
| |
|
Gene: VWA8 |
Gene summary for VWA8 |
| Gene information | Species | Human | Gene symbol | VWA8 | Gene ID | 23078 |
| Gene name | von Willebrand factor A domain containing 8 | |
| Gene Alias | KIAA0564 | |
| Cytomap | 13q14.11 | |
| Gene Type | protein-coding | GO ID | GO:0005575 | UniProtAcc | A3KMH1 |
Top |
Malignant transformation analysis |
| Identification of the aberrant gene expression in precancerous and cancerous lesions by comparing the gene expression of stem-like cells in diseased tissues with normal stem cells |
| Entrez ID | Symbol | Replicates | Species | Organ | Tissue | Adj P-value | Log2FC | Malignancy |
| 23078 | VWA8 | CCI_1 | Human | Cervix | CC | 8.86e-09 | 7.66e-01 | 0.528 |
| 23078 | VWA8 | CCI_2 | Human | Cervix | CC | 1.04e-06 | 8.50e-01 | 0.5249 |
| 23078 | VWA8 | CCI_3 | Human | Cervix | CC | 1.67e-16 | 1.06e+00 | 0.516 |
| 23078 | VWA8 | HTA11_3410_2000001011 | Human | Colorectum | AD | 3.34e-30 | -7.71e-01 | 0.0155 |
| 23078 | VWA8 | HTA11_2487_2000001011 | Human | Colorectum | SER | 2.64e-10 | -6.59e-01 | -0.1808 |
| 23078 | VWA8 | HTA11_2112_2000001011 | Human | Colorectum | SER | 2.54e-02 | -7.33e-01 | -0.2196 |
| 23078 | VWA8 | HTA11_3361_2000001011 | Human | Colorectum | AD | 1.29e-07 | -7.58e-01 | -0.1207 |
| 23078 | VWA8 | HTA11_696_2000001011 | Human | Colorectum | AD | 6.15e-12 | -4.89e-01 | -0.1464 |
| 23078 | VWA8 | HTA11_866_2000001011 | Human | Colorectum | AD | 2.85e-04 | -3.77e-01 | -0.1001 |
| 23078 | VWA8 | HTA11_866_3004761011 | Human | Colorectum | AD | 3.53e-18 | -7.91e-01 | 0.096 |
| 23078 | VWA8 | HTA11_8622_2000001021 | Human | Colorectum | SER | 1.47e-03 | -7.47e-01 | 0.0528 |
| 23078 | VWA8 | HTA11_10711_2000001011 | Human | Colorectum | AD | 2.65e-03 | -5.83e-01 | 0.0338 |
| 23078 | VWA8 | HTA11_7696_3000711011 | Human | Colorectum | AD | 1.46e-23 | -7.21e-01 | 0.0674 |
| 23078 | VWA8 | HTA11_7469_2000001011 | Human | Colorectum | AD | 2.19e-03 | -6.19e-01 | -0.0124 |
| 23078 | VWA8 | HTA11_11156_2000001011 | Human | Colorectum | AD | 2.43e-03 | -1.00e+00 | 0.0397 |
| 23078 | VWA8 | HTA11_6818_2000001021 | Human | Colorectum | AD | 3.51e-02 | -5.11e-01 | 0.0588 |
| 23078 | VWA8 | HTA11_99999970781_79442 | Human | Colorectum | MSS | 3.40e-25 | -5.26e-01 | 0.294 |
| 23078 | VWA8 | HTA11_99999965104_69814 | Human | Colorectum | MSS | 8.87e-18 | 1.03e+00 | 0.281 |
| 23078 | VWA8 | HTA11_99999974143_84620 | Human | Colorectum | MSS | 2.37e-26 | -6.94e-01 | 0.3005 |
| 23078 | VWA8 | A001-C-207 | Human | Colorectum | FAP | 1.43e-10 | -6.38e-01 | 0.1278 |
| Page: 1 2 3 4 5 6 7 8 |
| Tissue | Expression Dynamics | Abbreviation |
| Cervix | 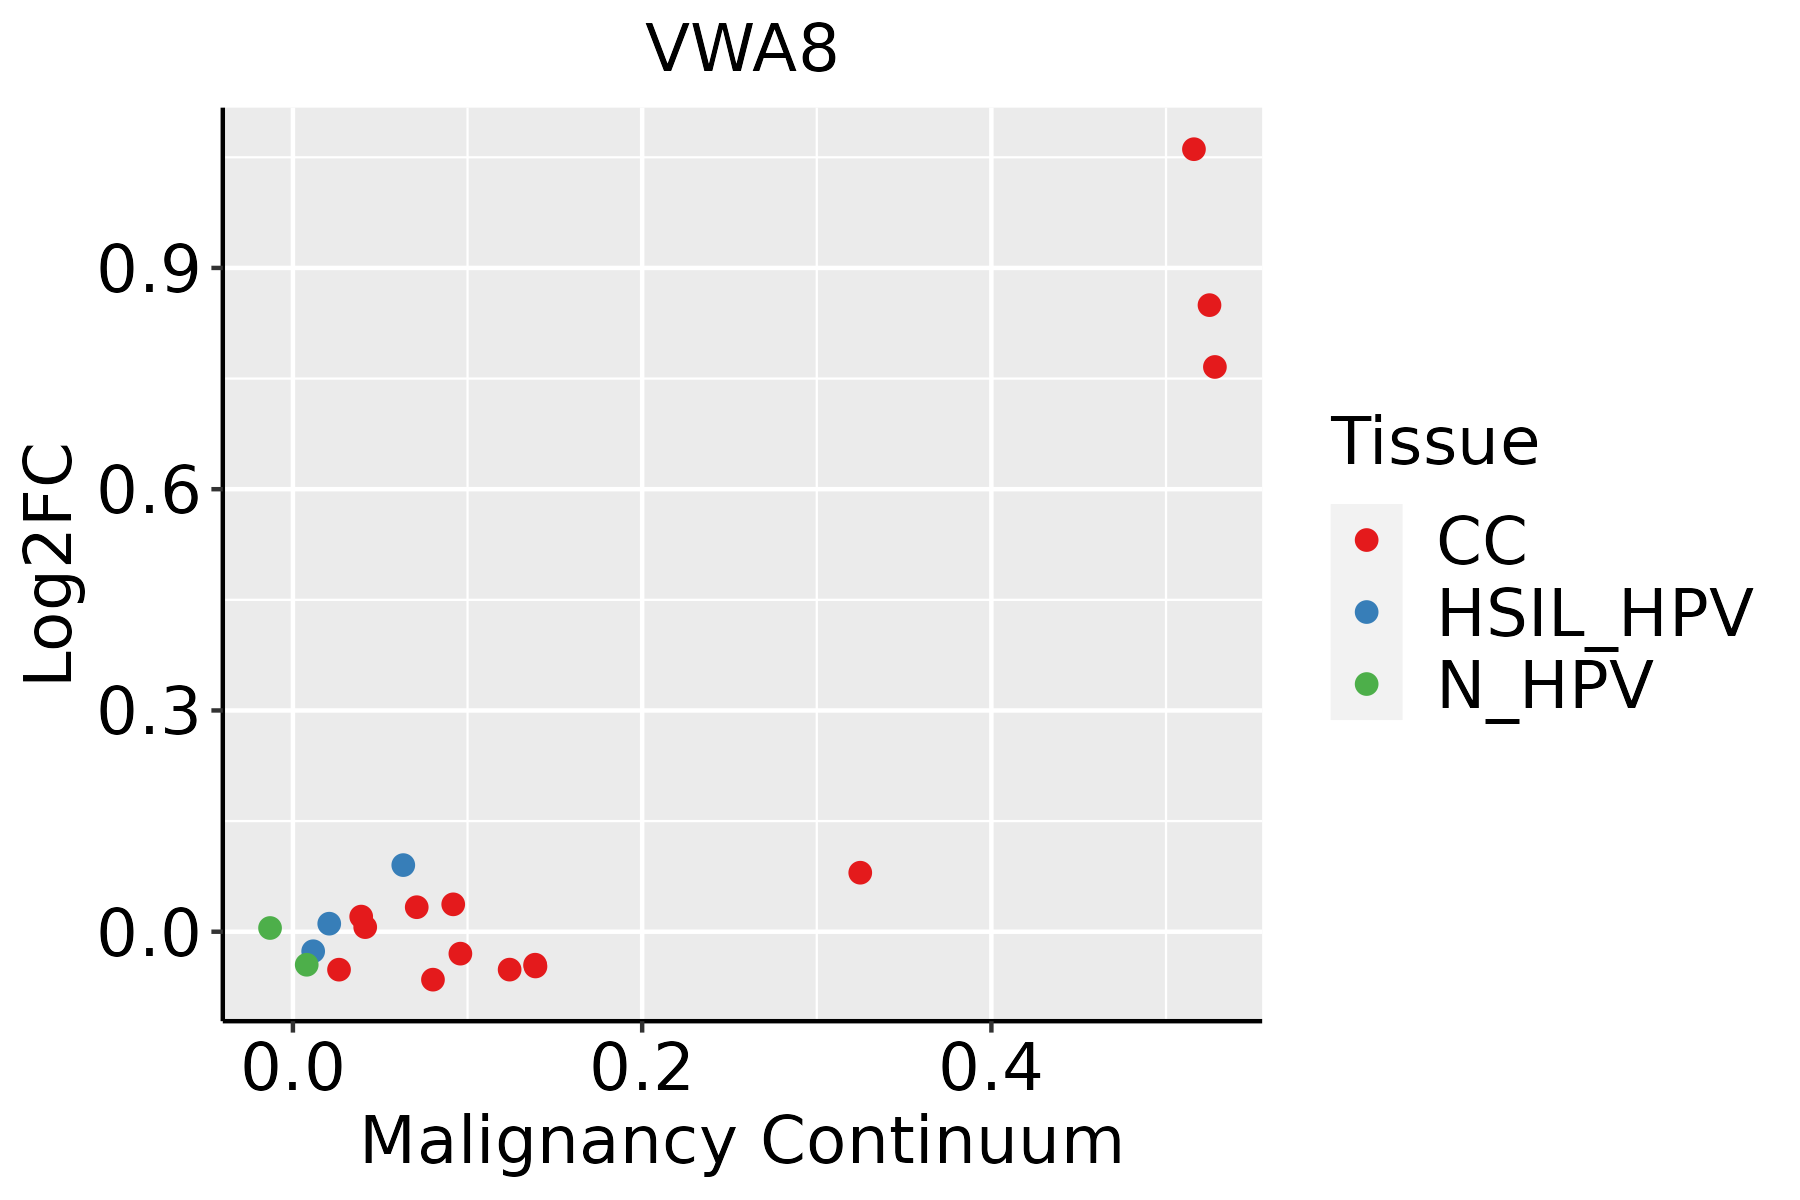 | CC: Cervix cancer |
| HSIL_HPV: HPV-infected high-grade squamous intraepithelial lesions | ||
| N_HPV: HPV-infected normal cervix | ||
| Colorectum (GSE201348) |  | FAP: Familial adenomatous polyposis |
| CRC: Colorectal cancer | ||
| Colorectum (HTA11) |  | AD: Adenomas |
| SER: Sessile serrated lesions | ||
| MSI-H: Microsatellite-high colorectal cancer | ||
| MSS: Microsatellite stable colorectal cancer | ||
| Endometrium | 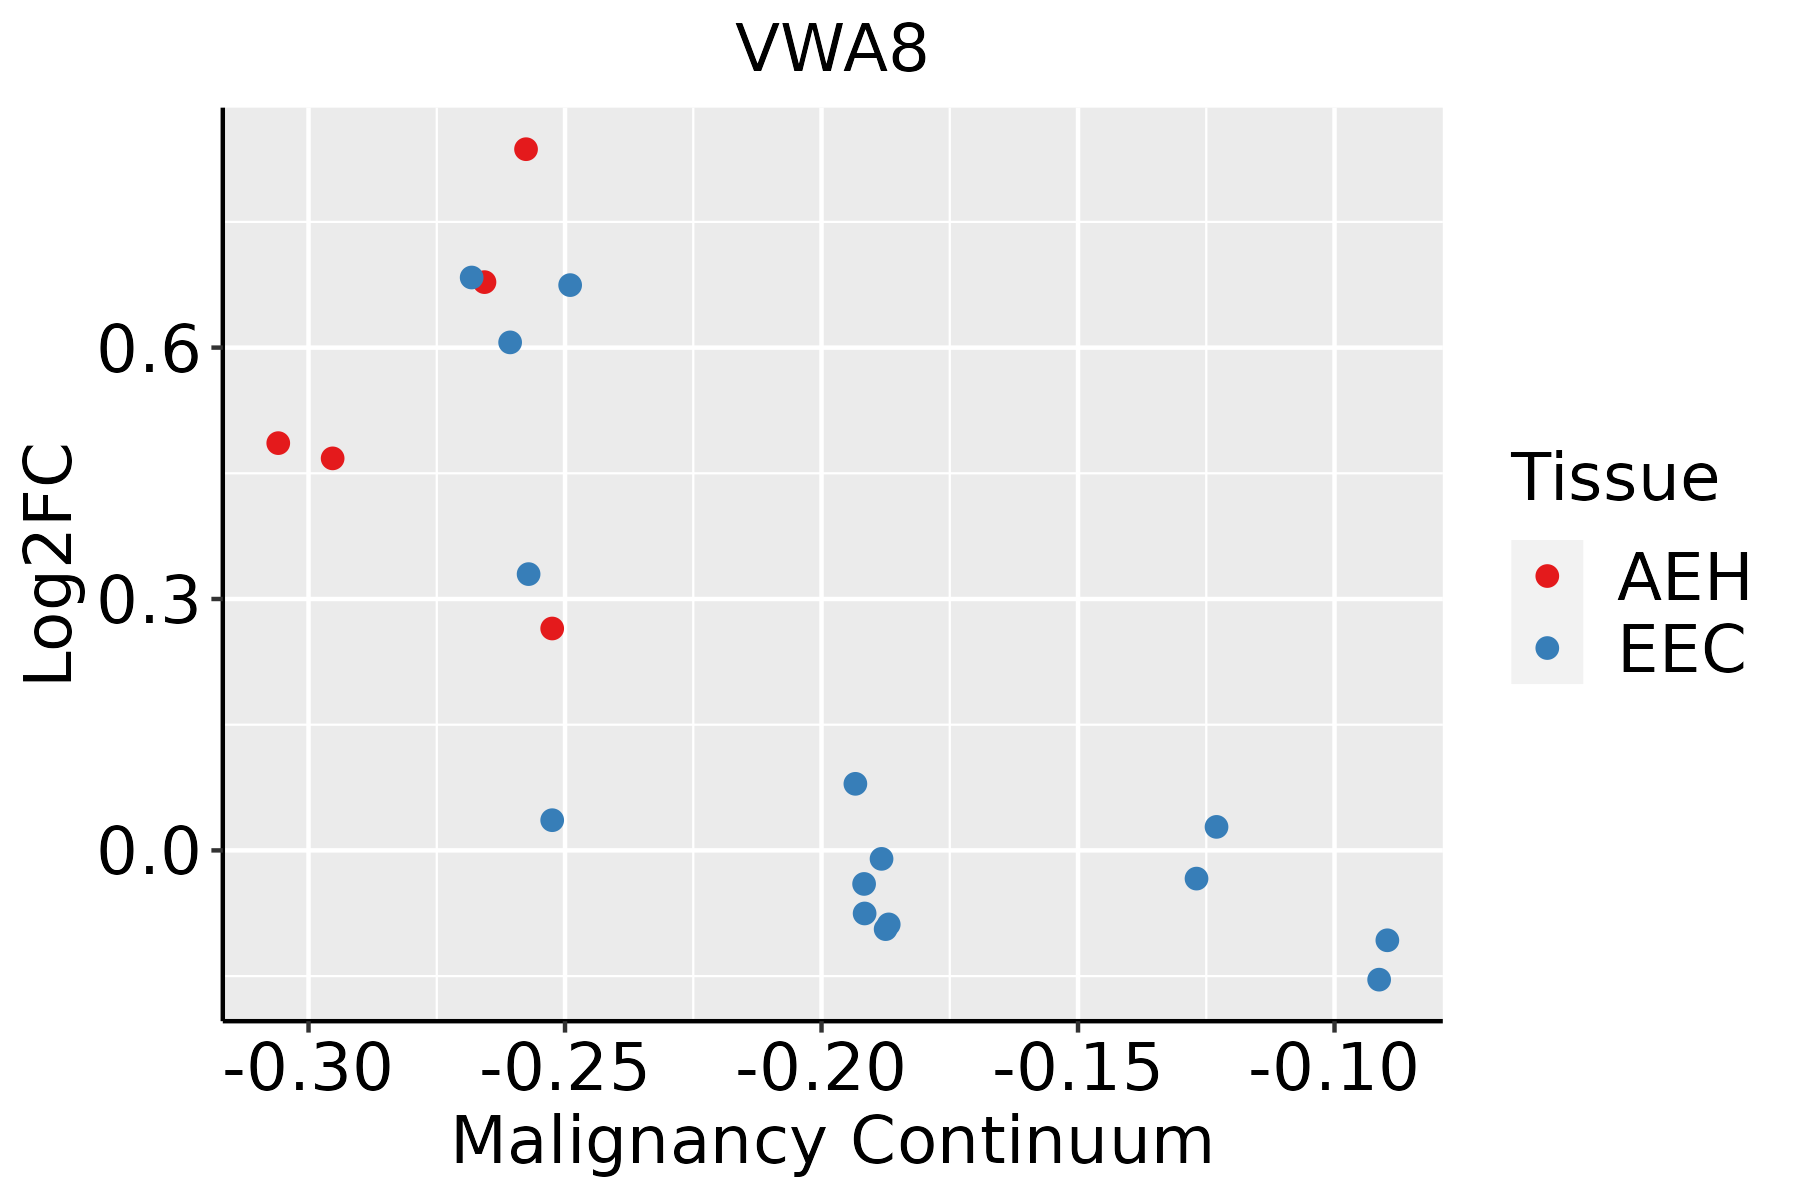 | AEH: Atypical endometrial hyperplasia |
| EEC: Endometrioid Cancer | ||
| Esophagus | 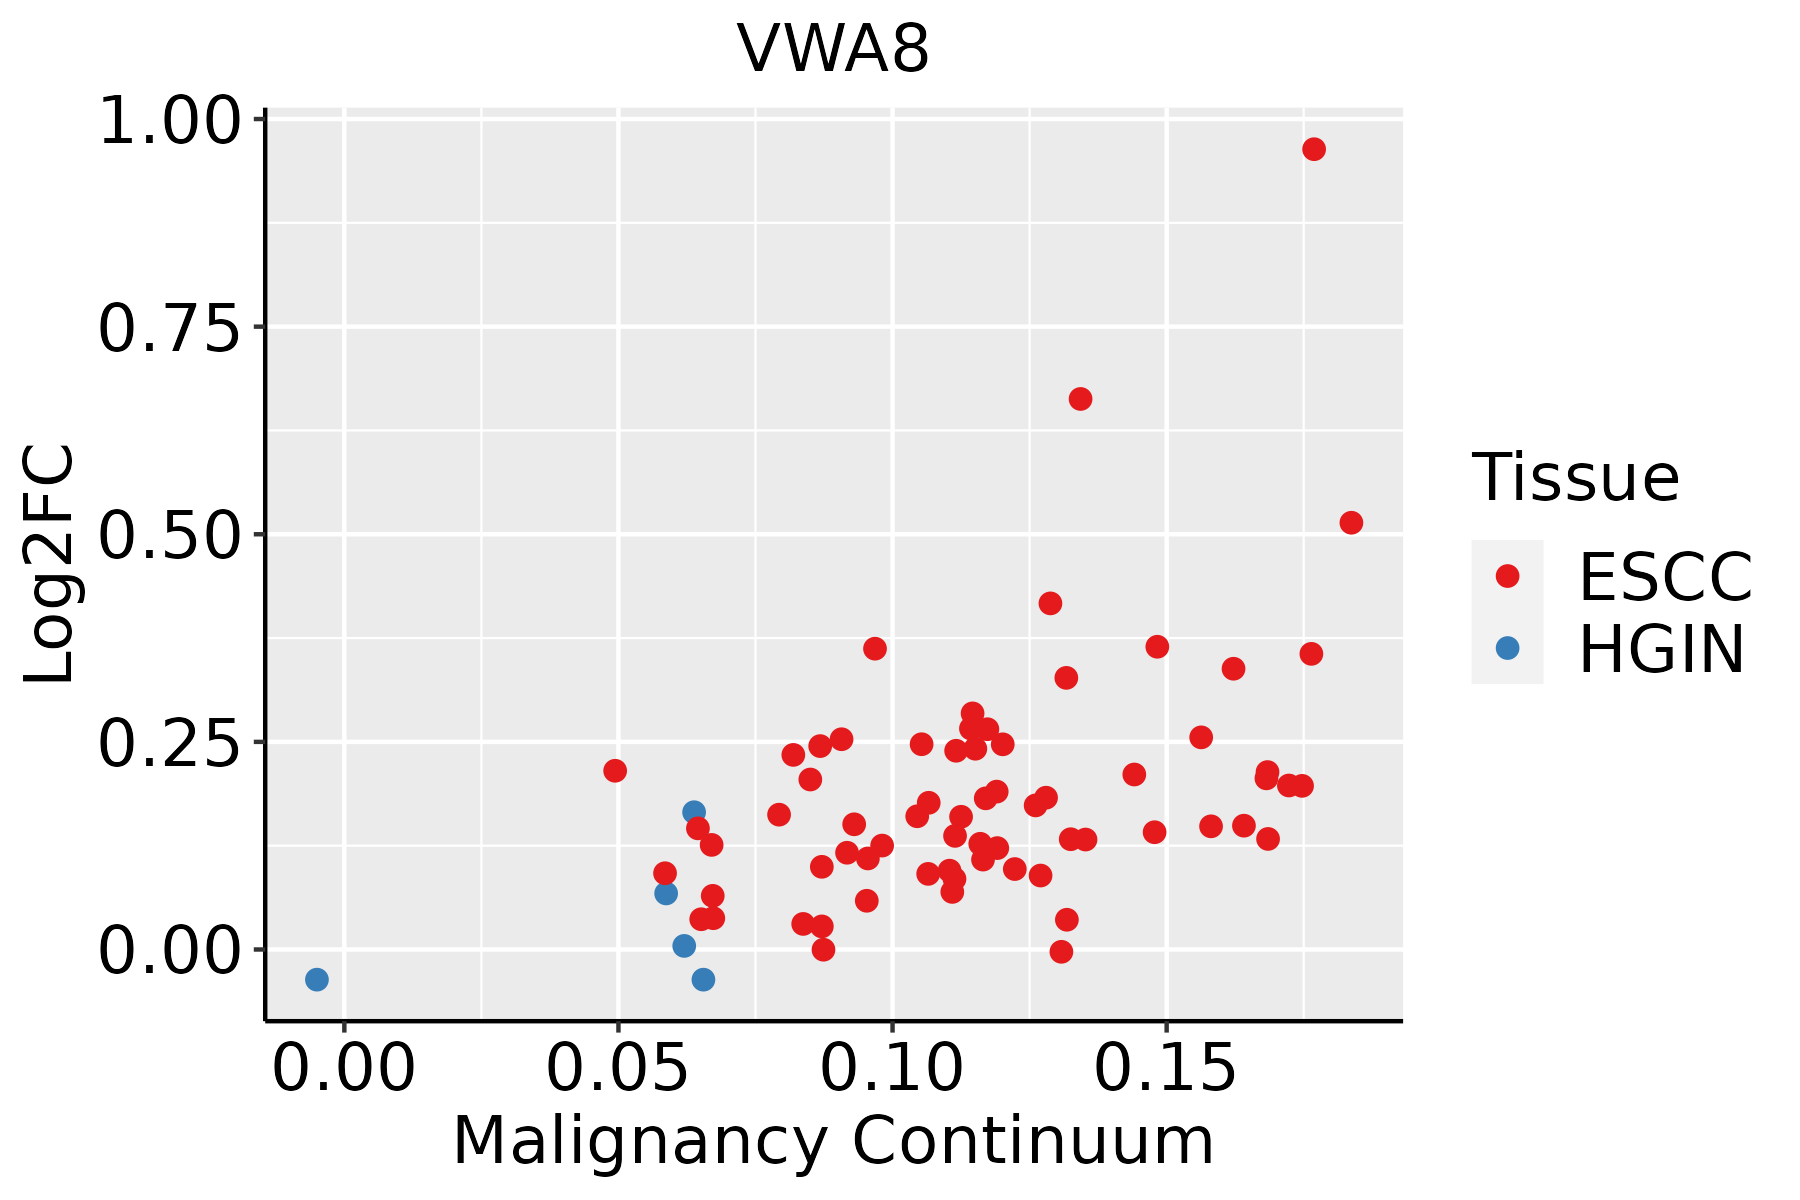 | ESCC: Esophageal squamous cell carcinoma |
| HGIN: High-grade intraepithelial neoplasias | ||
| LGIN: Low-grade intraepithelial neoplasias | ||
| Liver | 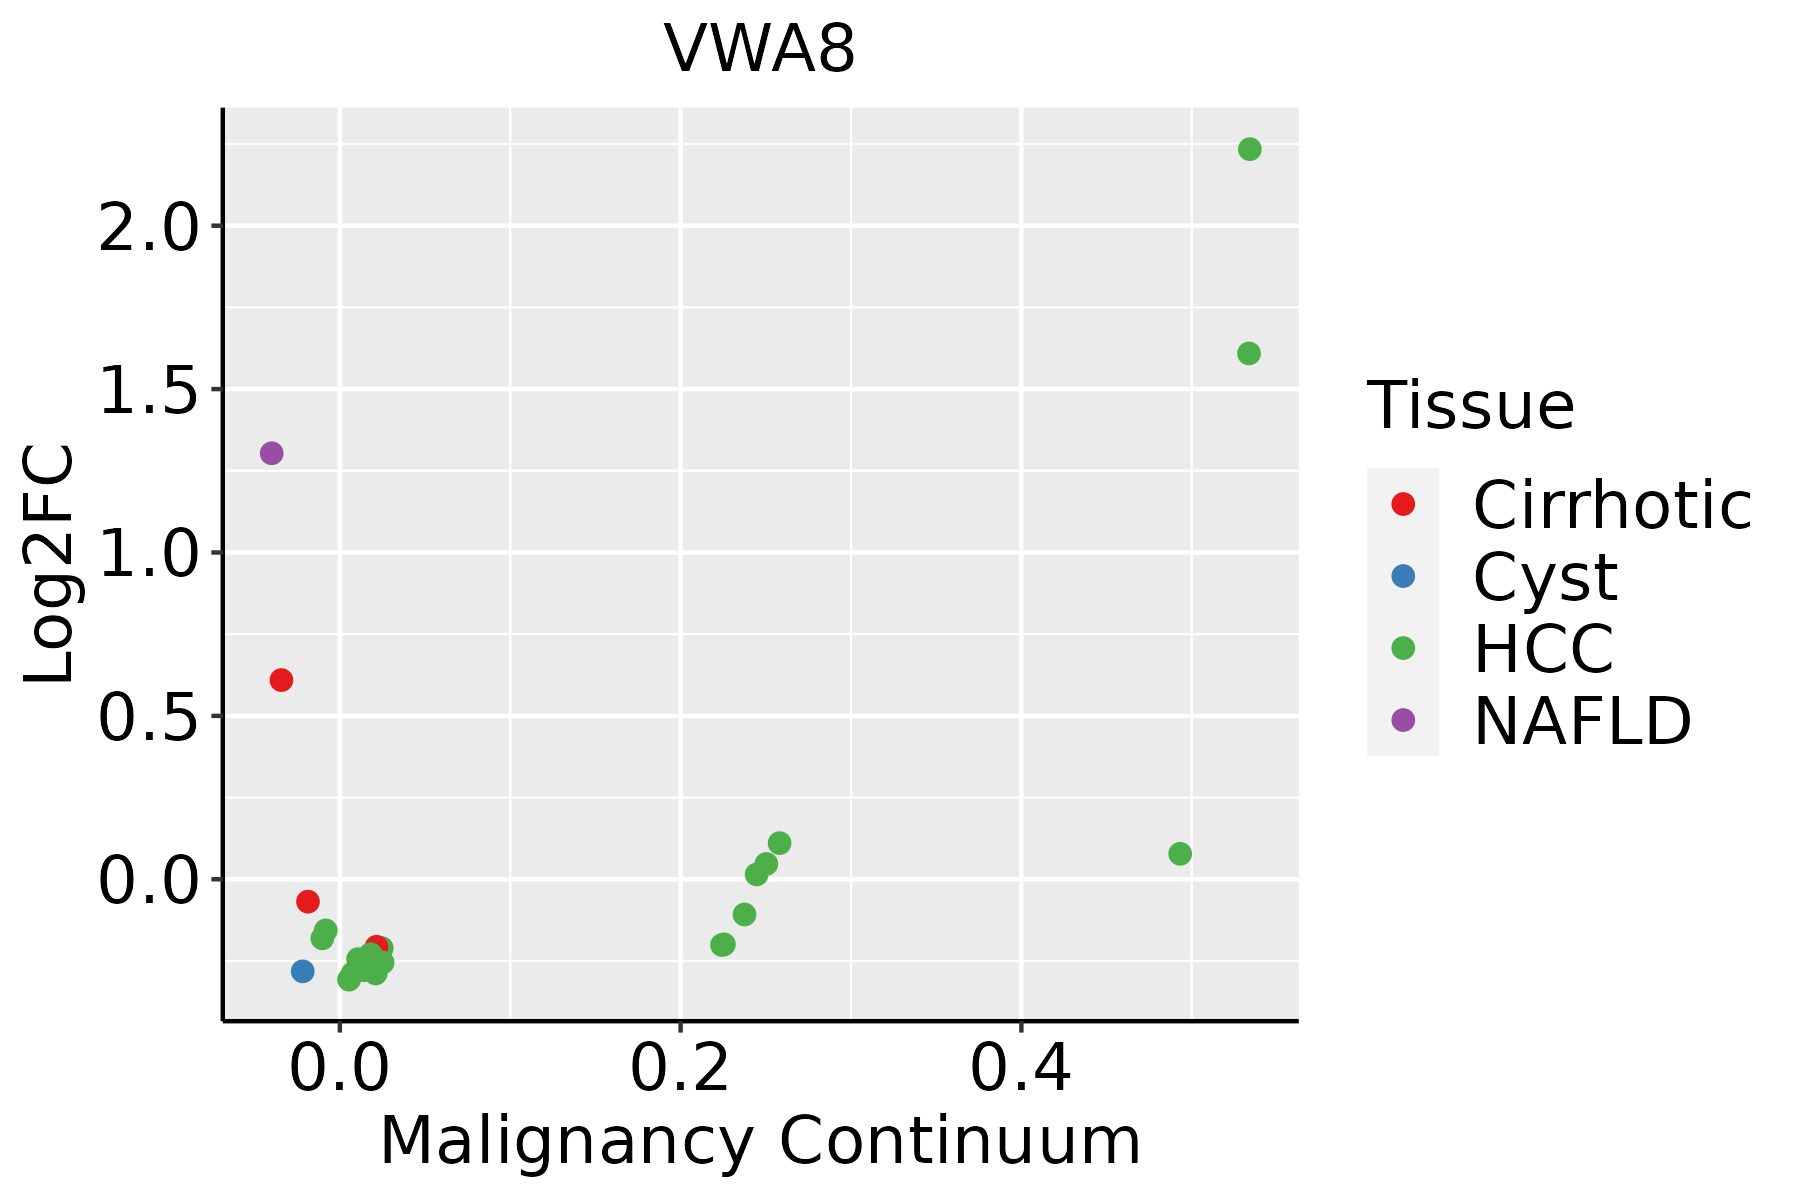 | HCC: Hepatocellular carcinoma |
| NAFLD: Non-alcoholic fatty liver disease | ||
| Lung | 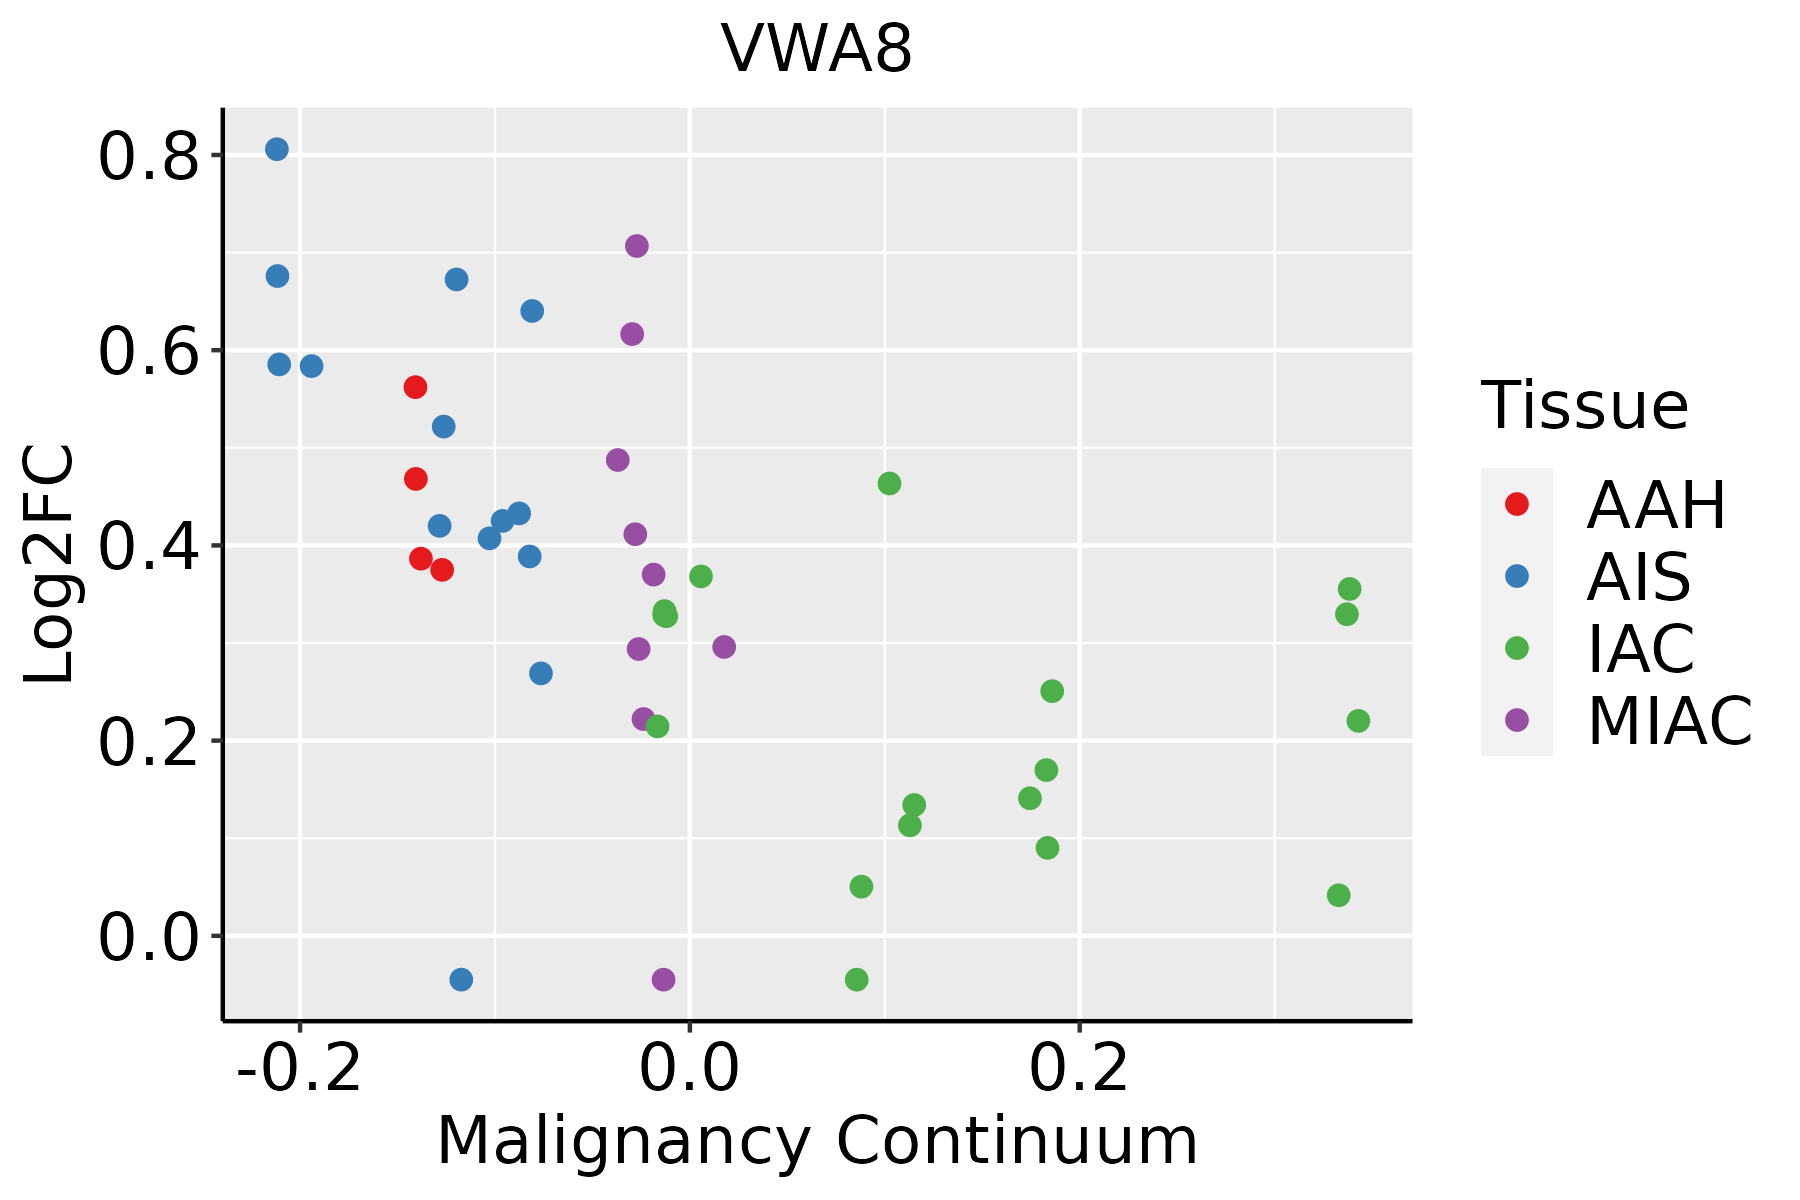 | AAH: Atypical adenomatous hyperplasia |
| AIS: Adenocarcinoma in situ | ||
| IAC: Invasive lung adenocarcinoma | ||
| MIA: Minimally invasive adenocarcinoma | ||
| Prostate | 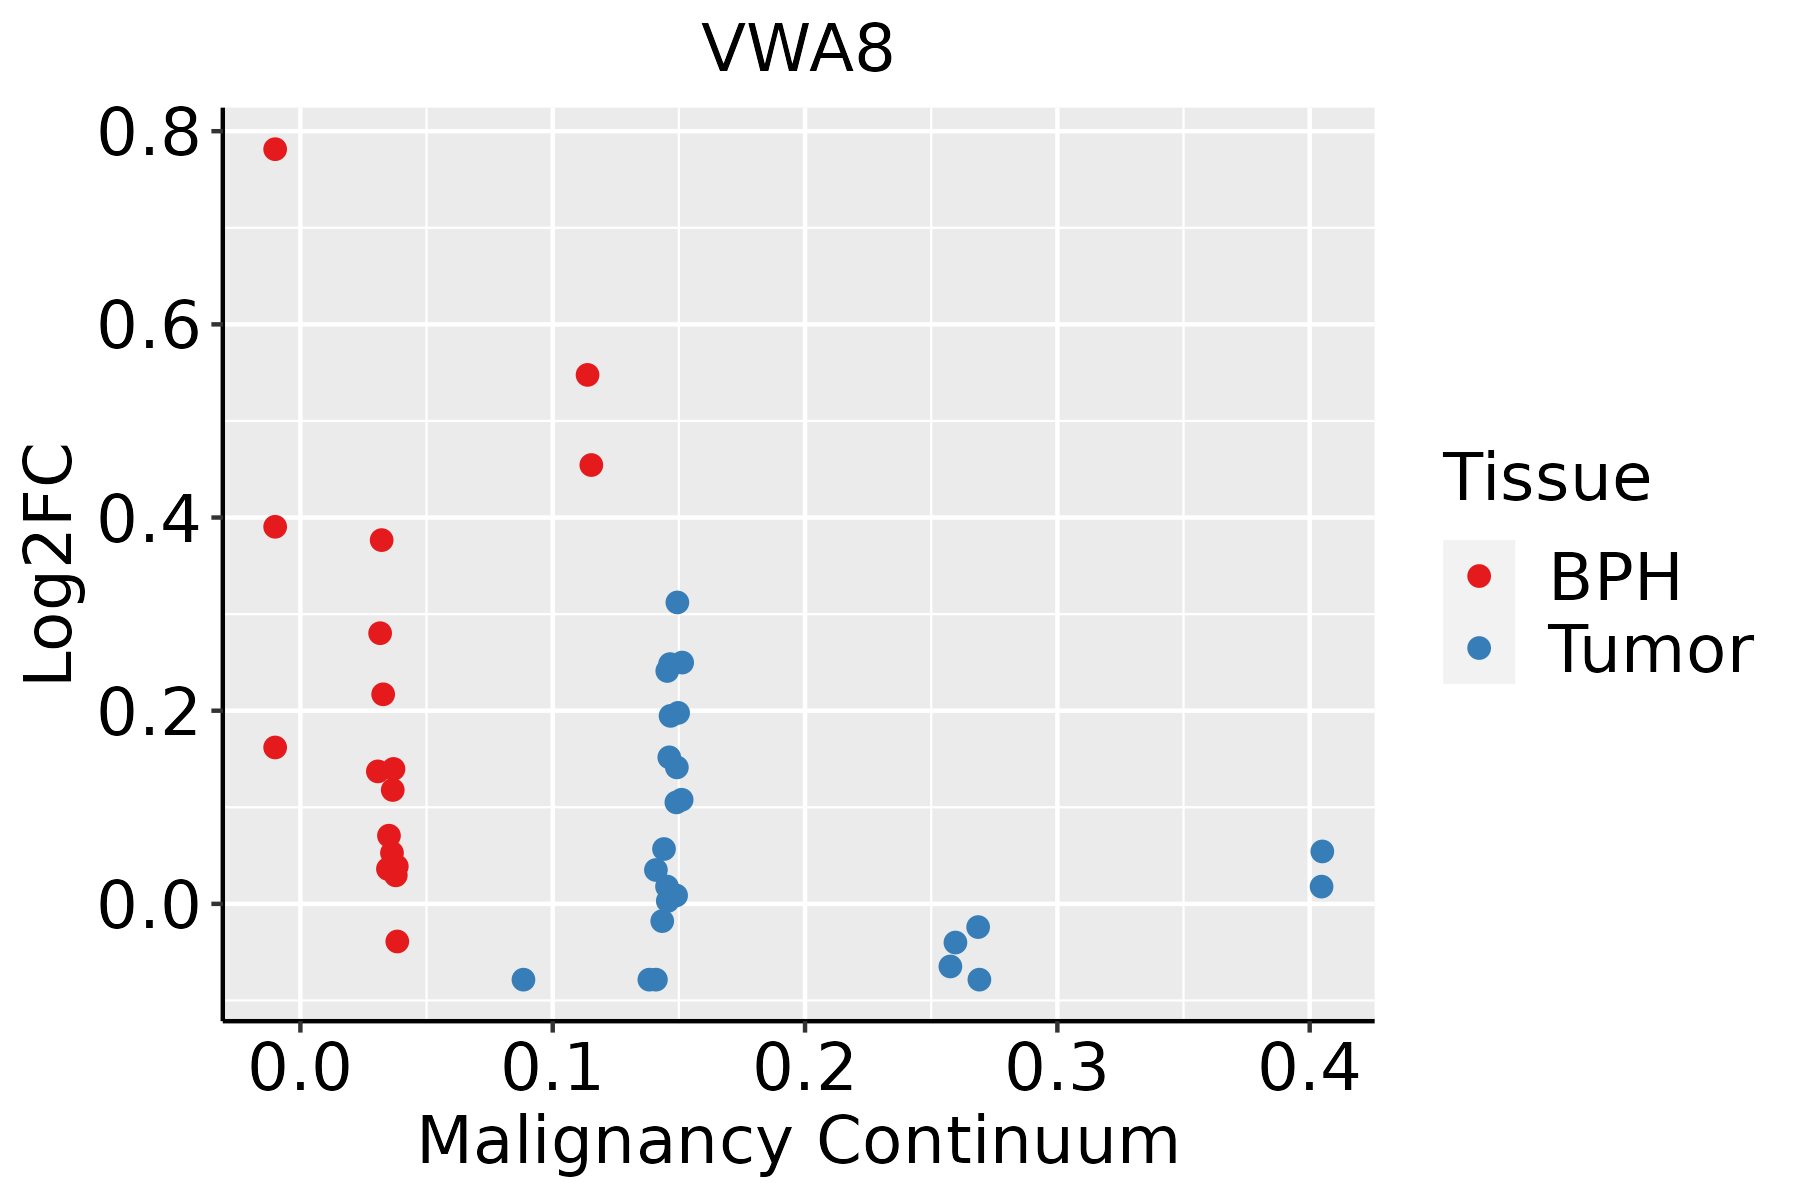 | BPH: Benign Prostatic Hyperplasia |
| ∗log2FC in expression of this searched gene in stem-like cells from each diseased tissue sample relative to stem-like cells in normal samples in each tissue plotted against the malignancy continuum. Samples are colored based on if they are from different disease stage. |
Top |
Malignant transformation related pathway analysis |
| Find out the enriched GO biological processes and KEGG pathways involved in transition from healthy to precancer to cancer |
| Tissue | Disease Stage | Enriched GO biological Processes |
| Colorectum | AD |  |
| Colorectum | SER |  |
| Colorectum | MSS |  |
| Colorectum | MSI-H |  |
| Colorectum | FAP |  |
| ∗Top 15 enriched GO BP terms are showed in the bar plot of each disease state in each tissue. Each row represents a significant GO biological process which is colored according to the -log10(p.adjust). |
| Page: 1 2 3 4 5 6 7 8 9 |
| GO ID | Tissue | Disease Stage | Description | Gene Ratio | Bg Ratio | pvalue | p.adjust | Count |
| Page: 1 |
| Pathway ID | Tissue | Disease Stage | Description | Gene Ratio | Bg Ratio | pvalue | p.adjust | qvalue | Count |
| Page: 1 |
Top |
Cell-cell communication analysis |
| Identification of potential cell-cell interactions between two cell types and their ligand-receptor pairs for different disease states |
| Ligand | Receptor | LRpair | Pathway | Tissue | Disease Stage |
| Page: 1 |
Top |
Single-cell gene regulatory network inference analysis |
| Find out the significant the regulons (TFs) and the target genes of each regulon across cell types for different disease states |
| TF | Cell Type | Tissue | Disease Stage | Target Gene | RSS | Regulon Activity |
| ∗The dot plots of a searched regulon are shown for all cell subpopulations in each disease state of each tissue based on the regulon specific score inferred using pySCENIC and by calculating the average expression. |
| Page: 1 |
Top |
Somatic mutation of malignant transformation related genes |
| Annotation of somatic variants for genes involved in malignant transformation |
| Hugo Symbol | Variant Class | Variant Classification | dbSNP RS | HGVSc | HGVSp | HGVSp Short | SWISSPROT | BIOTYPE | SIFT | PolyPhen | Tumor Sample Barcode | Tissue | Histology | Sex | Age | Stage | Therapy Types | Drugs | Outcome |
| VWA8 | SNV | Missense_Mutation | c.2927N>T | p.Ser976Phe | p.S976F | A3KMH1 | protein_coding | deleterious(0) | probably_damaging(0.999) | TCGA-A2-A0CL-01 | Breast | breast invasive carcinoma | Female | <65 | III/IV | Chemotherapy | cytoxan | SD | |
| VWA8 | SNV | Missense_Mutation | c.2446C>T | p.Leu816Phe | p.L816F | A3KMH1 | protein_coding | deleterious(0) | probably_damaging(0.995) | TCGA-A2-A0CX-01 | Breast | breast invasive carcinoma | Female | <65 | I/II | Chemotherapy | adriamycin | SD | |
| VWA8 | SNV | Missense_Mutation | c.677N>G | p.Ser226Cys | p.S226C | A3KMH1 | protein_coding | deleterious(0.04) | possibly_damaging(0.617) | TCGA-AC-A23H-01 | Breast | breast invasive carcinoma | Female | >=65 | I/II | Unknown | Unknown | PD | |
| VWA8 | SNV | Missense_Mutation | rs186939342 | c.1369N>A | p.Ala457Thr | p.A457T | A3KMH1 | protein_coding | tolerated(0.19) | possibly_damaging(0.792) | TCGA-AC-A62V-01 | Breast | breast invasive carcinoma | Male | <65 | III/IV | Targeted Molecular therapy | denosumab | PD |
| VWA8 | SNV | Missense_Mutation | novel | c.2097N>C | p.Glu699Asp | p.E699D | A3KMH1 | protein_coding | tolerated(0.43) | benign(0.033) | TCGA-AN-A046-01 | Breast | breast invasive carcinoma | Female | >=65 | I/II | Unknown | Unknown | SD |
| VWA8 | SNV | Missense_Mutation | novel | c.289N>C | p.Met97Leu | p.M97L | A3KMH1 | protein_coding | tolerated(0.62) | benign(0.023) | TCGA-AN-A046-01 | Breast | breast invasive carcinoma | Female | >=65 | I/II | Unknown | Unknown | SD |
| VWA8 | SNV | Missense_Mutation | c.919N>C | p.Thr307Pro | p.T307P | A3KMH1 | protein_coding | deleterious(0.02) | benign(0.391) | TCGA-BH-A0DE-01 | Breast | breast invasive carcinoma | Female | <65 | I/II | Unknown | Unknown | SD | |
| VWA8 | SNV | Missense_Mutation | c.1117N>T | p.Pro373Ser | p.P373S | A3KMH1 | protein_coding | tolerated(0.2) | benign(0.052) | TCGA-BH-A0HF-01 | Breast | breast invasive carcinoma | Female | >=65 | I/II | Hormone Therapy | arimidex | SD | |
| VWA8 | SNV | Missense_Mutation | c.3190N>G | p.Leu1064Val | p.L1064V | A3KMH1 | protein_coding | tolerated(0.15) | probably_damaging(0.918) | TCGA-D8-A1XQ-01 | Breast | breast invasive carcinoma | Female | >=65 | I/II | Unknown | Unknown | SD | |
| VWA8 | SNV | Missense_Mutation | c.5325N>A | p.Met1775Ile | p.M1775I | A3KMH1 | protein_coding | tolerated(0.5) | benign(0) | TCGA-E2-A14Z-01 | Breast | breast invasive carcinoma | Female | <65 | I/II | Hormone Therapy | arimidex | PD |
| Page: 1 2 3 4 5 6 7 8 9 10 11 12 13 14 15 16 17 18 19 20 |
Top |
Related drugs of malignant transformation related genes |
| Identification of chemicals and drugs interact with genes involved in malignant transfromation |
| (DGIdb 4.0) |
| Entrez ID | Symbol | Category | Interaction Types | Drug Claim Name | Drug Name | PMIDs |
| Page: 1 |

Copyright 2023-Present -The University of Texas Health Science Center at Houston |