
|
|||||
|
 | |
| |
| |
| |
| |
| |
|
Gene: VWA5A |
Gene summary for VWA5A |
| Gene information | Species | Human | Gene symbol | VWA5A | Gene ID | 4013 |
| Gene name | von Willebrand factor A domain containing 5A | |
| Gene Alias | BCSC-1 | |
| Cytomap | 11q24.2 | |
| Gene Type | protein-coding | GO ID | GO:0005575 | UniProtAcc | A0A024R3H3 |
Top |
Malignant transformation analysis |
| Identification of the aberrant gene expression in precancerous and cancerous lesions by comparing the gene expression of stem-like cells in diseased tissues with normal stem cells |
| Entrez ID | Symbol | Replicates | Species | Organ | Tissue | Adj P-value | Log2FC | Malignancy |
| 4013 | VWA5A | CA_HPV_1 | Human | Cervix | CC | 1.17e-23 | -5.54e-01 | 0.0264 |
| 4013 | VWA5A | CA_HPV_3 | Human | Cervix | CC | 1.31e-03 | -3.16e-01 | 0.0414 |
| 4013 | VWA5A | N_HPV_2 | Human | Cervix | N_HPV | 2.73e-07 | -4.25e-01 | -0.0131 |
| 4013 | VWA5A | CCI_1 | Human | Cervix | CC | 4.62e-06 | -6.76e-01 | 0.528 |
| 4013 | VWA5A | CCI_3 | Human | Cervix | CC | 2.47e-06 | -6.60e-01 | 0.516 |
| 4013 | VWA5A | CCII_1 | Human | Cervix | CC | 6.52e-10 | -6.64e-01 | 0.3249 |
| 4013 | VWA5A | Tumor | Human | Cervix | CC | 8.85e-30 | -6.65e-01 | 0.1241 |
| 4013 | VWA5A | sample1 | Human | Cervix | CC | 4.04e-06 | -6.29e-01 | 0.0959 |
| 4013 | VWA5A | sample3 | Human | Cervix | CC | 2.16e-28 | -6.63e-01 | 0.1387 |
| 4013 | VWA5A | H2 | Human | Cervix | HSIL_HPV | 4.21e-16 | -5.49e-01 | 0.0632 |
| 4013 | VWA5A | L1 | Human | Cervix | CC | 2.66e-07 | -6.06e-01 | 0.0802 |
| 4013 | VWA5A | T1 | Human | Cervix | CC | 6.40e-16 | -6.31e-01 | 0.0918 |
| 4013 | VWA5A | T3 | Human | Cervix | CC | 8.31e-29 | -6.70e-01 | 0.1389 |
| 4013 | VWA5A | HTA11_1938_2000001011 | Human | Colorectum | AD | 2.00e-04 | 4.51e-01 | -0.0811 |
| 4013 | VWA5A | HTA11_347_2000001011 | Human | Colorectum | AD | 1.34e-19 | 6.93e-01 | -0.1954 |
| 4013 | VWA5A | HTA11_1391_2000001011 | Human | Colorectum | AD | 6.30e-07 | 4.38e-01 | -0.059 |
| 4013 | VWA5A | HTA11_866_3004761011 | Human | Colorectum | AD | 8.72e-04 | 3.08e-01 | 0.096 |
| 4013 | VWA5A | HTA11_6818_2000001021 | Human | Colorectum | AD | 1.73e-04 | 3.55e-01 | 0.0588 |
| 4013 | VWA5A | CRC-1-8810 | Human | Colorectum | CRC | 3.76e-03 | -1.40e-01 | 0.6257 |
| 4013 | VWA5A | CRC-3-11773 | Human | Colorectum | CRC | 4.38e-06 | -1.62e-01 | 0.2564 |
| Page: 1 2 3 4 |
| Tissue | Expression Dynamics | Abbreviation |
| Cervix | 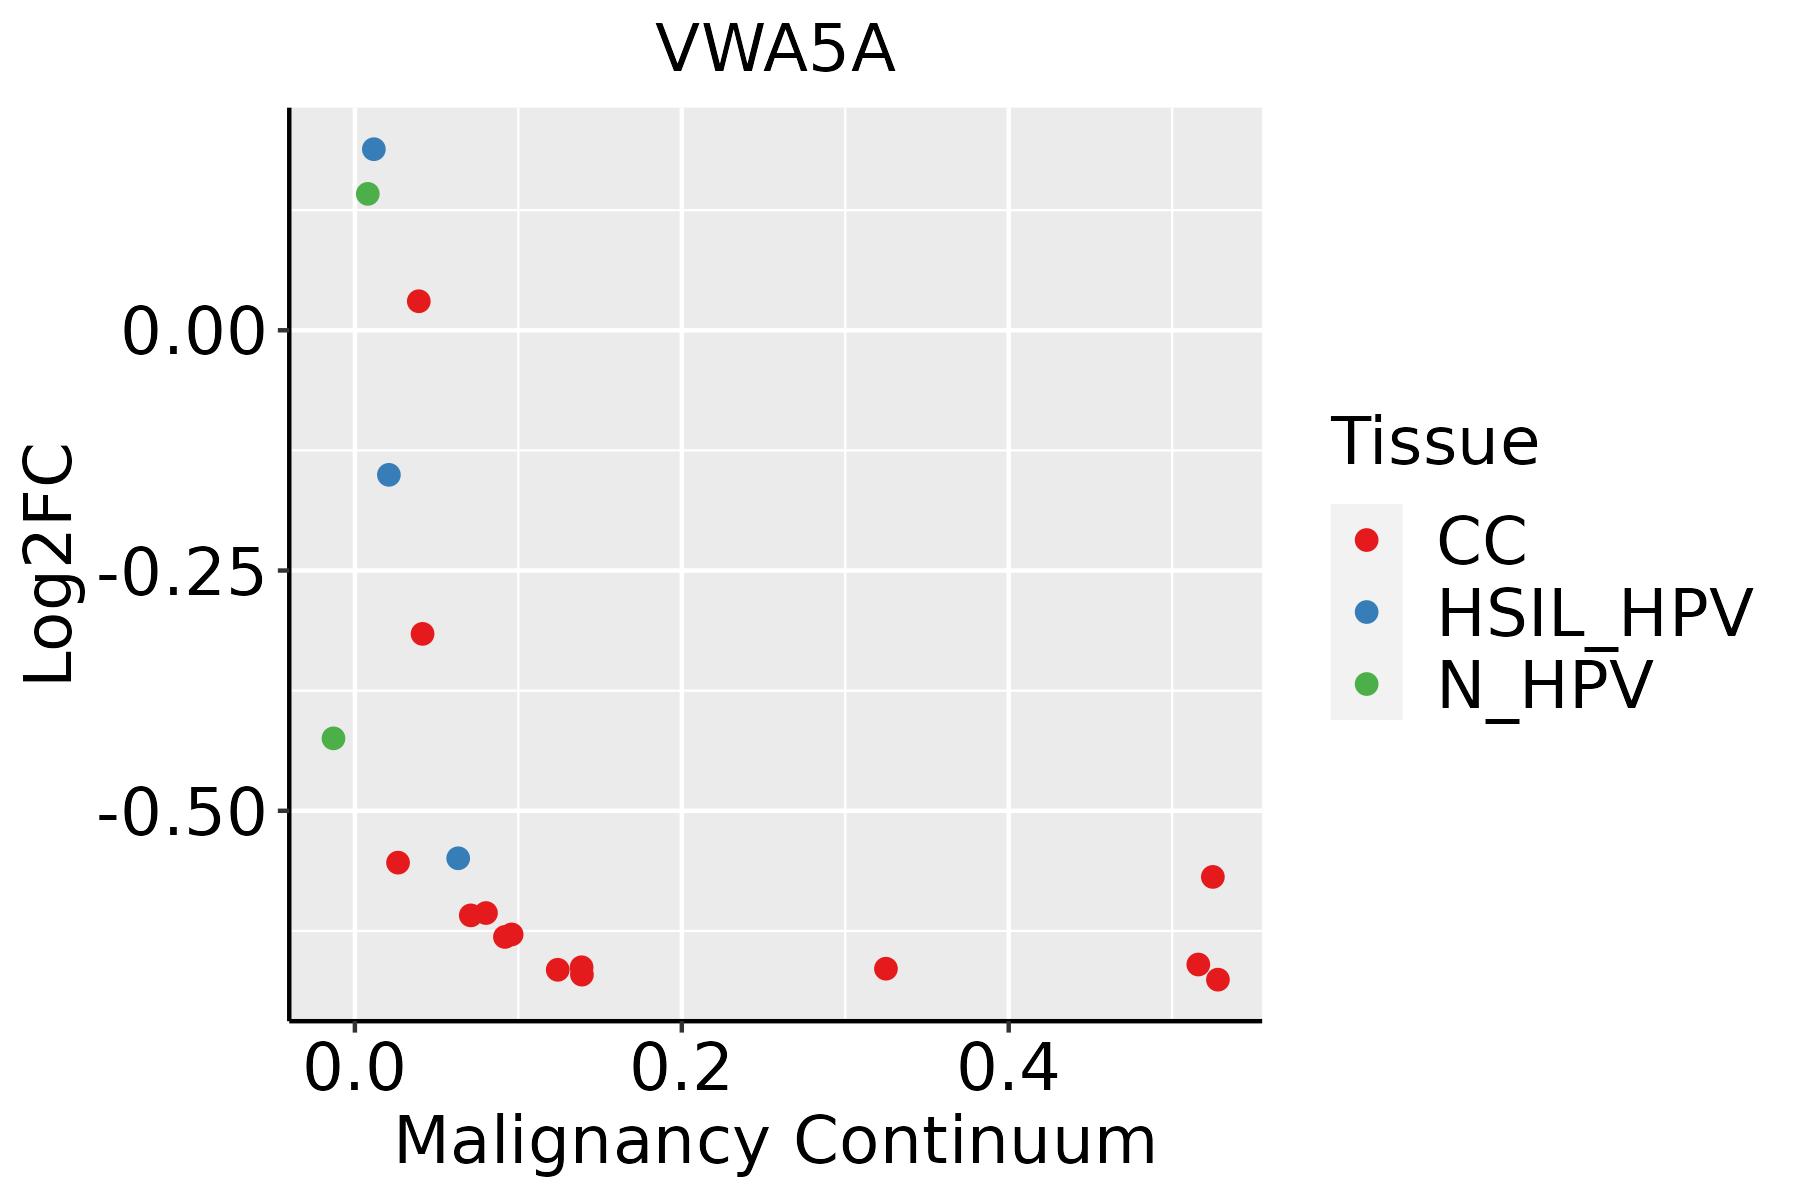 | CC: Cervix cancer |
| HSIL_HPV: HPV-infected high-grade squamous intraepithelial lesions | ||
| N_HPV: HPV-infected normal cervix | ||
| Colorectum (GSE201348) |  | FAP: Familial adenomatous polyposis |
| CRC: Colorectal cancer | ||
| Colorectum (HTA11) |  | AD: Adenomas |
| SER: Sessile serrated lesions | ||
| MSI-H: Microsatellite-high colorectal cancer | ||
| MSS: Microsatellite stable colorectal cancer | ||
| Esophagus | 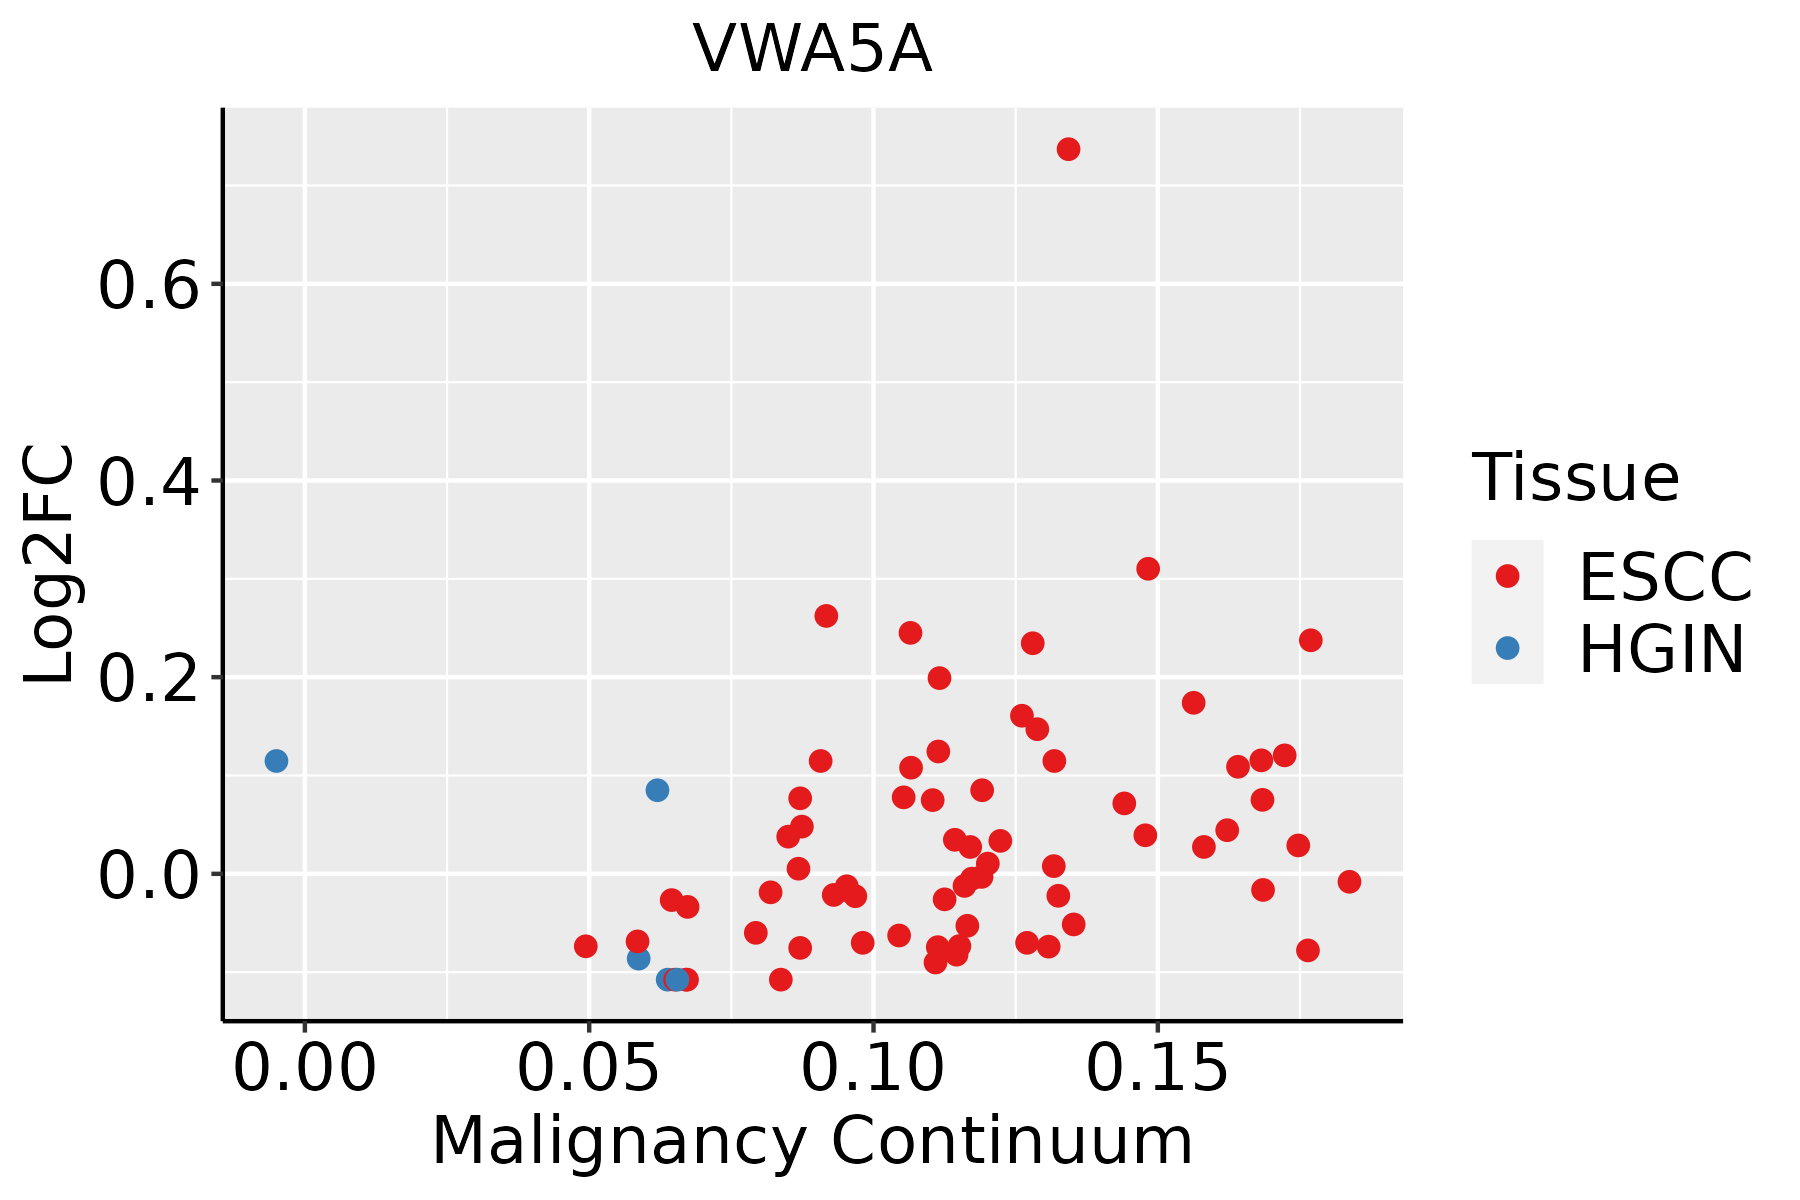 | ESCC: Esophageal squamous cell carcinoma |
| HGIN: High-grade intraepithelial neoplasias | ||
| LGIN: Low-grade intraepithelial neoplasias | ||
| Liver | 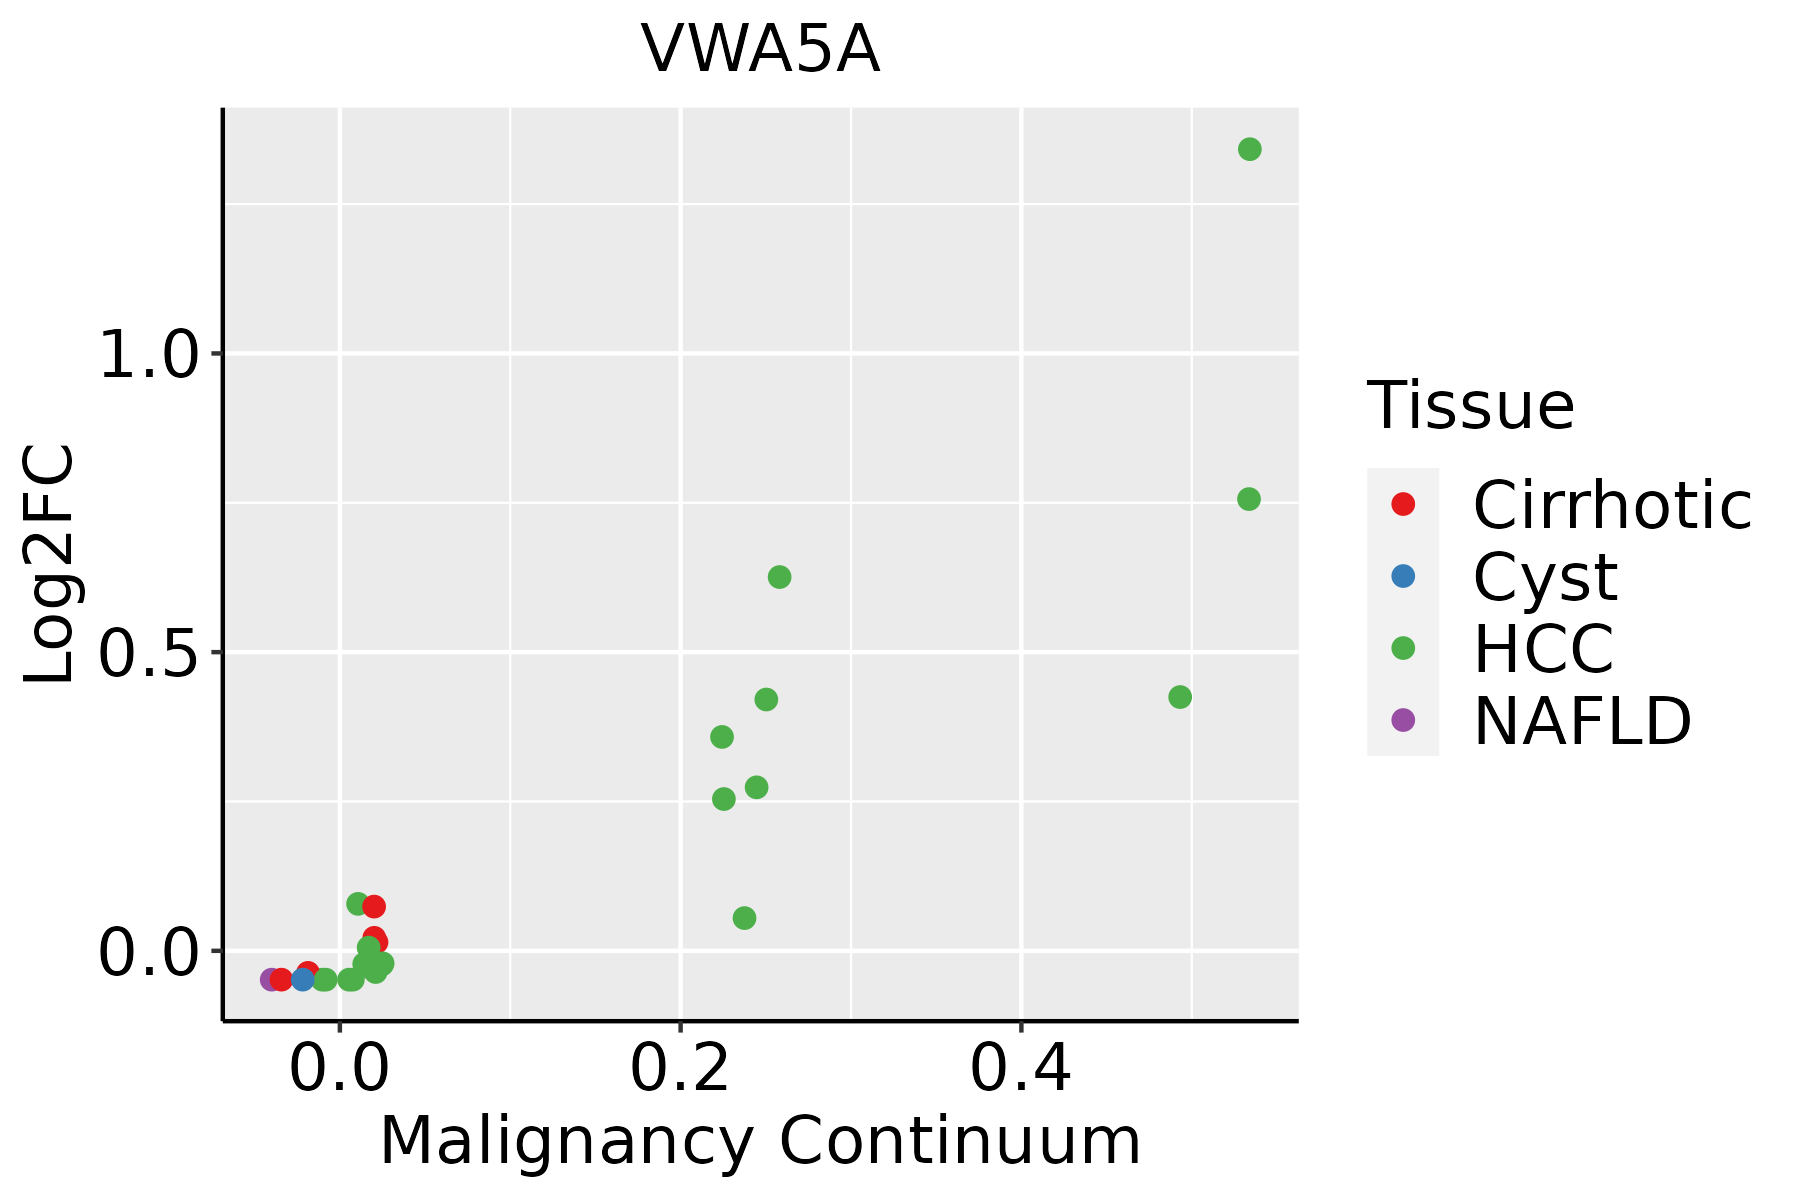 | HCC: Hepatocellular carcinoma |
| NAFLD: Non-alcoholic fatty liver disease |
| ∗log2FC in expression of this searched gene in stem-like cells from each diseased tissue sample relative to stem-like cells in normal samples in each tissue plotted against the malignancy continuum. Samples are colored based on if they are from different disease stage. |
Top |
Malignant transformation related pathway analysis |
| Find out the enriched GO biological processes and KEGG pathways involved in transition from healthy to precancer to cancer |
| Tissue | Disease Stage | Enriched GO biological Processes |
| Colorectum | AD |  |
| Colorectum | SER |  |
| Colorectum | MSS |  |
| Colorectum | MSI-H |  |
| Colorectum | FAP |  |
| ∗Top 15 enriched GO BP terms are showed in the bar plot of each disease state in each tissue. Each row represents a significant GO biological process which is colored according to the -log10(p.adjust). |
| Page: 1 2 3 4 5 6 7 8 9 |
| GO ID | Tissue | Disease Stage | Description | Gene Ratio | Bg Ratio | pvalue | p.adjust | Count |
| Page: 1 |
| Pathway ID | Tissue | Disease Stage | Description | Gene Ratio | Bg Ratio | pvalue | p.adjust | qvalue | Count |
| Page: 1 |
Top |
Cell-cell communication analysis |
| Identification of potential cell-cell interactions between two cell types and their ligand-receptor pairs for different disease states |
| Ligand | Receptor | LRpair | Pathway | Tissue | Disease Stage |
| Page: 1 |
Top |
Single-cell gene regulatory network inference analysis |
| Find out the significant the regulons (TFs) and the target genes of each regulon across cell types for different disease states |
| TF | Cell Type | Tissue | Disease Stage | Target Gene | RSS | Regulon Activity |
| ∗The dot plots of a searched regulon are shown for all cell subpopulations in each disease state of each tissue based on the regulon specific score inferred using pySCENIC and by calculating the average expression. |
| Page: 1 |
Top |
Somatic mutation of malignant transformation related genes |
| Annotation of somatic variants for genes involved in malignant transformation |
| Hugo Symbol | Variant Class | Variant Classification | dbSNP RS | HGVSc | HGVSp | HGVSp Short | SWISSPROT | BIOTYPE | SIFT | PolyPhen | Tumor Sample Barcode | Tissue | Histology | Sex | Age | Stage | Therapy Types | Drugs | Outcome |
| VWA5A | SNV | Missense_Mutation | rs763551541 | c.1886N>A | p.Arg629Gln | p.R629Q | O00534 | protein_coding | tolerated(0.6) | benign(0.048) | TCGA-A7-A5ZX-01 | Breast | breast invasive carcinoma | Female | <65 | III/IV | Chemotherapy | doxorubicin | CR |
| VWA5A | SNV | Missense_Mutation | c.1813N>T | p.His605Tyr | p.H605Y | O00534 | protein_coding | tolerated(0.45) | benign(0.296) | TCGA-BH-A0B6-01 | Breast | breast invasive carcinoma | Female | <65 | I/II | Unknown | Unknown | SD | |
| VWA5A | SNV | Missense_Mutation | novel | c.581A>G | p.Lys194Arg | p.K194R | O00534 | protein_coding | tolerated(0.89) | benign(0.015) | TCGA-S3-AA14-01 | Breast | breast invasive carcinoma | Female | <65 | I/II | Chemotherapy | adriamycin | CR |
| VWA5A | deletion | Frame_Shift_Del | novel | c.2083delG | p.Asp695IlefsTer2 | p.D695Ifs*2 | O00534 | protein_coding | TCGA-EW-A2FV-01 | Breast | breast invasive carcinoma | Female | <65 | III/IV | Chemotherapy | docetaxel | SD | ||
| VWA5A | SNV | Missense_Mutation | c.827C>T | p.Ser276Leu | p.S276L | O00534 | protein_coding | tolerated(0.06) | benign(0.005) | TCGA-Q1-A6DW-01 | Cervix | cervical & endocervical cancer | Female | <65 | I/II | Chemotherapy | cisplatin | SD | |
| VWA5A | SNV | Missense_Mutation | rs533874979 | c.340G>T | p.Val114Leu | p.V114L | O00534 | protein_coding | tolerated(0.1) | possibly_damaging(0.856) | TCGA-ZJ-A8QR-01 | Cervix | cervical & endocervical cancer | Female | <65 | I/II | Unknown | Unknown | SD |
| VWA5A | SNV | Missense_Mutation | rs771497215 | c.2018N>A | p.Ser673Asn | p.S673N | O00534 | protein_coding | tolerated(0.48) | benign(0.046) | TCGA-AA-3672-01 | Colorectum | colon adenocarcinoma | Female | >=65 | III/IV | Unknown | Unknown | SD |
| VWA5A | SNV | Missense_Mutation | c.1294N>T | p.Gly432Cys | p.G432C | O00534 | protein_coding | deleterious(0) | probably_damaging(0.999) | TCGA-AA-A010-01 | Colorectum | colon adenocarcinoma | Female | <65 | I/II | Chemotherapy | folinic | CR | |
| VWA5A | SNV | Missense_Mutation | novel | c.374N>C | p.Val125Ala | p.V125A | O00534 | protein_coding | deleterious(0) | possibly_damaging(0.794) | TCGA-AM-5821-01 | Colorectum | colon adenocarcinoma | Female | >=65 | I/II | Unknown | Unknown | SD |
| VWA5A | SNV | Missense_Mutation | c.1114N>T | p.Pro372Ser | p.P372S | O00534 | protein_coding | deleterious(0.01) | probably_damaging(0.982) | TCGA-AZ-6598-01 | Colorectum | colon adenocarcinoma | Female | >=65 | I/II | Unknown | Unknown | SD |
| Page: 1 2 3 4 5 6 7 8 9 10 |
Top |
Related drugs of malignant transformation related genes |
| Identification of chemicals and drugs interact with genes involved in malignant transfromation |
| (DGIdb 4.0) |
| Entrez ID | Symbol | Category | Interaction Types | Drug Claim Name | Drug Name | PMIDs |
| Page: 1 |

Copyright 2023-Present -The University of Texas Health Science Center at Houston |