
|
|||||
|
 | |
| |
| |
| |
| |
| |
|
Gene: VWA3B |
Gene summary for VWA3B |
| Gene information | Species | Human | Gene symbol | VWA3B | Gene ID | 200403 |
| Gene name | von Willebrand factor A domain containing 3B | |
| Gene Alias | SCAR22 | |
| Cytomap | 2q11.2 | |
| Gene Type | protein-coding | GO ID | GO:0005575 | UniProtAcc | B7Z3D8 |
Top |
Malignant transformation analysis |
| Identification of the aberrant gene expression in precancerous and cancerous lesions by comparing the gene expression of stem-like cells in diseased tissues with normal stem cells |
| Entrez ID | Symbol | Replicates | Species | Organ | Tissue | Adj P-value | Log2FC | Malignancy |
| 200403 | VWA3B | HTA11_347_2000001011 | Human | Colorectum | AD | 1.98e-05 | 1.79e-01 | -0.1954 |
| 200403 | VWA3B | HTA11_4255_2000001011 | Human | Colorectum | SER | 1.84e-02 | 2.68e-01 | 0.0446 |
| 200403 | VWA3B | HTA11_7663_2000001011 | Human | Colorectum | SER | 7.03e-06 | 4.87e-01 | 0.0131 |
| 200403 | VWA3B | HTA11_7696_3000711011 | Human | Colorectum | AD | 1.24e-08 | 2.12e-01 | 0.0674 |
| 200403 | VWA3B | HTA11_6818_2000001011 | Human | Colorectum | AD | 5.80e-21 | 9.77e-01 | 0.0112 |
| 200403 | VWA3B | HTA11_7469_2000001011 | Human | Colorectum | AD | 1.90e-05 | 5.19e-01 | -0.0124 |
| 200403 | VWA3B | HTA11_11156_2000001011 | Human | Colorectum | AD | 6.40e-03 | 4.52e-01 | 0.0397 |
| 200403 | VWA3B | HTA11_6818_2000001021 | Human | Colorectum | AD | 9.49e-19 | 6.36e-01 | 0.0588 |
| 200403 | VWA3B | HTA11_99999971662_82457 | Human | Colorectum | MSS | 1.02e-10 | 3.93e-01 | 0.3859 |
| 200403 | VWA3B | HTA11_99999974143_84620 | Human | Colorectum | MSS | 1.40e-19 | 4.41e-01 | 0.3005 |
| Page: 1 |
| Tissue | Expression Dynamics | Abbreviation |
| Colorectum (GSE201348) | 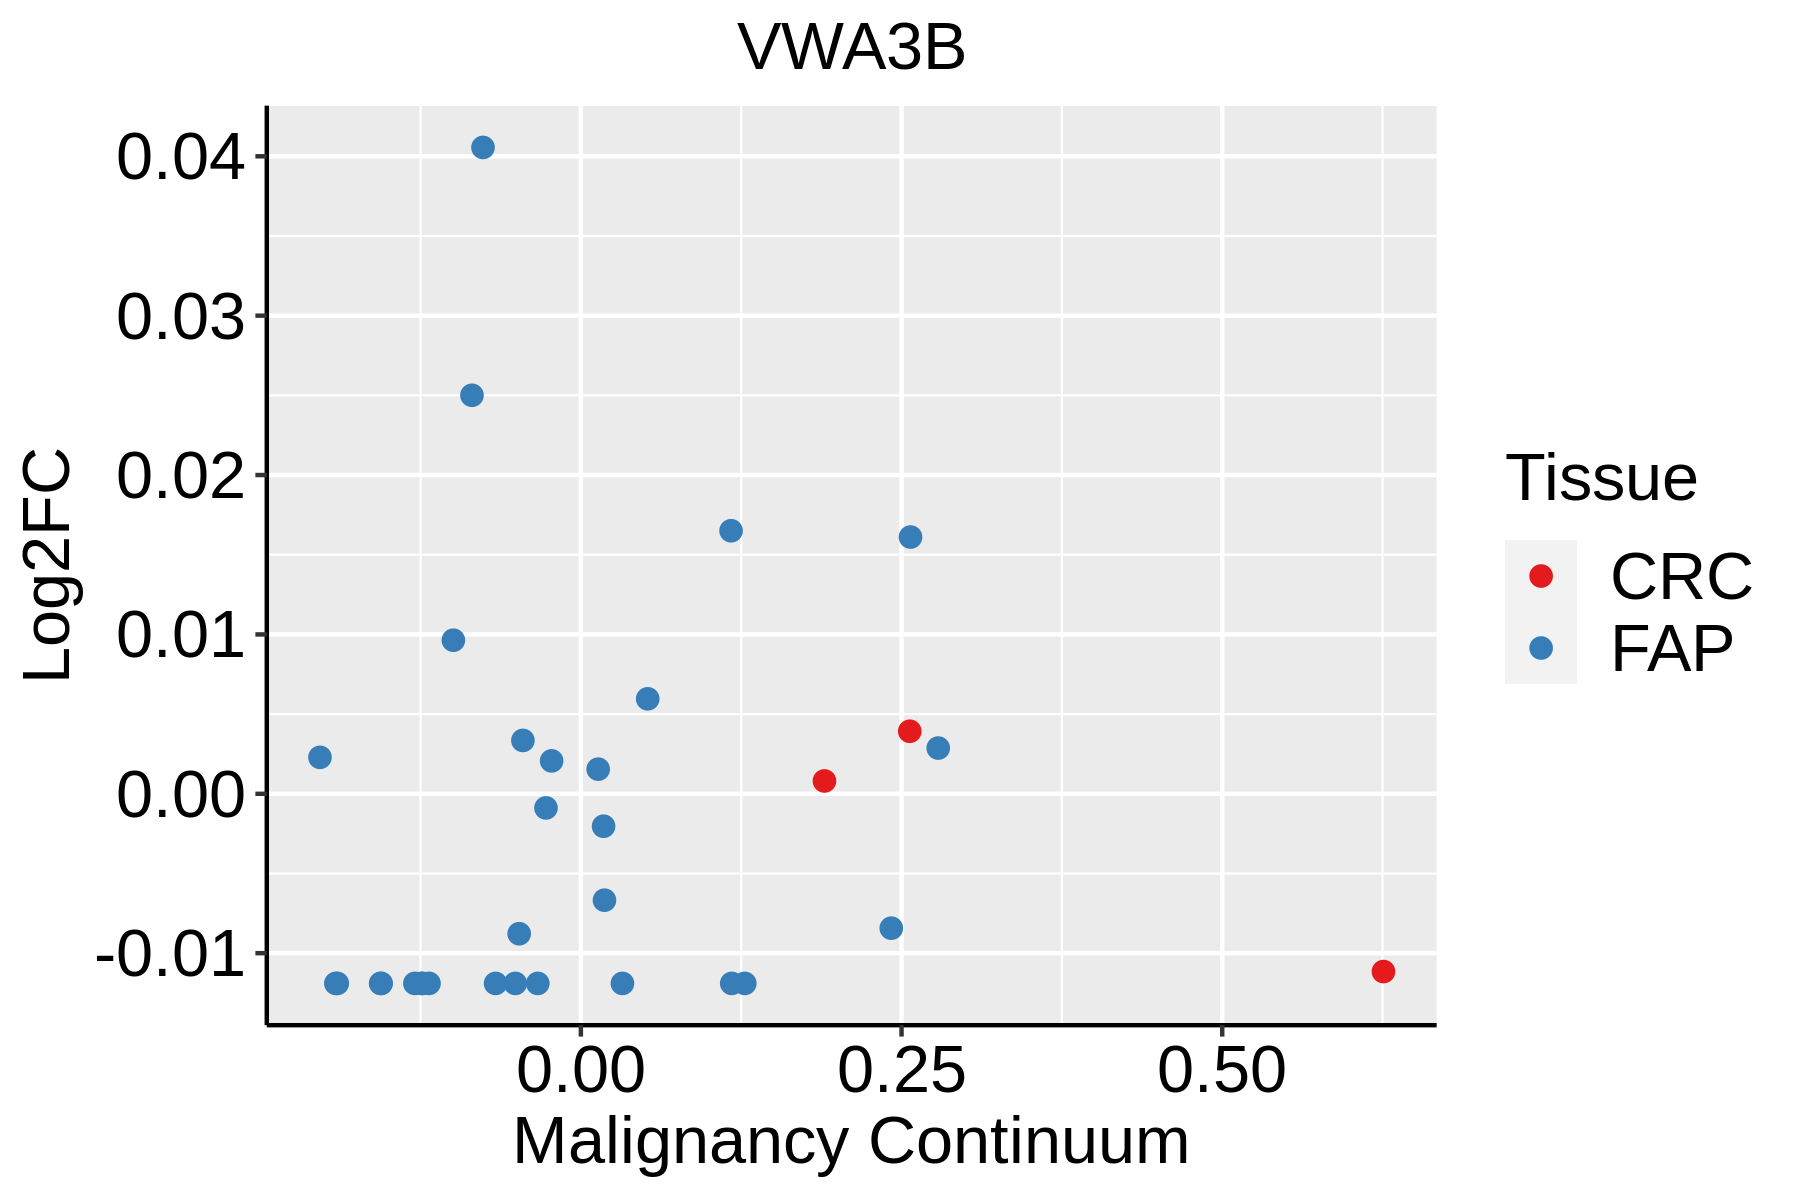 | FAP: Familial adenomatous polyposis |
| CRC: Colorectal cancer | ||
| Colorectum (HTA11) | 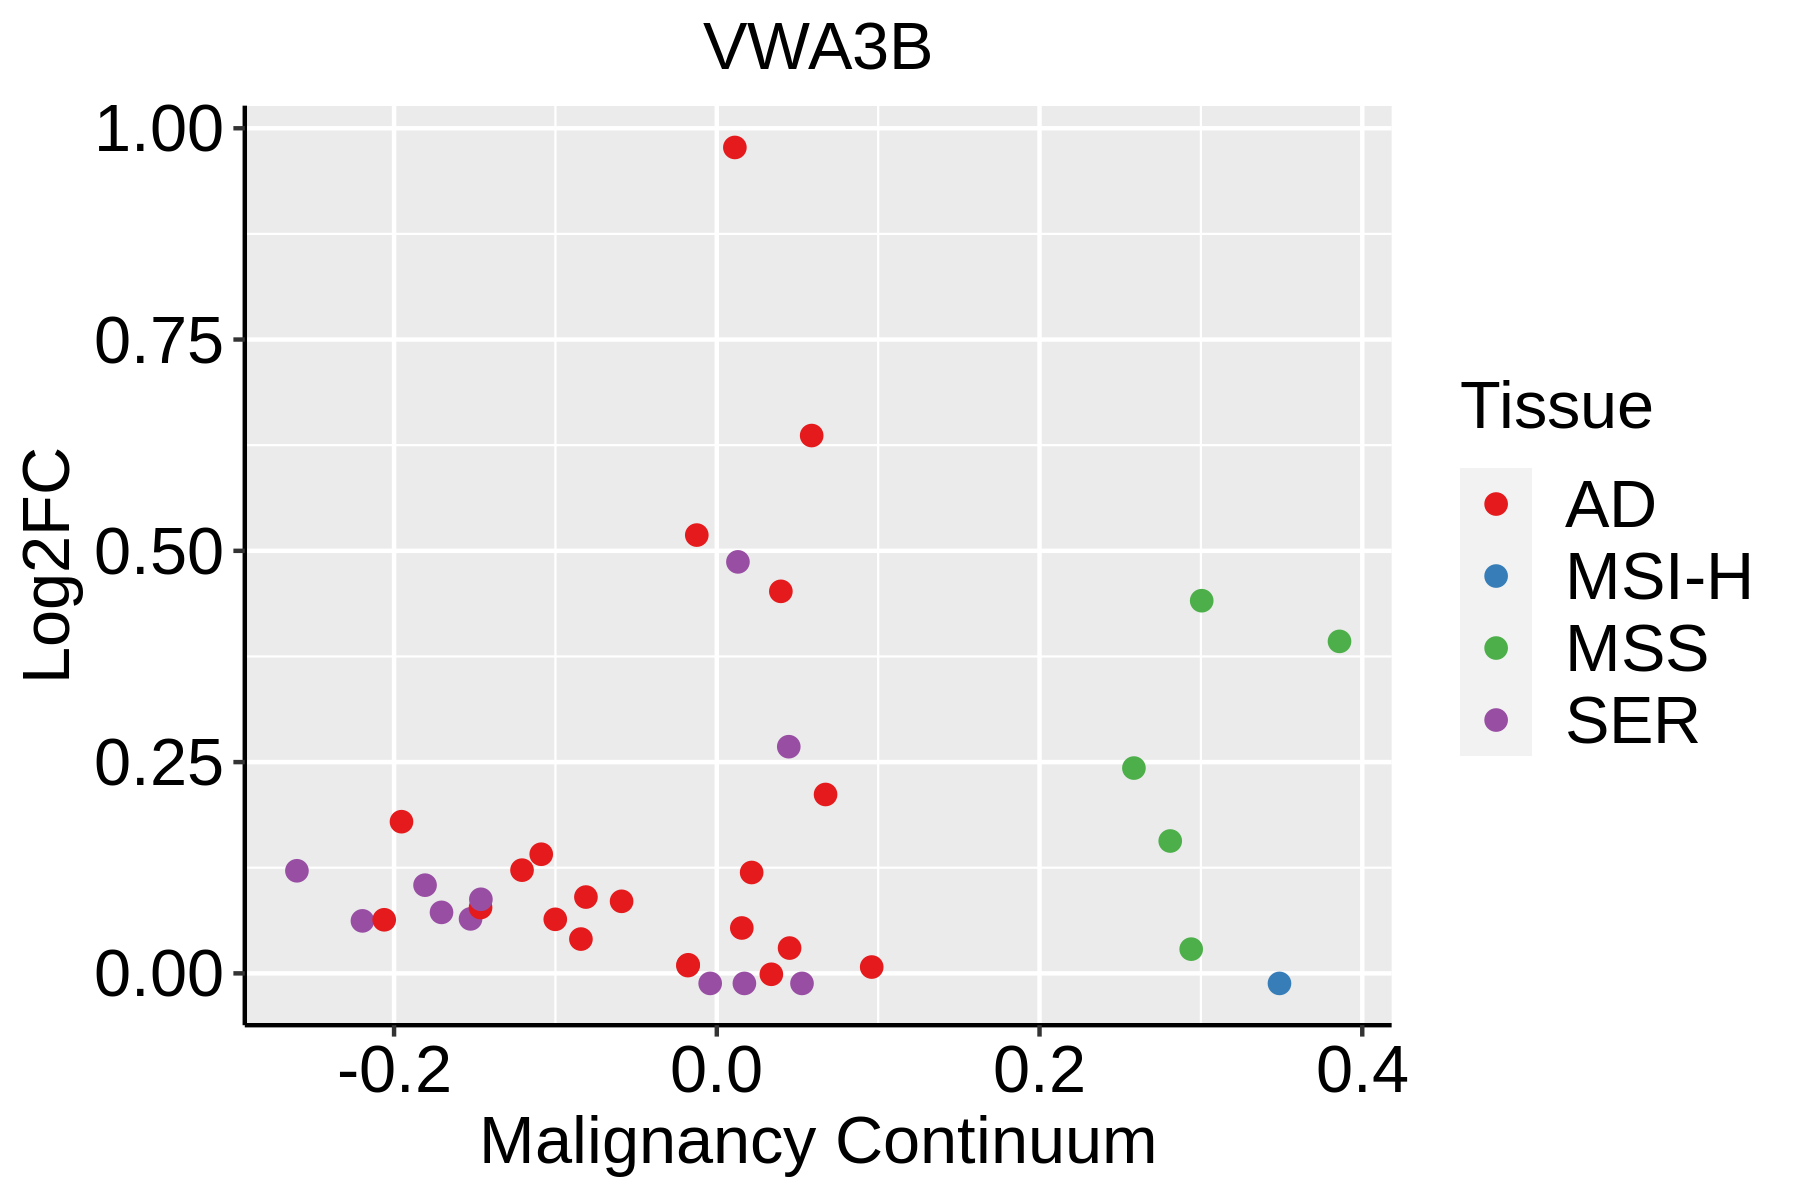 | AD: Adenomas |
| SER: Sessile serrated lesions | ||
| MSI-H: Microsatellite-high colorectal cancer | ||
| MSS: Microsatellite stable colorectal cancer |
| ∗log2FC in expression of this searched gene in stem-like cells from each diseased tissue sample relative to stem-like cells in normal samples in each tissue plotted against the malignancy continuum. Samples are colored based on if they are from different disease stage. |
Top |
Malignant transformation related pathway analysis |
| Find out the enriched GO biological processes and KEGG pathways involved in transition from healthy to precancer to cancer |
| Tissue | Disease Stage | Enriched GO biological Processes |
| Colorectum | AD |  |
| Colorectum | SER |  |
| Colorectum | MSS |  |
| Colorectum | MSI-H |  |
| Colorectum | FAP |  |
| ∗Top 15 enriched GO BP terms are showed in the bar plot of each disease state in each tissue. Each row represents a significant GO biological process which is colored according to the -log10(p.adjust). |
| Page: 1 2 3 4 5 6 7 8 9 |
| GO ID | Tissue | Disease Stage | Description | Gene Ratio | Bg Ratio | pvalue | p.adjust | Count |
| Page: 1 |
| Pathway ID | Tissue | Disease Stage | Description | Gene Ratio | Bg Ratio | pvalue | p.adjust | qvalue | Count |
| Page: 1 |
Top |
Cell-cell communication analysis |
| Identification of potential cell-cell interactions between two cell types and their ligand-receptor pairs for different disease states |
| Ligand | Receptor | LRpair | Pathway | Tissue | Disease Stage |
| Page: 1 |
Top |
Single-cell gene regulatory network inference analysis |
| Find out the significant the regulons (TFs) and the target genes of each regulon across cell types for different disease states |
| TF | Cell Type | Tissue | Disease Stage | Target Gene | RSS | Regulon Activity |
| ∗The dot plots of a searched regulon are shown for all cell subpopulations in each disease state of each tissue based on the regulon specific score inferred using pySCENIC and by calculating the average expression. |
| Page: 1 |
Top |
Somatic mutation of malignant transformation related genes |
| Annotation of somatic variants for genes involved in malignant transformation |
| Hugo Symbol | Variant Class | Variant Classification | dbSNP RS | HGVSc | HGVSp | HGVSp Short | SWISSPROT | BIOTYPE | SIFT | PolyPhen | Tumor Sample Barcode | Tissue | Histology | Sex | Age | Stage | Therapy Types | Drugs | Outcome |
| VWA3B | SNV | Missense_Mutation | c.1941N>C | p.Glu647Asp | p.E647D | Q502W6 | protein_coding | tolerated(0.09) | benign(0.022) | TCGA-A7-A0DA-01 | Breast | breast invasive carcinoma | Female | <65 | I/II | Chemotherapy | adriamycin | SD | |
| VWA3B | SNV | Missense_Mutation | novel | c.898N>C | p.Glu300Gln | p.E300Q | Q502W6 | protein_coding | tolerated(0.14) | benign(0.337) | TCGA-AC-A5XS-01 | Breast | breast invasive carcinoma | Female | >=65 | I/II | Hormone Therapy | femara | SD |
| VWA3B | SNV | Missense_Mutation | c.989N>A | p.Gly330Glu | p.G330E | Q502W6 | protein_coding | tolerated(0.05) | possibly_damaging(0.706) | TCGA-AN-A0FN-01 | Breast | breast invasive carcinoma | Female | <65 | I/II | Unknown | Unknown | SD | |
| VWA3B | SNV | Missense_Mutation | c.1892C>A | p.Thr631Asn | p.T631N | Q502W6 | protein_coding | deleterious(0) | probably_damaging(0.966) | TCGA-AN-A0FW-01 | Breast | breast invasive carcinoma | Female | >=65 | III/IV | Unknown | Unknown | SD | |
| VWA3B | SNV | Missense_Mutation | c.3260C>G | p.Ala1087Gly | p.A1087G | Q502W6 | protein_coding | deleterious(0.01) | possibly_damaging(0.815) | TCGA-AN-A0XN-01 | Breast | breast invasive carcinoma | Female | >=65 | III/IV | Unknown | Unknown | SD | |
| VWA3B | SNV | Missense_Mutation | c.3575C>T | p.Ala1192Val | p.A1192V | Q502W6 | protein_coding | tolerated_low_confidence(0.62) | benign(0) | TCGA-AR-A24R-01 | Breast | breast invasive carcinoma | Female | <65 | III/IV | Chemotherapy | cytoxan | SD | |
| VWA3B | SNV | Missense_Mutation | novel | c.553N>C | p.Glu185Gln | p.E185Q | Q502W6 | protein_coding | tolerated(0.24) | possibly_damaging(0.811) | TCGA-BH-A0B6-01 | Breast | breast invasive carcinoma | Female | <65 | I/II | Unknown | Unknown | SD |
| VWA3B | SNV | Missense_Mutation | c.30C>G | p.Ile10Met | p.I10M | Q502W6 | protein_coding | deleterious_low_confidence(0.01) | benign(0.293) | TCGA-GM-A2D9-01 | Breast | breast invasive carcinoma | Female | >=65 | I/II | Hormone Therapy | arimidex | SD | |
| VWA3B | SNV | Missense_Mutation | rs371022741 | c.3245N>T | p.Thr1082Met | p.T1082M | Q502W6 | protein_coding | tolerated(0.15) | benign(0.003) | TCGA-S3-AA14-01 | Breast | breast invasive carcinoma | Female | <65 | I/II | Chemotherapy | adriamycin | CR |
| VWA3B | insertion | Frame_Shift_Ins | novel | c.2595_2596insATCAACATTT | p.Ser866IlefsTer25 | p.S866Ifs*25 | Q502W6 | protein_coding | TCGA-A8-A07I-01 | Breast | breast invasive carcinoma | Female | >=65 | III/IV | Chemotherapy | 5-fluorouracil | CR |
| Page: 1 2 3 4 5 6 7 8 9 10 11 12 13 14 15 16 17 18 |
Top |
Related drugs of malignant transformation related genes |
| Identification of chemicals and drugs interact with genes involved in malignant transfromation |
| (DGIdb 4.0) |
| Entrez ID | Symbol | Category | Interaction Types | Drug Claim Name | Drug Name | PMIDs |
| Page: 1 |

Copyright 2023-Present -The University of Texas Health Science Center at Houston |