
|
|||||
|
 | |
| |
| |
| |
| |
| |
|
Gene: VTI1A |
Gene summary for VTI1A |
| Gene information | Species | Human | Gene symbol | VTI1A | Gene ID | 143187 |
| Gene name | vesicle transport through interaction with t-SNAREs 1A | |
| Gene Alias | MMDS3 | |
| Cytomap | 10q25.2 | |
| Gene Type | protein-coding | GO ID | GO:0003008 | UniProtAcc | Q96AJ9 |
Top |
Malignant transformation analysis |
| Identification of the aberrant gene expression in precancerous and cancerous lesions by comparing the gene expression of stem-like cells in diseased tissues with normal stem cells |
| Entrez ID | Symbol | Replicates | Species | Organ | Tissue | Adj P-value | Log2FC | Malignancy |
| 143187 | VTI1A | CCI_1 | Human | Cervix | CC | 1.97e-11 | 1.07e+00 | 0.528 |
| 143187 | VTI1A | CCI_2 | Human | Cervix | CC | 1.25e-15 | 1.56e+00 | 0.5249 |
| 143187 | VTI1A | CCI_3 | Human | Cervix | CC | 3.89e-07 | 6.75e-01 | 0.516 |
| 143187 | VTI1A | HTA11_3410_2000001011 | Human | Colorectum | AD | 3.97e-23 | -6.46e-01 | 0.0155 |
| 143187 | VTI1A | HTA11_2487_2000001011 | Human | Colorectum | SER | 1.04e-02 | -3.80e-01 | -0.1808 |
| 143187 | VTI1A | HTA11_347_2000001011 | Human | Colorectum | AD | 3.14e-04 | 4.15e-01 | -0.1954 |
| 143187 | VTI1A | HTA11_3361_2000001011 | Human | Colorectum | AD | 5.44e-04 | -3.74e-01 | -0.1207 |
| 143187 | VTI1A | HTA11_866_3004761011 | Human | Colorectum | AD | 1.85e-05 | -5.16e-01 | 0.096 |
| 143187 | VTI1A | HTA11_4255_2000001011 | Human | Colorectum | SER | 5.88e-05 | -5.31e-01 | 0.0446 |
| 143187 | VTI1A | HTA11_8622_2000001021 | Human | Colorectum | SER | 1.94e-04 | -7.18e-01 | 0.0528 |
| 143187 | VTI1A | HTA11_7696_3000711011 | Human | Colorectum | AD | 9.78e-07 | -3.72e-01 | 0.0674 |
| 143187 | VTI1A | HTA11_99999970781_79442 | Human | Colorectum | MSS | 2.19e-14 | -5.64e-01 | 0.294 |
| 143187 | VTI1A | HTA11_99999965104_69814 | Human | Colorectum | MSS | 2.77e-42 | 1.98e+00 | 0.281 |
| 143187 | VTI1A | HTA11_99999974143_84620 | Human | Colorectum | MSS | 3.04e-22 | -6.19e-01 | 0.3005 |
| 143187 | VTI1A | A001-C-207 | Human | Colorectum | FAP | 1.04e-02 | -3.71e-01 | 0.1278 |
| 143187 | VTI1A | A015-C-203 | Human | Colorectum | FAP | 7.29e-39 | -7.38e-01 | -0.1294 |
| 143187 | VTI1A | A015-C-204 | Human | Colorectum | FAP | 2.20e-07 | -4.83e-01 | -0.0228 |
| 143187 | VTI1A | A014-C-040 | Human | Colorectum | FAP | 2.28e-07 | -6.42e-01 | -0.1184 |
| 143187 | VTI1A | A002-C-201 | Human | Colorectum | FAP | 2.19e-12 | -5.31e-01 | 0.0324 |
| 143187 | VTI1A | A002-C-203 | Human | Colorectum | FAP | 4.26e-04 | -2.61e-01 | 0.2786 |
| Page: 1 2 3 4 5 6 7 8 9 |
| Tissue | Expression Dynamics | Abbreviation |
| Cervix |  | CC: Cervix cancer |
| HSIL_HPV: HPV-infected high-grade squamous intraepithelial lesions | ||
| N_HPV: HPV-infected normal cervix | ||
| Colorectum (GSE201348) |  | FAP: Familial adenomatous polyposis |
| CRC: Colorectal cancer | ||
| Colorectum (HTA11) |  | AD: Adenomas |
| SER: Sessile serrated lesions | ||
| MSI-H: Microsatellite-high colorectal cancer | ||
| MSS: Microsatellite stable colorectal cancer | ||
| Endometrium | 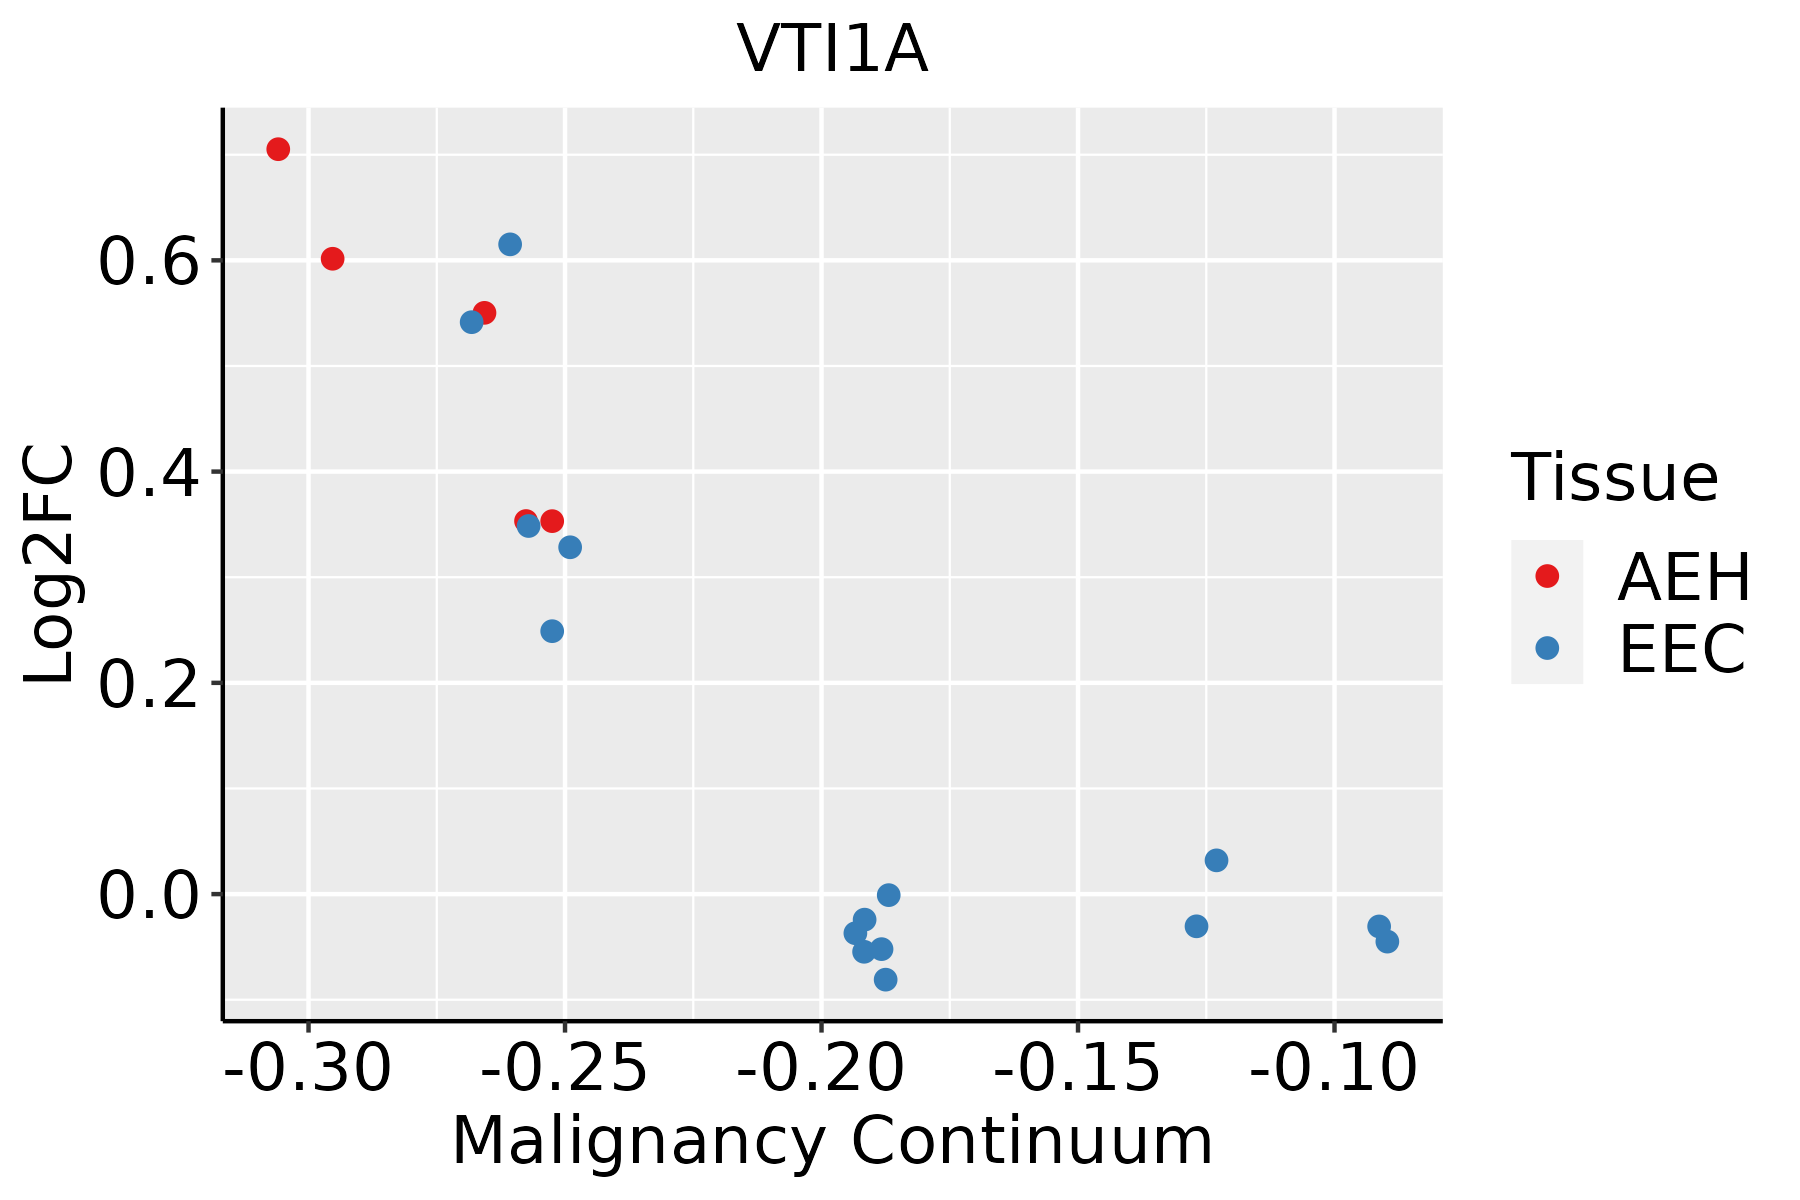 | AEH: Atypical endometrial hyperplasia |
| EEC: Endometrioid Cancer | ||
| Esophagus | 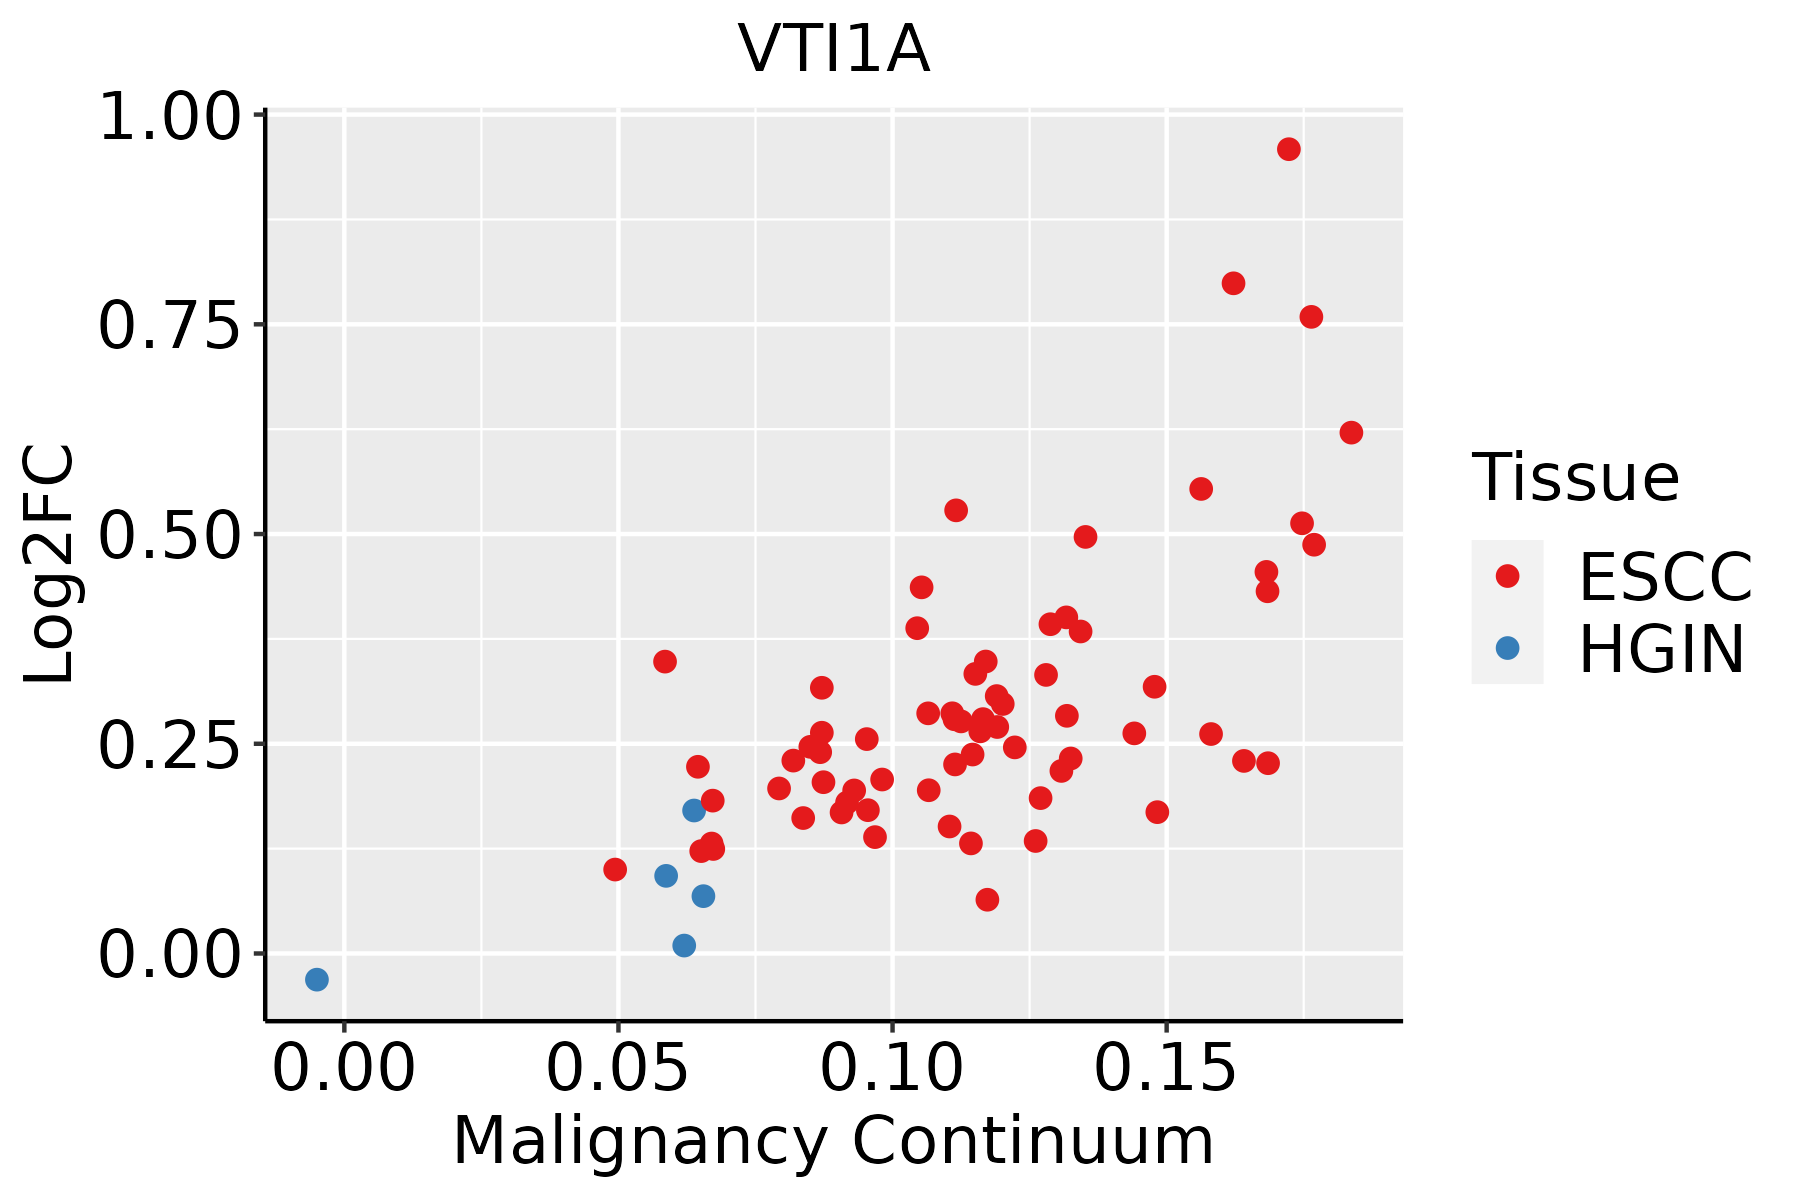 | ESCC: Esophageal squamous cell carcinoma |
| HGIN: High-grade intraepithelial neoplasias | ||
| LGIN: Low-grade intraepithelial neoplasias | ||
| Liver |  | HCC: Hepatocellular carcinoma |
| NAFLD: Non-alcoholic fatty liver disease | ||
| Lung | 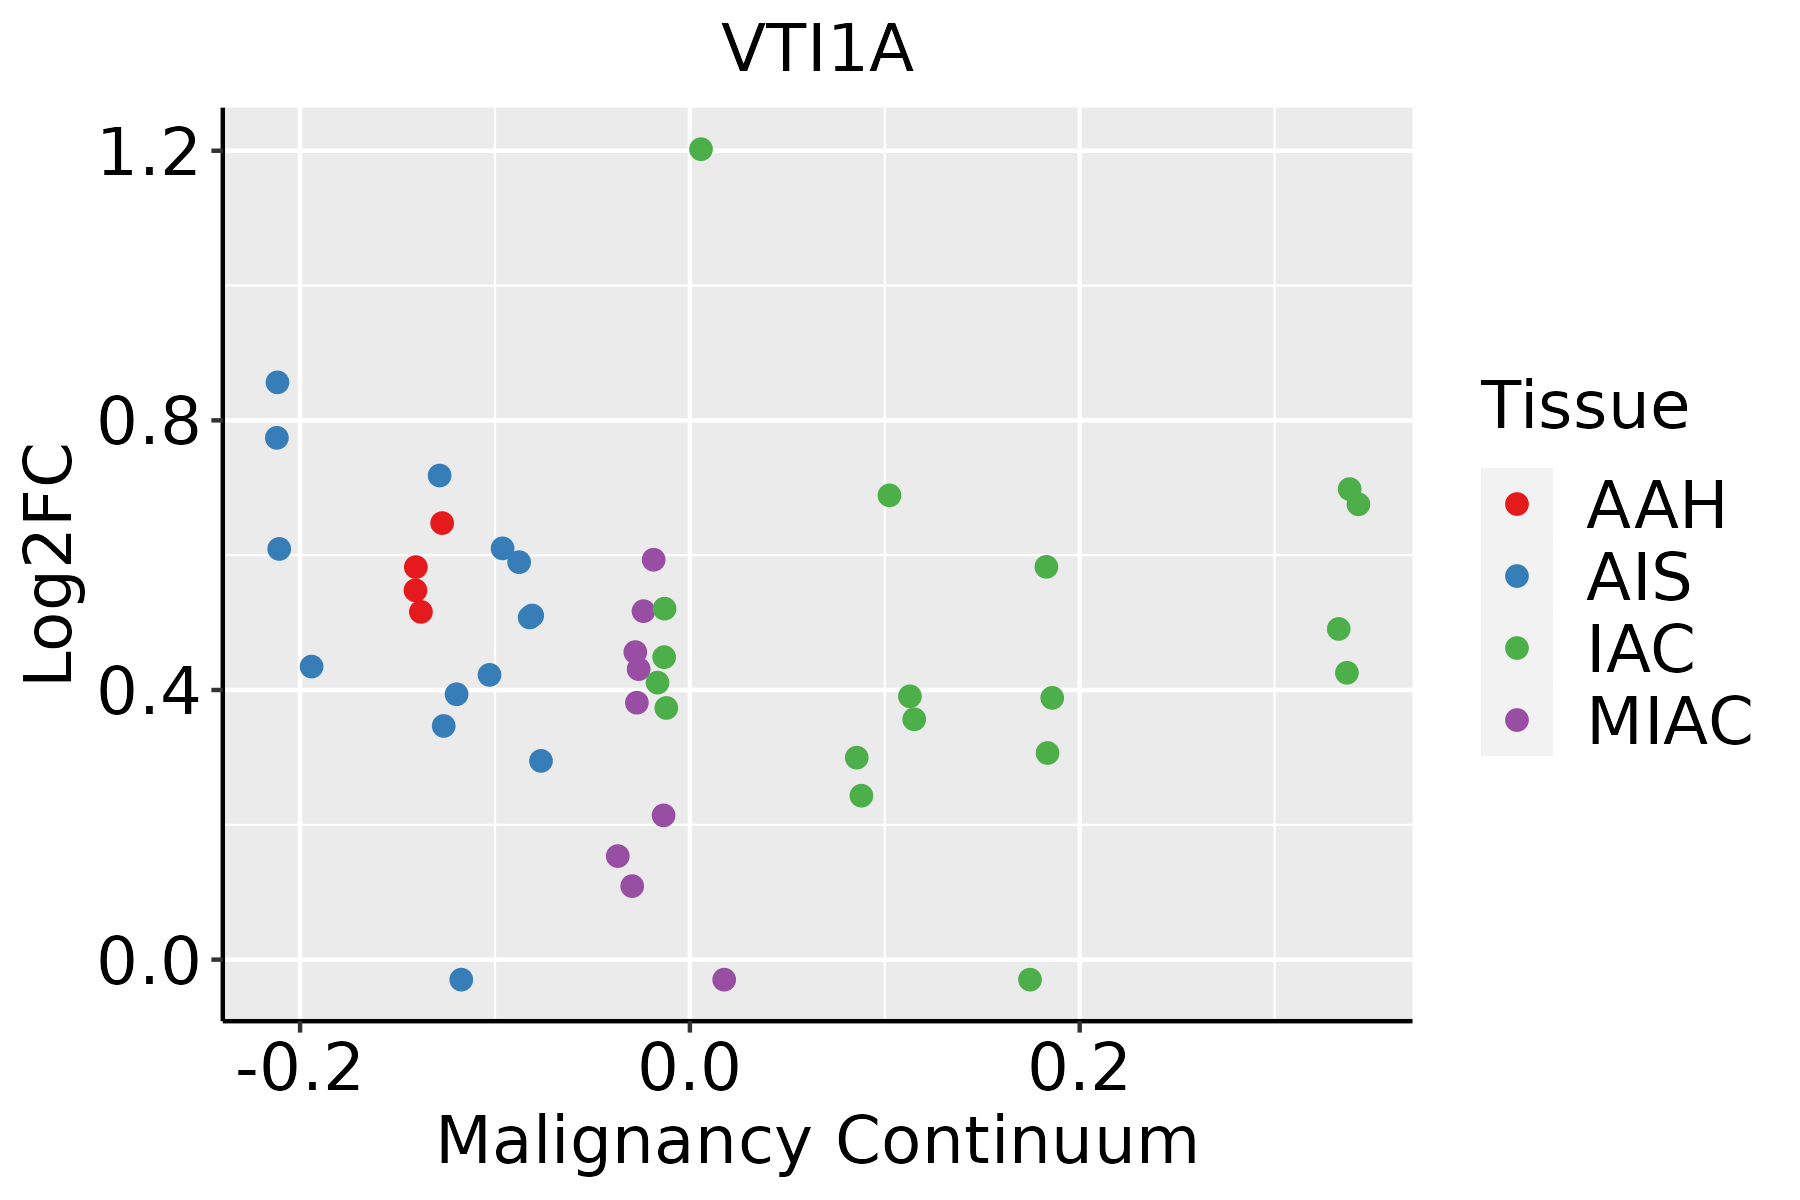 | AAH: Atypical adenomatous hyperplasia |
| AIS: Adenocarcinoma in situ | ||
| IAC: Invasive lung adenocarcinoma | ||
| MIA: Minimally invasive adenocarcinoma | ||
| Oral Cavity | 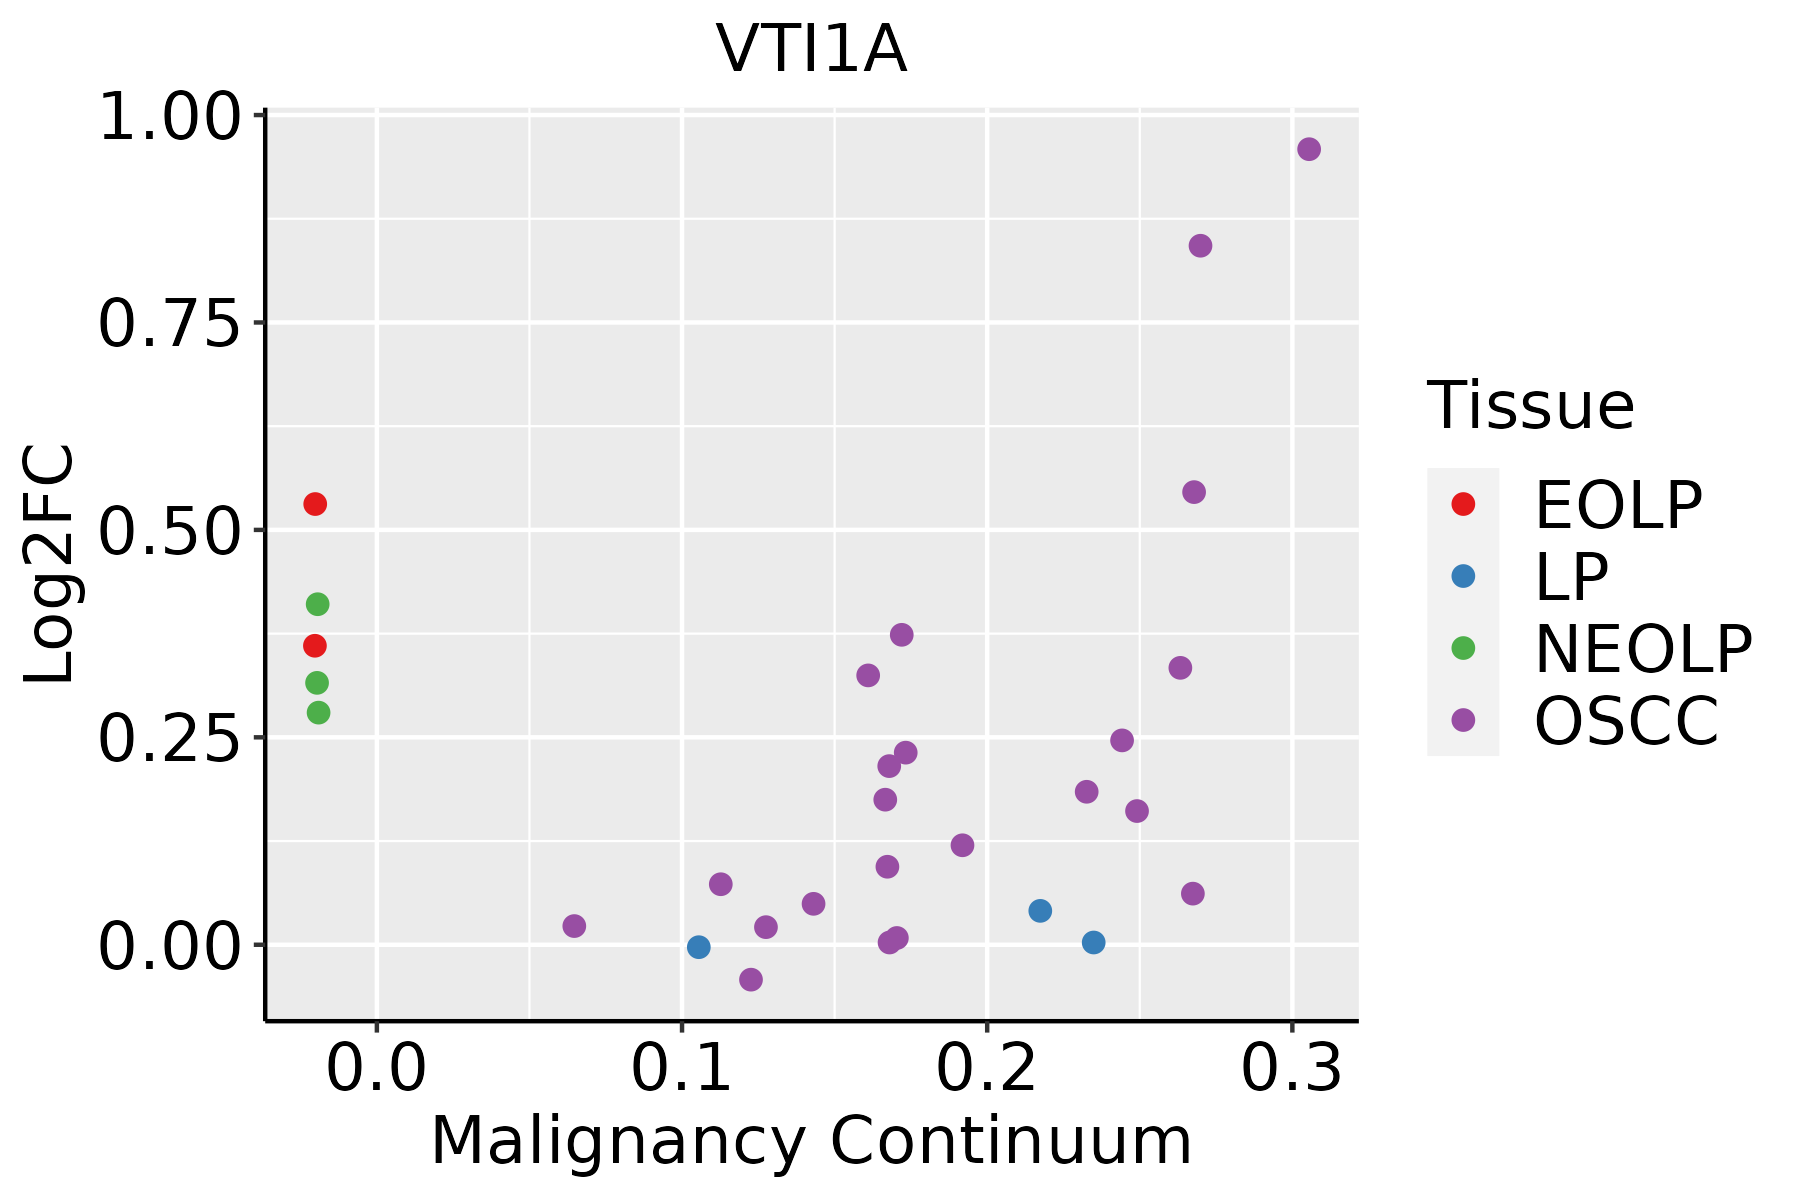 | EOLP: Erosive Oral lichen planus |
| LP: leukoplakia | ||
| NEOLP: Non-erosive oral lichen planus | ||
| OSCC: Oral squamous cell carcinoma |
| ∗log2FC in expression of this searched gene in stem-like cells from each diseased tissue sample relative to stem-like cells in normal samples in each tissue plotted against the malignancy continuum. Samples are colored based on if they are from different disease stage. |
Top |
Malignant transformation related pathway analysis |
| Find out the enriched GO biological processes and KEGG pathways involved in transition from healthy to precancer to cancer |
| Tissue | Disease Stage | Enriched GO biological Processes |
| Colorectum | AD |  |
| Colorectum | SER |  |
| Colorectum | MSS |  |
| Colorectum | MSI-H |  |
| Colorectum | FAP |  |
| ∗Top 15 enriched GO BP terms are showed in the bar plot of each disease state in each tissue. Each row represents a significant GO biological process which is colored according to the -log10(p.adjust). |
| Page: 1 2 3 4 5 6 7 8 9 |
| GO ID | Tissue | Disease Stage | Description | Gene Ratio | Bg Ratio | pvalue | p.adjust | Count |
| GO:00068927 | Cervix | CC | post-Golgi vesicle-mediated transport | 28/2311 | 104/18723 | 4.31e-05 | 6.61e-04 | 28 |
| GO:00162367 | Cervix | CC | macroautophagy | 58/2311 | 291/18723 | 1.40e-04 | 1.70e-03 | 58 |
| GO:00161977 | Cervix | CC | endosomal transport | 48/2311 | 230/18723 | 1.65e-04 | 1.97e-03 | 48 |
| GO:00481938 | Cervix | CC | Golgi vesicle transport | 58/2311 | 296/18723 | 2.24e-04 | 2.54e-03 | 58 |
| GO:00070347 | Cervix | CC | vacuolar transport | 34/2311 | 157/18723 | 7.03e-04 | 6.40e-03 | 34 |
| GO:00160506 | Cervix | CC | vesicle organization | 54/2311 | 300/18723 | 2.71e-03 | 1.85e-02 | 54 |
| GO:00070304 | Cervix | CC | Golgi organization | 32/2311 | 157/18723 | 2.78e-03 | 1.87e-02 | 32 |
| GO:00164827 | Cervix | CC | cytosolic transport | 33/2311 | 168/18723 | 4.43e-03 | 2.70e-02 | 33 |
| GO:0048193 | Colorectum | AD | Golgi vesicle transport | 109/3918 | 296/18723 | 1.80e-10 | 1.68e-08 | 109 |
| GO:0016197 | Colorectum | AD | endosomal transport | 90/3918 | 230/18723 | 1.88e-10 | 1.73e-08 | 90 |
| GO:0016482 | Colorectum | AD | cytosolic transport | 68/3918 | 168/18723 | 6.00e-09 | 3.72e-07 | 68 |
| GO:0016236 | Colorectum | AD | macroautophagy | 103/3918 | 291/18723 | 6.76e-09 | 4.15e-07 | 103 |
| GO:0016050 | Colorectum | AD | vesicle organization | 101/3918 | 300/18723 | 1.65e-07 | 7.17e-06 | 101 |
| GO:0006892 | Colorectum | AD | post-Golgi vesicle-mediated transport | 45/3918 | 104/18723 | 2.22e-07 | 9.26e-06 | 45 |
| GO:0007034 | Colorectum | AD | vacuolar transport | 60/3918 | 157/18723 | 4.97e-07 | 1.85e-05 | 60 |
| GO:0042147 | Colorectum | AD | retrograde transport, endosome to Golgi | 37/3918 | 91/18723 | 1.46e-05 | 3.14e-04 | 37 |
| GO:0006888 | Colorectum | AD | endoplasmic reticulum to Golgi vesicle-mediated transport | 44/3918 | 130/18723 | 4.13e-04 | 4.68e-03 | 44 |
| GO:0048284 | Colorectum | AD | organelle fusion | 42/3918 | 141/18723 | 8.04e-03 | 4.73e-02 | 42 |
| GO:00162361 | Colorectum | SER | macroautophagy | 79/2897 | 291/18723 | 1.97e-07 | 1.10e-05 | 79 |
| GO:00481931 | Colorectum | SER | Golgi vesicle transport | 79/2897 | 296/18723 | 4.20e-07 | 2.15e-05 | 79 |
| Page: 1 2 3 4 5 6 7 8 9 |
| Pathway ID | Tissue | Disease Stage | Description | Gene Ratio | Bg Ratio | pvalue | p.adjust | qvalue | Count |
| hsa041305 | Esophagus | ESCC | SNARE interactions in vesicular transport | 28/4205 | 33/8465 | 2.75e-05 | 1.32e-04 | 6.75e-05 | 28 |
| hsa0413012 | Esophagus | ESCC | SNARE interactions in vesicular transport | 28/4205 | 33/8465 | 2.75e-05 | 1.32e-04 | 6.75e-05 | 28 |
| hsa041302 | Liver | HCC | SNARE interactions in vesicular transport | 25/4020 | 33/8465 | 8.78e-04 | 3.38e-03 | 1.88e-03 | 25 |
| hsa041303 | Liver | HCC | SNARE interactions in vesicular transport | 25/4020 | 33/8465 | 8.78e-04 | 3.38e-03 | 1.88e-03 | 25 |
| hsa041304 | Oral cavity | OSCC | SNARE interactions in vesicular transport | 28/3704 | 33/8465 | 1.31e-06 | 7.18e-06 | 3.66e-06 | 28 |
| hsa0413011 | Oral cavity | OSCC | SNARE interactions in vesicular transport | 28/3704 | 33/8465 | 1.31e-06 | 7.18e-06 | 3.66e-06 | 28 |
| Page: 1 |
Top |
Cell-cell communication analysis |
| Identification of potential cell-cell interactions between two cell types and their ligand-receptor pairs for different disease states |
| Ligand | Receptor | LRpair | Pathway | Tissue | Disease Stage |
| Page: 1 |
Top |
Single-cell gene regulatory network inference analysis |
| Find out the significant the regulons (TFs) and the target genes of each regulon across cell types for different disease states |
| TF | Cell Type | Tissue | Disease Stage | Target Gene | RSS | Regulon Activity |
| ∗The dot plots of a searched regulon are shown for all cell subpopulations in each disease state of each tissue based on the regulon specific score inferred using pySCENIC and by calculating the average expression. |
| Page: 1 |
Top |
Somatic mutation of malignant transformation related genes |
| Annotation of somatic variants for genes involved in malignant transformation |
| Hugo Symbol | Variant Class | Variant Classification | dbSNP RS | HGVSc | HGVSp | HGVSp Short | SWISSPROT | BIOTYPE | SIFT | PolyPhen | Tumor Sample Barcode | Tissue | Histology | Sex | Age | Stage | Therapy Types | Drugs | Outcome |
| VTI1A | SNV | Missense_Mutation | c.548N>T | p.Gly183Val | p.G183V | Q96AJ9 | protein_coding | deleterious(0.01) | benign(0.288) | TCGA-A6-2672-01 | Colorectum | colon adenocarcinoma | Female | >=65 | III/IV | Unknown | Unknown | SD | |
| VTI1A | SNV | Missense_Mutation | rs746061602 | c.586G>A | p.Val196Ile | p.V196I | Q96AJ9 | protein_coding | tolerated(0.52) | benign(0.043) | TCGA-AY-6197-01 | Colorectum | colon adenocarcinoma | Male | <65 | I/II | Unknown | Unknown | SD |
| VTI1A | SNV | Missense_Mutation | novel | c.205A>G | p.Met69Val | p.M69V | Q96AJ9 | protein_coding | tolerated(0.06) | benign(0.049) | TCGA-AZ-4315-01 | Colorectum | colon adenocarcinoma | Male | <65 | I/II | Unknown | Unknown | SD |
| VTI1A | SNV | Missense_Mutation | rs148949614 | c.389N>A | p.Arg130Gln | p.R130Q | Q96AJ9 | protein_coding | tolerated(0.06) | possibly_damaging(0.64) | TCGA-D5-6530-01 | Colorectum | colon adenocarcinoma | Male | <65 | I/II | Unknown | Unknown | SD |
| VTI1A | SNV | Missense_Mutation | c.548G>T | p.Gly183Val | p.G183V | Q96AJ9 | protein_coding | deleterious(0.01) | benign(0.288) | TCGA-WS-AB45-01 | Colorectum | colon adenocarcinoma | Female | <65 | I/II | Unknown | Unknown | SD | |
| VTI1A | SNV | Missense_Mutation | rs770821310 | c.280N>A | p.Ala94Thr | p.A94T | Q96AJ9 | protein_coding | deleterious(0.05) | benign(0.061) | TCGA-A5-A0G2-01 | Endometrium | uterine corpus endometrioid carcinoma | Female | <65 | III/IV | Unknown | Unknown | SD |
| VTI1A | SNV | Missense_Mutation | rs770821310 | c.280N>A | p.Ala94Thr | p.A94T | Q96AJ9 | protein_coding | deleterious(0.05) | benign(0.061) | TCGA-AX-A0J1-01 | Endometrium | uterine corpus endometrioid carcinoma | Female | >=65 | I/II | Unknown | Unknown | SD |
| VTI1A | SNV | Missense_Mutation | novel | c.648N>C | p.Arg216Ser | p.R216S | Q96AJ9 | protein_coding | tolerated(0.05) | benign(0.001) | TCGA-AX-A1CE-01 | Endometrium | uterine corpus endometrioid carcinoma | Female | <65 | I/II | Unspecific | Paclitaxel | SD |
| VTI1A | SNV | Missense_Mutation | novel | c.350N>T | p.His117Leu | p.H117L | Q96AJ9 | protein_coding | deleterious(0.02) | benign(0.011) | TCGA-5R-AAAM-01 | Liver | liver hepatocellular carcinoma | Female | >=65 | I/II | Unknown | Unknown | SD |
| VTI1A | SNV | Missense_Mutation | c.479N>A | p.Ile160Lys | p.I160K | Q96AJ9 | protein_coding | deleterious(0) | probably_damaging(0.996) | TCGA-55-1592-01 | Lung | lung adenocarcinoma | Male | >=65 | I/II | Unknown | Unknown | PD |
| Page: 1 2 |
Top |
Related drugs of malignant transformation related genes |
| Identification of chemicals and drugs interact with genes involved in malignant transfromation |
| (DGIdb 4.0) |
| Entrez ID | Symbol | Category | Interaction Types | Drug Claim Name | Drug Name | PMIDs |
| Page: 1 |

Copyright 2023-Present -The University of Texas Health Science Center at Houston |