
|
|||||
|
 | |
| |
| |
| |
| |
| |
|
Gene: VSTM2L |
Gene summary for VSTM2L |
| Gene information | Species | Human | Gene symbol | VSTM2L | Gene ID | 128434 |
| Gene name | V-set and transmembrane domain containing 2 like | |
| Gene Alias | C20orf102 | |
| Cytomap | 20q11.23 | |
| Gene Type | protein-coding | GO ID | GO:0000902 | UniProtAcc | Q96N03 |
Top |
Malignant transformation analysis |
| Identification of the aberrant gene expression in precancerous and cancerous lesions by comparing the gene expression of stem-like cells in diseased tissues with normal stem cells |
| Entrez ID | Symbol | Replicates | Species | Organ | Tissue | Adj P-value | Log2FC | Malignancy |
| 128434 | VSTM2L | LZE5T | Human | Esophagus | ESCC | 4.76e-02 | 3.47e-01 | 0.0514 |
| 128434 | VSTM2L | LZE24T | Human | Esophagus | ESCC | 5.92e-10 | 4.05e-01 | 0.0596 |
| 128434 | VSTM2L | P8T-E | Human | Esophagus | ESCC | 7.81e-50 | 1.11e+00 | 0.0889 |
| 128434 | VSTM2L | P28T-E | Human | Esophagus | ESCC | 7.15e-04 | 3.51e-02 | 0.1149 |
| 128434 | VSTM2L | P54T-E | Human | Esophagus | ESCC | 1.12e-04 | 2.77e-01 | 0.0975 |
| 128434 | VSTM2L | P65T-E | Human | Esophagus | ESCC | 4.64e-08 | 2.75e-01 | 0.0978 |
| 128434 | VSTM2L | P75T-E | Human | Esophagus | ESCC | 8.50e-25 | 6.33e-01 | 0.1125 |
| 128434 | VSTM2L | P79T-E | Human | Esophagus | ESCC | 7.44e-03 | 1.18e-01 | 0.1154 |
| 128434 | VSTM2L | P82T-E | Human | Esophagus | ESCC | 7.14e-12 | 6.06e-01 | 0.1072 |
| 128434 | VSTM2L | P128T-E | Human | Esophagus | ESCC | 1.13e-06 | 8.91e-01 | 0.1241 |
| 128434 | VSTM2L | P130T-E | Human | Esophagus | ESCC | 2.24e-17 | 3.48e-01 | 0.1676 |
| Page: 1 |
| Tissue | Expression Dynamics | Abbreviation |
| Esophagus | 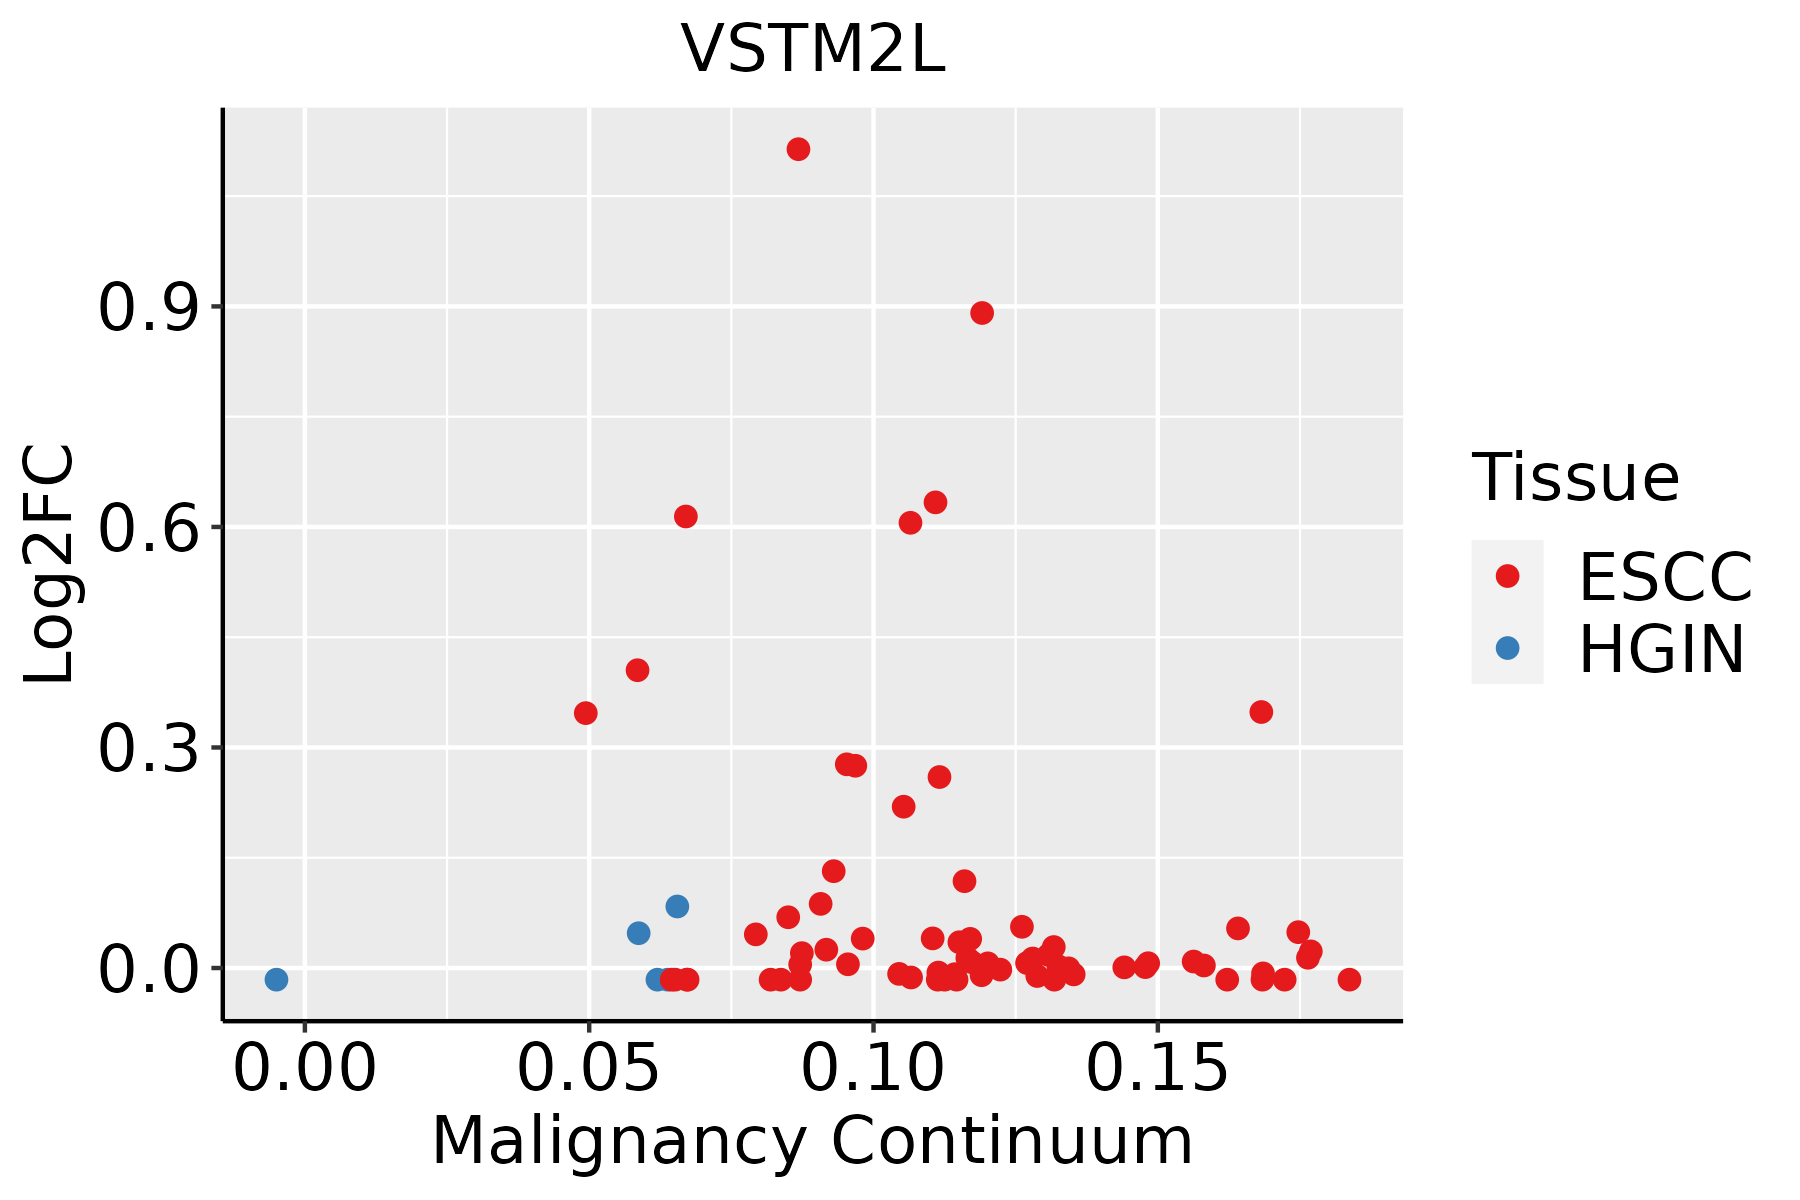 | ESCC: Esophageal squamous cell carcinoma |
| HGIN: High-grade intraepithelial neoplasias | ||
| LGIN: Low-grade intraepithelial neoplasias |
| ∗log2FC in expression of this searched gene in stem-like cells from each diseased tissue sample relative to stem-like cells in normal samples in each tissue plotted against the malignancy continuum. Samples are colored based on if they are from different disease stage. |
Top |
Malignant transformation related pathway analysis |
| Find out the enriched GO biological processes and KEGG pathways involved in transition from healthy to precancer to cancer |
| Tissue | Disease Stage | Enriched GO biological Processes |
| Colorectum | AD |  |
| Colorectum | SER |  |
| Colorectum | MSS |  |
| Colorectum | MSI-H |  |
| Colorectum | FAP |  |
| ∗Top 15 enriched GO BP terms are showed in the bar plot of each disease state in each tissue. Each row represents a significant GO biological process which is colored according to the -log10(p.adjust). |
| Page: 1 2 3 4 5 6 7 8 9 |
| GO ID | Tissue | Disease Stage | Description | Gene Ratio | Bg Ratio | pvalue | p.adjust | Count |
| GO:0070997111 | Esophagus | ESCC | neuron death | 216/8552 | 361/18723 | 3.49e-08 | 6.45e-07 | 216 |
| GO:0051402110 | Esophagus | ESCC | neuron apoptotic process | 148/8552 | 246/18723 | 3.08e-06 | 3.47e-05 | 148 |
| GO:1901214111 | Esophagus | ESCC | regulation of neuron death | 186/8552 | 319/18723 | 3.35e-06 | 3.73e-05 | 186 |
| GO:006156415 | Esophagus | ESCC | axon development | 251/8552 | 467/18723 | 2.41e-04 | 1.49e-03 | 251 |
| GO:004352317 | Esophagus | ESCC | regulation of neuron apoptotic process | 122/8552 | 212/18723 | 3.21e-04 | 1.90e-03 | 122 |
| GO:000740915 | Esophagus | ESCC | axonogenesis | 219/8552 | 418/18723 | 3.14e-03 | 1.31e-02 | 219 |
| GO:190121516 | Esophagus | ESCC | negative regulation of neuron death | 115/8552 | 208/18723 | 3.24e-03 | 1.34e-02 | 115 |
| Page: 1 |
| Pathway ID | Tissue | Disease Stage | Description | Gene Ratio | Bg Ratio | pvalue | p.adjust | qvalue | Count |
| Page: 1 |
Top |
Cell-cell communication analysis |
| Identification of potential cell-cell interactions between two cell types and their ligand-receptor pairs for different disease states |
| Ligand | Receptor | LRpair | Pathway | Tissue | Disease Stage |
| Page: 1 |
Top |
Single-cell gene regulatory network inference analysis |
| Find out the significant the regulons (TFs) and the target genes of each regulon across cell types for different disease states |
| TF | Cell Type | Tissue | Disease Stage | Target Gene | RSS | Regulon Activity |
| ∗The dot plots of a searched regulon are shown for all cell subpopulations in each disease state of each tissue based on the regulon specific score inferred using pySCENIC and by calculating the average expression. |
| Page: 1 |
Top |
Somatic mutation of malignant transformation related genes |
| Annotation of somatic variants for genes involved in malignant transformation |
| Hugo Symbol | Variant Class | Variant Classification | dbSNP RS | HGVSc | HGVSp | HGVSp Short | SWISSPROT | BIOTYPE | SIFT | PolyPhen | Tumor Sample Barcode | Tissue | Histology | Sex | Age | Stage | Therapy Types | Drugs | Outcome |
| VSTM2L | SNV | Missense_Mutation | rs771171569 | c.409G>A | p.Glu137Lys | p.E137K | Q96N03 | protein_coding | deleterious(0) | probably_damaging(0.992) | TCGA-C5-A7CL-01 | Cervix | cervical & endocervical cancer | Female | <65 | III/IV | Chemotherapy | cisplatin | PD |
| VSTM2L | SNV | Missense_Mutation | rs776332509 | c.194N>A | p.Arg65His | p.R65H | Q96N03 | protein_coding | deleterious(0.02) | probably_damaging(0.984) | TCGA-A6-5665-01 | Colorectum | colon adenocarcinoma | Female | >=65 | I/II | Unknown | Unknown | PD |
| VSTM2L | SNV | Missense_Mutation | rs769378638 | c.551N>T | p.Pro184Leu | p.P184L | Q96N03 | protein_coding | tolerated(0.31) | benign(0.107) | TCGA-WS-AB45-01 | Colorectum | colon adenocarcinoma | Female | <65 | I/II | Unknown | Unknown | SD |
| VSTM2L | insertion | Frame_Shift_Ins | novel | c.375_376insA | p.Leu127AlafsTer81 | p.L127Afs*81 | Q96N03 | protein_coding | TCGA-D5-6540-01 | Colorectum | colon adenocarcinoma | Male | >=65 | I/II | Unknown | Unknown | SD | ||
| VSTM2L | deletion | Frame_Shift_Del | c.278delN | p.Ala94ProfsTer5 | p.A94Pfs*5 | Q96N03 | protein_coding | TCGA-F4-6856-01 | Colorectum | colon adenocarcinoma | Male | <65 | I/II | Ancillary | leucovorin | CR | |||
| VSTM2L | SNV | Missense_Mutation | novel | c.332N>T | p.Thr111Ile | p.T111I | Q96N03 | protein_coding | deleterious(0) | probably_damaging(0.995) | TCGA-AJ-A3EK-01 | Endometrium | uterine corpus endometrioid carcinoma | Female | <65 | I/II | Chemotherapy | carboplatin | CR |
| VSTM2L | SNV | Missense_Mutation | novel | c.523N>A | p.Glu175Lys | p.E175K | Q96N03 | protein_coding | tolerated(0.32) | benign(0.036) | TCGA-AX-A05Z-01 | Endometrium | uterine corpus endometrioid carcinoma | Female | <65 | III/IV | Chemotherapy | adriamycin | SD |
| VSTM2L | SNV | Missense_Mutation | novel | c.494N>A | p.Pro165Gln | p.P165Q | Q96N03 | protein_coding | deleterious(0.03) | benign(0.413) | TCGA-DF-A2KN-01 | Endometrium | uterine corpus endometrioid carcinoma | Female | Unknown | I/II | Unknown | Unknown | SD |
| VSTM2L | SNV | Missense_Mutation | novel | c.215A>G | p.Tyr72Cys | p.Y72C | Q96N03 | protein_coding | deleterious(0.04) | probably_damaging(0.992) | TCGA-05-4382-01 | Lung | lung adenocarcinoma | Male | >=65 | I/II | Unknown | Unknown | PD |
| VSTM2L | SNV | Missense_Mutation | novel | c.383G>T | p.Arg128Leu | p.R128L | Q96N03 | protein_coding | deleterious(0) | probably_damaging(0.997) | TCGA-21-1083-01 | Lung | lung squamous cell carcinoma | Male | >=65 | I/II | Unknown | Unknown | SD |
| Page: 1 2 |
Top |
Related drugs of malignant transformation related genes |
| Identification of chemicals and drugs interact with genes involved in malignant transfromation |
| (DGIdb 4.0) |
| Entrez ID | Symbol | Category | Interaction Types | Drug Claim Name | Drug Name | PMIDs |
| Page: 1 |

Copyright 2023-Present -The University of Texas Health Science Center at Houston |