
|
|||||
|
 | |
| |
| |
| |
| |
| |
|
Gene: VSIR |
Gene summary for VSIR |
| Gene information | Species | Human | Gene symbol | VSIR | Gene ID | 64115 |
| Gene name | V-set immunoregulatory receptor | |
| Gene Alias | B7-H5 | |
| Cytomap | 10q22.1 | |
| Gene Type | protein-coding | GO ID | GO:0001775 | UniProtAcc | Q9H7M9 |
Top |
Malignant transformation analysis |
| Identification of the aberrant gene expression in precancerous and cancerous lesions by comparing the gene expression of stem-like cells in diseased tissues with normal stem cells |
| Entrez ID | Symbol | Replicates | Species | Organ | Tissue | Adj P-value | Log2FC | Malignancy |
| 64115 | VSIR | LZE4T | Human | Esophagus | ESCC | 4.53e-04 | 1.83e-01 | 0.0811 |
| 64115 | VSIR | LZE5T | Human | Esophagus | ESCC | 1.15e-08 | 4.41e-01 | 0.0514 |
| 64115 | VSIR | LZE8T | Human | Esophagus | ESCC | 1.08e-12 | 4.06e-01 | 0.067 |
| 64115 | VSIR | LZE20T | Human | Esophagus | ESCC | 2.95e-06 | 3.02e-01 | 0.0662 |
| 64115 | VSIR | LZE22T | Human | Esophagus | ESCC | 1.40e-06 | 5.38e-01 | 0.068 |
| 64115 | VSIR | LZE24T | Human | Esophagus | ESCC | 1.93e-22 | 1.51e+00 | 0.0596 |
| 64115 | VSIR | LZE21T | Human | Esophagus | ESCC | 9.73e-05 | 3.87e-01 | 0.0655 |
| 64115 | VSIR | LZE6T | Human | Esophagus | ESCC | 2.96e-03 | 1.88e-01 | 0.0845 |
| Page: 1 |
| Tissue | Expression Dynamics | Abbreviation |
| Esophagus | 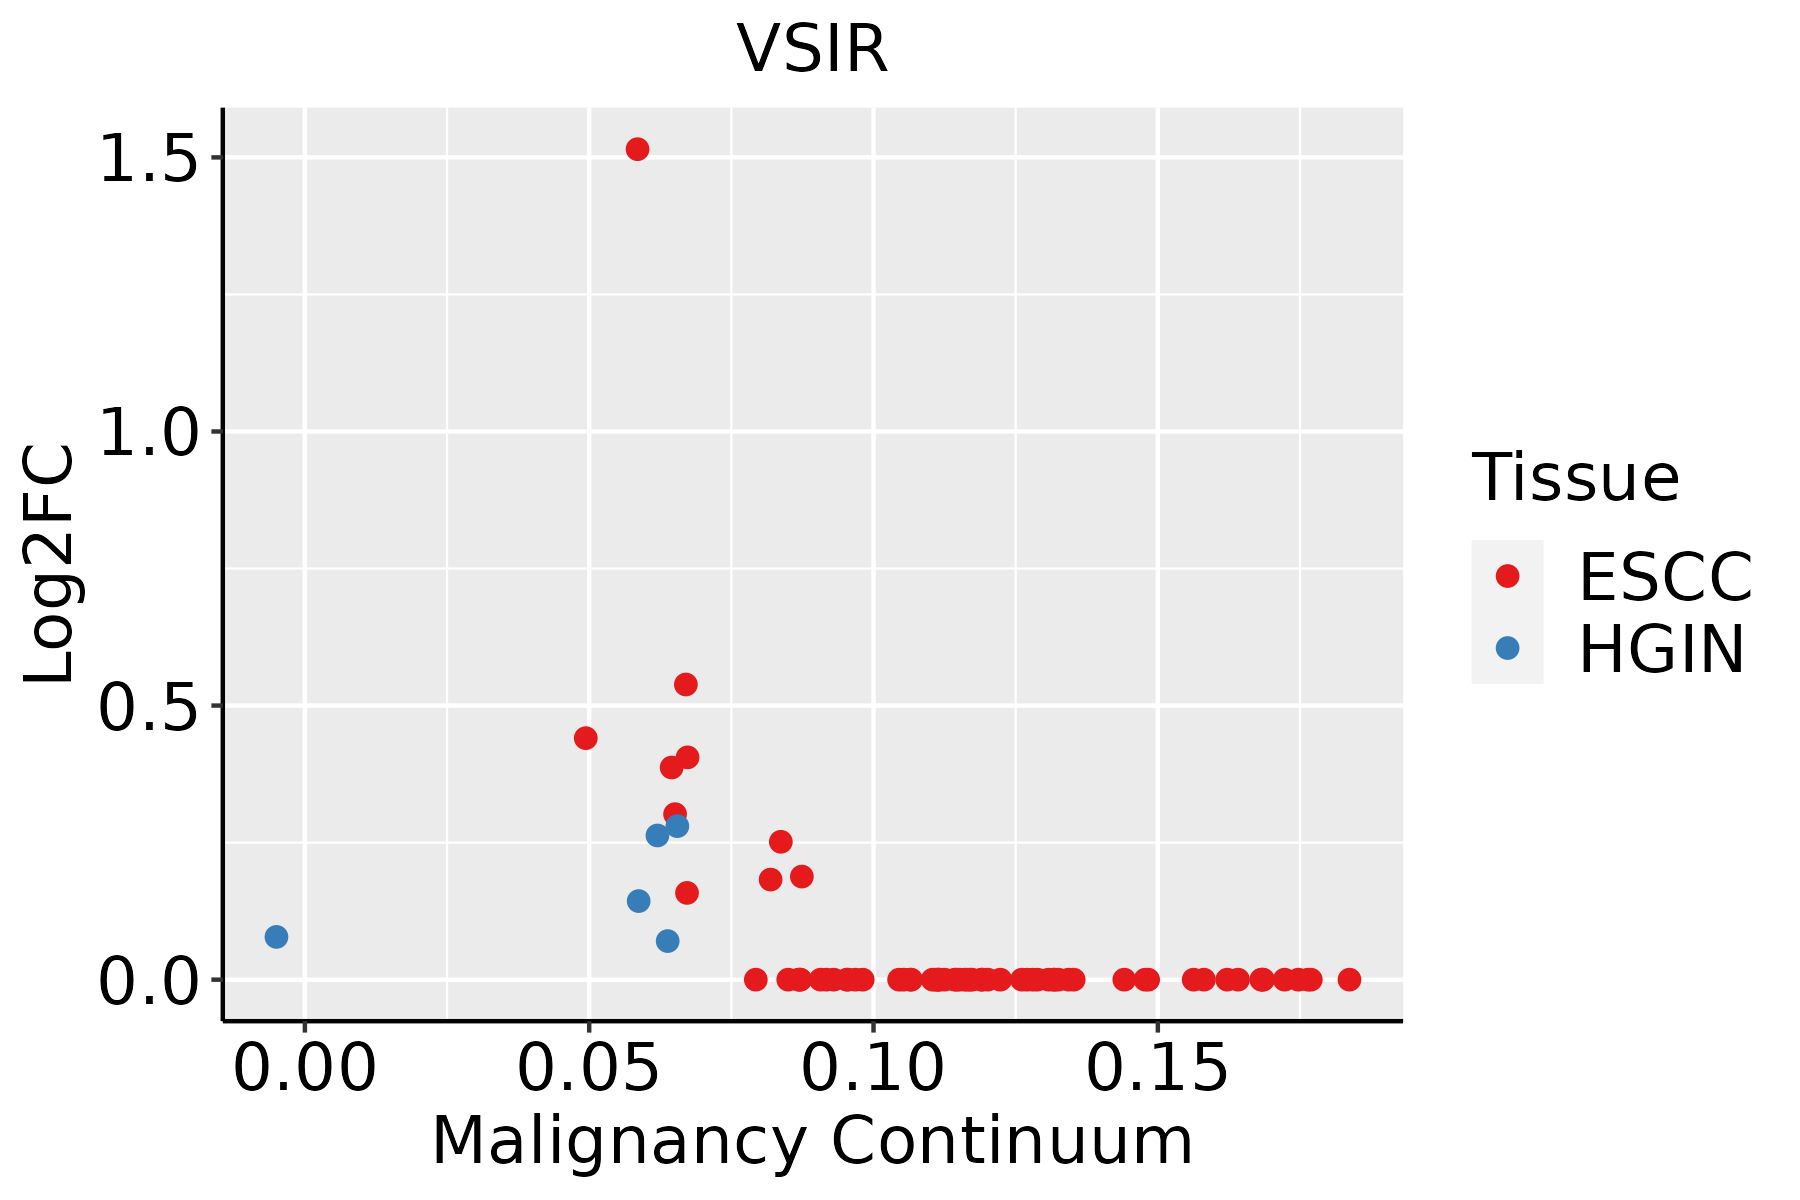 | ESCC: Esophageal squamous cell carcinoma |
| HGIN: High-grade intraepithelial neoplasias | ||
| LGIN: Low-grade intraepithelial neoplasias |
| ∗log2FC in expression of this searched gene in stem-like cells from each diseased tissue sample relative to stem-like cells in normal samples in each tissue plotted against the malignancy continuum. Samples are colored based on if they are from different disease stage. |
Top |
Malignant transformation related pathway analysis |
| Find out the enriched GO biological processes and KEGG pathways involved in transition from healthy to precancer to cancer |
| Tissue | Disease Stage | Enriched GO biological Processes |
| Colorectum | AD |  |
| Colorectum | SER |  |
| Colorectum | MSS |  |
| Colorectum | MSI-H |  |
| Colorectum | FAP |  |
| ∗Top 15 enriched GO BP terms are showed in the bar plot of each disease state in each tissue. Each row represents a significant GO biological process which is colored according to the -log10(p.adjust). |
| Page: 1 2 3 4 5 6 7 8 9 |
| GO ID | Tissue | Disease Stage | Description | Gene Ratio | Bg Ratio | pvalue | p.adjust | Count |
| GO:0009896111 | Esophagus | ESCC | positive regulation of catabolic process | 332/8552 | 492/18723 | 4.36e-23 | 9.22e-21 | 332 |
| GO:0045862111 | Esophagus | ESCC | positive regulation of proteolysis | 256/8552 | 372/18723 | 7.88e-20 | 9.43e-18 | 256 |
| GO:005160418 | Esophagus | ESCC | protein maturation | 189/8552 | 294/18723 | 7.64e-11 | 2.39e-09 | 189 |
| GO:0010952111 | Esophagus | ESCC | positive regulation of peptidase activity | 133/8552 | 197/18723 | 4.31e-10 | 1.14e-08 | 133 |
| GO:0052547111 | Esophagus | ESCC | regulation of peptidase activity | 275/8552 | 461/18723 | 7.54e-10 | 1.88e-08 | 275 |
| GO:0052548111 | Esophagus | ESCC | regulation of endopeptidase activity | 253/8552 | 432/18723 | 3.68e-08 | 6.78e-07 | 253 |
| GO:004578527 | Esophagus | ESCC | positive regulation of cell adhesion | 255/8552 | 437/18723 | 5.07e-08 | 9.11e-07 | 255 |
| GO:0010950111 | Esophagus | ESCC | positive regulation of endopeptidase activity | 116/8552 | 179/18723 | 1.77e-07 | 2.79e-06 | 116 |
| GO:001648514 | Esophagus | ESCC | protein processing | 134/8552 | 225/18723 | 1.81e-05 | 1.60e-04 | 134 |
| GO:1903706110 | Esophagus | ESCC | regulation of hemopoiesis | 201/8552 | 367/18723 | 2.60e-04 | 1.58e-03 | 201 |
| GO:19021076 | Esophagus | ESCC | positive regulation of leukocyte differentiation | 93/8552 | 157/18723 | 4.20e-04 | 2.39e-03 | 93 |
| GO:19037086 | Esophagus | ESCC | positive regulation of hemopoiesis | 93/8552 | 157/18723 | 4.20e-04 | 2.39e-03 | 93 |
| GO:002240720 | Esophagus | ESCC | regulation of cell-cell adhesion | 239/8552 | 448/18723 | 5.88e-04 | 3.19e-03 | 239 |
| GO:000268316 | Esophagus | ESCC | negative regulation of immune system process | 231/8552 | 434/18723 | 8.48e-04 | 4.36e-03 | 231 |
| GO:004211018 | Esophagus | ESCC | T cell activation | 256/8552 | 487/18723 | 1.18e-03 | 5.87e-03 | 256 |
| GO:19031317 | Esophagus | ESCC | mononuclear cell differentiation | 226/8552 | 426/18723 | 1.20e-03 | 5.88e-03 | 226 |
| GO:002240919 | Esophagus | ESCC | positive regulation of cell-cell adhesion | 155/8552 | 284/18723 | 1.50e-03 | 7.06e-03 | 155 |
| GO:190210510 | Esophagus | ESCC | regulation of leukocyte differentiation | 152/8552 | 279/18723 | 1.82e-03 | 8.35e-03 | 152 |
| GO:00329631 | Esophagus | ESCC | collagen metabolic process | 62/8552 | 104/18723 | 2.90e-03 | 1.22e-02 | 62 |
| GO:00456213 | Esophagus | ESCC | positive regulation of lymphocyte differentiation | 61/8552 | 104/18723 | 5.22e-03 | 1.97e-02 | 61 |
| Page: 1 2 |
| Pathway ID | Tissue | Disease Stage | Description | Gene Ratio | Bg Ratio | pvalue | p.adjust | qvalue | Count |
| Page: 1 |
Top |
Cell-cell communication analysis |
| Identification of potential cell-cell interactions between two cell types and their ligand-receptor pairs for different disease states |
| Ligand | Receptor | LRpair | Pathway | Tissue | Disease Stage |
| Page: 1 |
Top |
Single-cell gene regulatory network inference analysis |
| Find out the significant the regulons (TFs) and the target genes of each regulon across cell types for different disease states |
| TF | Cell Type | Tissue | Disease Stage | Target Gene | RSS | Regulon Activity |
| ∗The dot plots of a searched regulon are shown for all cell subpopulations in each disease state of each tissue based on the regulon specific score inferred using pySCENIC and by calculating the average expression. |
| Page: 1 |
Top |
Somatic mutation of malignant transformation related genes |
| Annotation of somatic variants for genes involved in malignant transformation |
| Hugo Symbol | Variant Class | Variant Classification | dbSNP RS | HGVSc | HGVSp | HGVSp Short | SWISSPROT | BIOTYPE | SIFT | PolyPhen | Tumor Sample Barcode | Tissue | Histology | Sex | Age | Stage | Therapy Types | Drugs | Outcome |
| VSIR | SNV | Missense_Mutation | novel | c.448N>C | p.Glu150Gln | p.E150Q | Q9H7M9 | protein_coding | deleterious(0) | probably_damaging(0.939) | TCGA-D8-A27G-01 | Breast | breast invasive carcinoma | Female | >=65 | I/II | Unknown | Unknown | SD |
| VSIR | deletion | Frame_Shift_Del | novel | c.807delG | p.Gln270SerfsTer67 | p.Q270Sfs*67 | Q9H7M9 | protein_coding | TCGA-EW-A2FV-01 | Breast | breast invasive carcinoma | Female | <65 | III/IV | Chemotherapy | docetaxel | SD | ||
| VSIR | SNV | Missense_Mutation | rs200390302 | c.347N>A | p.Arg116His | p.R116H | Q9H7M9 | protein_coding | tolerated(0.81) | benign(0.005) | TCGA-5M-AAT6-01 | Colorectum | colon adenocarcinoma | Female | <65 | III/IV | Unknown | Unknown | PD |
| VSIR | SNV | Missense_Mutation | c.106N>A | p.Ala36Thr | p.A36T | Q9H7M9 | protein_coding | tolerated(0.81) | benign(0.009) | TCGA-AZ-4313-01 | Colorectum | colon adenocarcinoma | Female | <65 | I/II | Unknown | Unknown | SD | |
| VSIR | SNV | Missense_Mutation | rs752922320 | c.674G>A | p.Arg225His | p.R225H | Q9H7M9 | protein_coding | deleterious(0.01) | benign(0.033) | TCGA-AZ-4315-01 | Colorectum | colon adenocarcinoma | Male | <65 | I/II | Unknown | Unknown | SD |
| VSIR | SNV | Missense_Mutation | rs149997496 | c.136N>A | p.Glu46Lys | p.E46K | Q9H7M9 | protein_coding | deleterious(0) | possibly_damaging(0.695) | TCGA-G4-6304-01 | Colorectum | colon adenocarcinoma | Female | >=65 | I/II | Chemotherapy | fluorouracil | PD |
| VSIR | SNV | Missense_Mutation | c.221N>A | p.Arg74His | p.R74H | Q9H7M9 | protein_coding | tolerated(0.17) | possibly_damaging(0.778) | TCGA-AP-A0LM-01 | Endometrium | uterine corpus endometrioid carcinoma | Female | <65 | III/IV | Chemotherapy | cisplatin | SD | |
| VSIR | SNV | Missense_Mutation | rs747668966 | c.148G>A | p.Val50Ile | p.V50I | Q9H7M9 | protein_coding | tolerated(0.07) | benign(0.03) | TCGA-AP-A1DV-01 | Endometrium | uterine corpus endometrioid carcinoma | Female | <65 | I/II | Unknown | Unknown | SD |
| VSIR | SNV | Missense_Mutation | novel | c.725N>C | p.Asn242Thr | p.N242T | Q9H7M9 | protein_coding | deleterious(0) | probably_damaging(0.996) | TCGA-AX-A06L-01 | Endometrium | uterine corpus endometrioid carcinoma | Female | <65 | I/II | Unknown | Unknown | SD |
| VSIR | SNV | Missense_Mutation | novel | c.517N>T | p.Asp173Tyr | p.D173Y | Q9H7M9 | protein_coding | deleterious(0.03) | benign(0.202) | TCGA-B5-A1MR-01 | Endometrium | uterine corpus endometrioid carcinoma | Female | >=65 | III/IV | Unknown | Unknown | SD |
| Page: 1 2 3 |
Top |
Related drugs of malignant transformation related genes |
| Identification of chemicals and drugs interact with genes involved in malignant transfromation |
| (DGIdb 4.0) |
| Entrez ID | Symbol | Category | Interaction Types | Drug Claim Name | Drug Name | PMIDs |
| 64115 | VSIR | DRUGGABLE GENOME, CLINICALLY ACTIONABLE | JNJ-61610588 | ONVATILIMAB | ||
| 64115 | VSIR | DRUGGABLE GENOME, CLINICALLY ACTIONABLE | CA-170 |
| Page: 1 |

Copyright 2023-Present -The University of Texas Health Science Center at Houston |