
|
|||||
|
 | |
| |
| |
| |
| |
| |
|
Gene: VSIG2 |
Gene summary for VSIG2 |
| Gene information | Species | Human | Gene symbol | VSIG2 | Gene ID | 23584 |
| Gene name | V-set and immunoglobulin domain containing 2 | |
| Gene Alias | 2210413P10Rik | |
| Cytomap | 11q24.2 | |
| Gene Type | protein-coding | GO ID | GO:0005575 | UniProtAcc | Q96IQ7 |
Top |
Malignant transformation analysis |
| Identification of the aberrant gene expression in precancerous and cancerous lesions by comparing the gene expression of stem-like cells in diseased tissues with normal stem cells |
| Entrez ID | Symbol | Replicates | Species | Organ | Tissue | Adj P-value | Log2FC | Malignancy |
| 23584 | VSIG2 | HTA11_3410_2000001011 | Human | Colorectum | AD | 7.02e-04 | 1.87e-01 | 0.0155 |
| 23584 | VSIG2 | HTA11_2487_2000001011 | Human | Colorectum | SER | 2.98e-28 | 1.14e+00 | -0.1808 |
| 23584 | VSIG2 | HTA11_1938_2000001011 | Human | Colorectum | AD | 2.72e-27 | 9.68e-01 | -0.0811 |
| 23584 | VSIG2 | HTA11_78_2000001011 | Human | Colorectum | AD | 7.64e-14 | 6.17e-01 | -0.1088 |
| 23584 | VSIG2 | HTA11_347_2000001011 | Human | Colorectum | AD | 1.17e-52 | 1.18e+00 | -0.1954 |
| 23584 | VSIG2 | HTA11_411_2000001011 | Human | Colorectum | SER | 1.89e-15 | 1.81e+00 | -0.2602 |
| 23584 | VSIG2 | HTA11_2112_2000001011 | Human | Colorectum | SER | 1.03e-09 | 1.28e+00 | -0.2196 |
| 23584 | VSIG2 | HTA11_3361_2000001011 | Human | Colorectum | AD | 8.48e-19 | 8.22e-01 | -0.1207 |
| 23584 | VSIG2 | HTA11_83_2000001011 | Human | Colorectum | SER | 3.01e-25 | 1.11e+00 | -0.1526 |
| 23584 | VSIG2 | HTA11_696_2000001011 | Human | Colorectum | AD | 1.08e-44 | 1.11e+00 | -0.1464 |
| 23584 | VSIG2 | HTA11_866_2000001011 | Human | Colorectum | AD | 8.38e-26 | 7.27e-01 | -0.1001 |
| 23584 | VSIG2 | HTA11_1391_2000001011 | Human | Colorectum | AD | 9.19e-17 | 6.25e-01 | -0.059 |
| 23584 | VSIG2 | HTA11_2992_2000001011 | Human | Colorectum | SER | 5.66e-15 | 1.38e+00 | -0.1706 |
| 23584 | VSIG2 | HTA11_5212_2000001011 | Human | Colorectum | AD | 4.44e-24 | 1.77e+00 | -0.2061 |
| 23584 | VSIG2 | HTA11_5216_2000001011 | Human | Colorectum | SER | 5.70e-13 | 1.14e+00 | -0.1462 |
| 23584 | VSIG2 | HTA11_546_2000001011 | Human | Colorectum | AD | 1.93e-04 | 4.55e-01 | -0.0842 |
| 23584 | VSIG2 | HTA11_7862_2000001011 | Human | Colorectum | AD | 2.36e-03 | 3.39e-01 | -0.0179 |
| 23584 | VSIG2 | HTA11_8622_2000001021 | Human | Colorectum | SER | 3.86e-03 | 2.62e-01 | 0.0528 |
| 23584 | VSIG2 | HTA11_10623_2000001011 | Human | Colorectum | AD | 2.99e-06 | 5.74e-01 | -0.0177 |
| 23584 | VSIG2 | HTA11_6801_2000001011 | Human | Colorectum | SER | 9.88e-06 | 6.22e-01 | 0.0171 |
| Page: 1 2 3 4 5 |
| Tissue | Expression Dynamics | Abbreviation |
| Colorectum (GSE201348) |  | FAP: Familial adenomatous polyposis |
| CRC: Colorectal cancer | ||
| Colorectum (HTA11) |  | AD: Adenomas |
| SER: Sessile serrated lesions | ||
| MSI-H: Microsatellite-high colorectal cancer | ||
| MSS: Microsatellite stable colorectal cancer | ||
| Esophagus |  | ESCC: Esophageal squamous cell carcinoma |
| HGIN: High-grade intraepithelial neoplasias | ||
| LGIN: Low-grade intraepithelial neoplasias | ||
| GC |  | CAG: Chronic atrophic gastritis |
| CAG with IM: Chronic atrophic gastritis with intestinal metaplasia | ||
| CSG: Chronic superficial gastritis | ||
| GC: Gastric cancer | ||
| SIM: Severe intestinal metaplasia | ||
| WIM: Wild intestinal metaplasia | ||
| Liver | 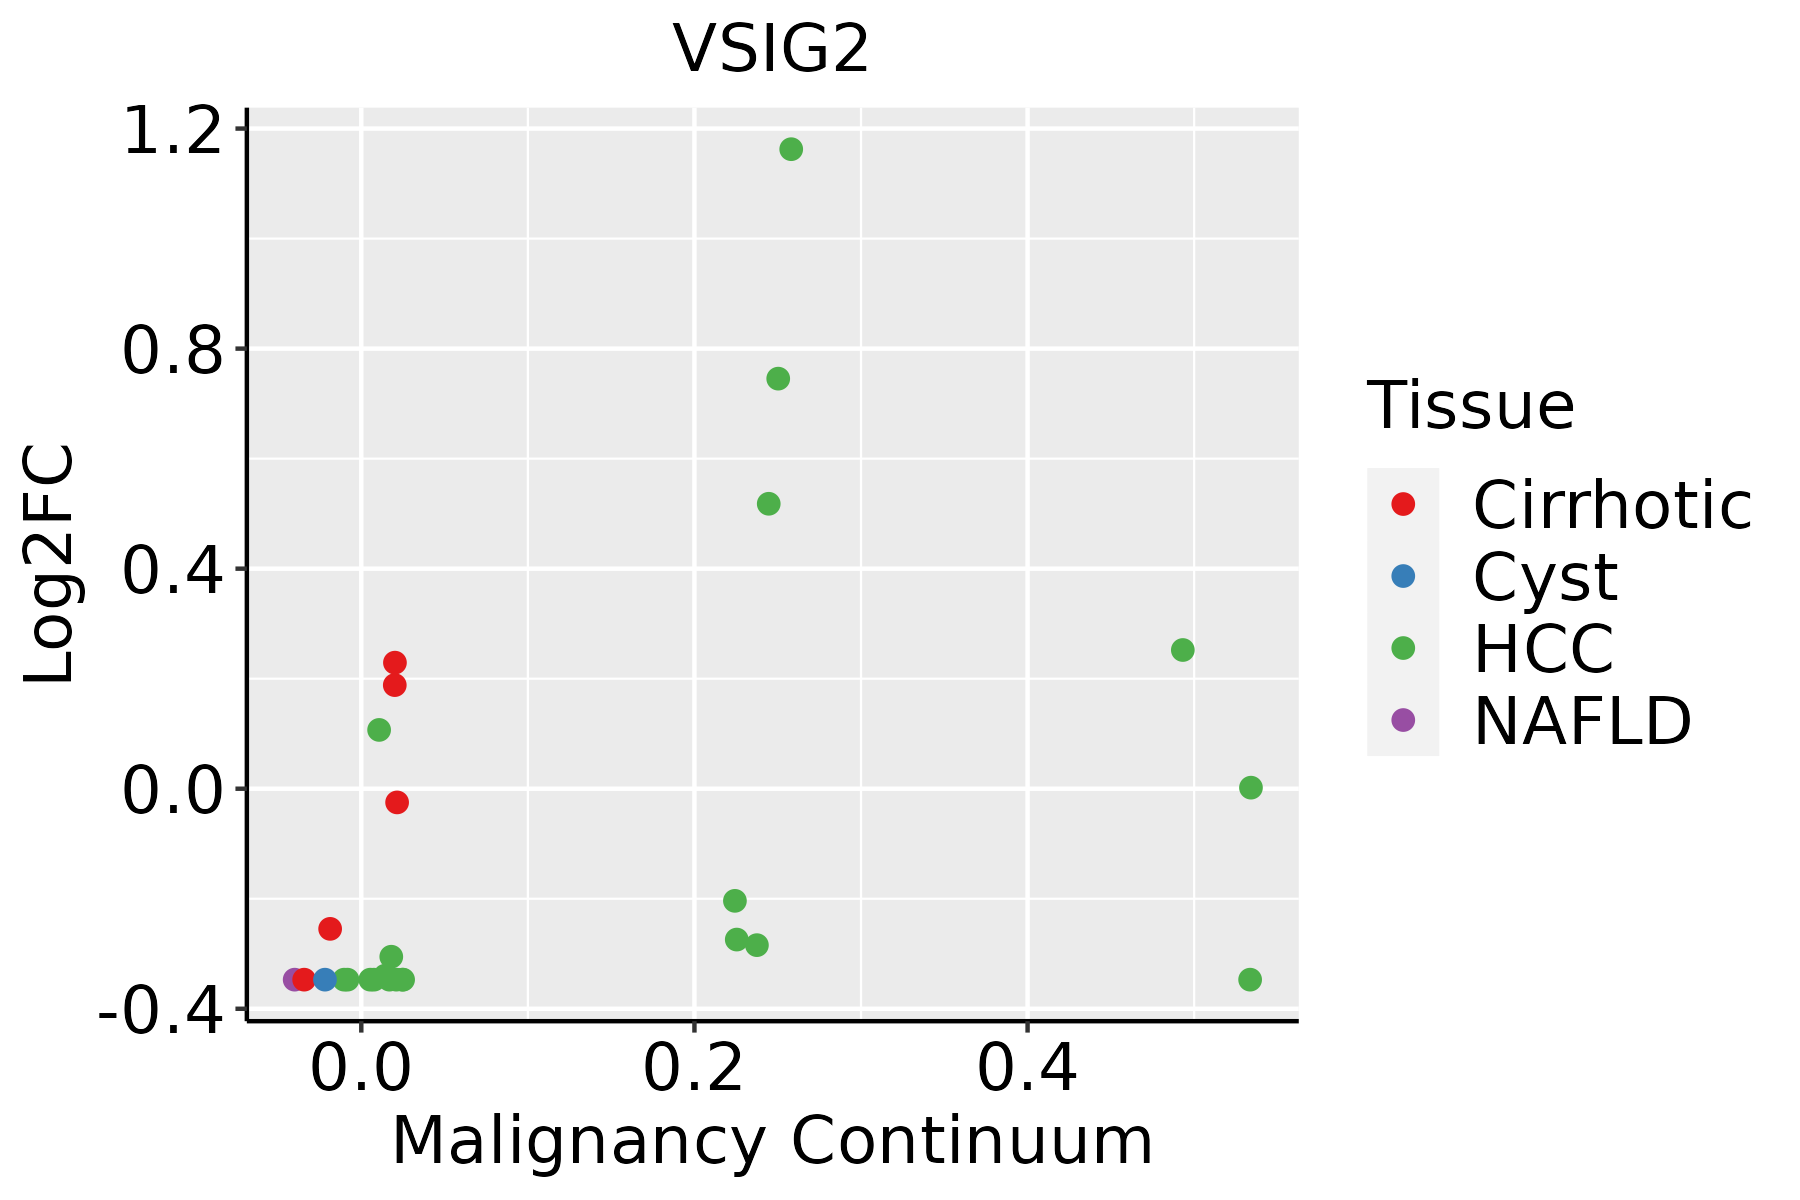 | HCC: Hepatocellular carcinoma |
| NAFLD: Non-alcoholic fatty liver disease | ||
| Oral Cavity | 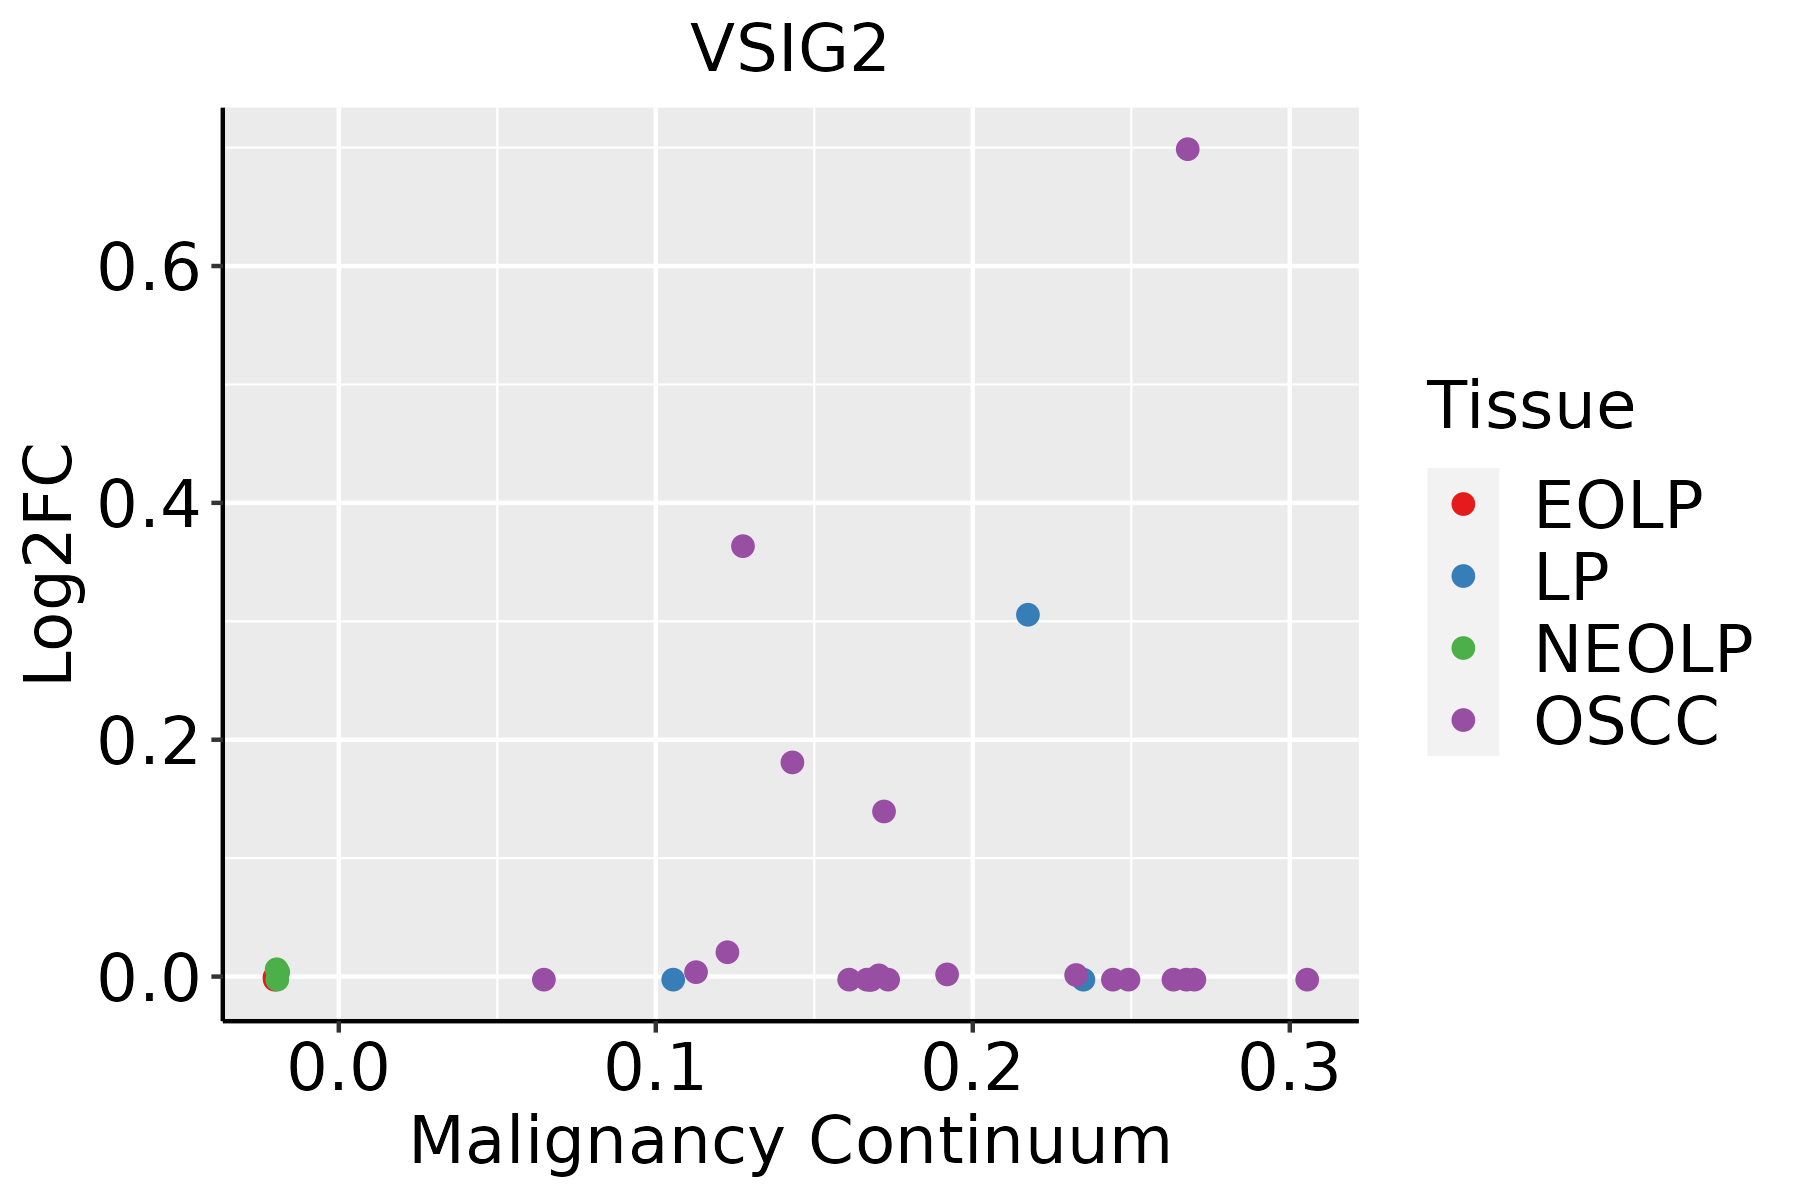 | EOLP: Erosive Oral lichen planus |
| LP: leukoplakia | ||
| NEOLP: Non-erosive oral lichen planus | ||
| OSCC: Oral squamous cell carcinoma | ||
| Thyroid | 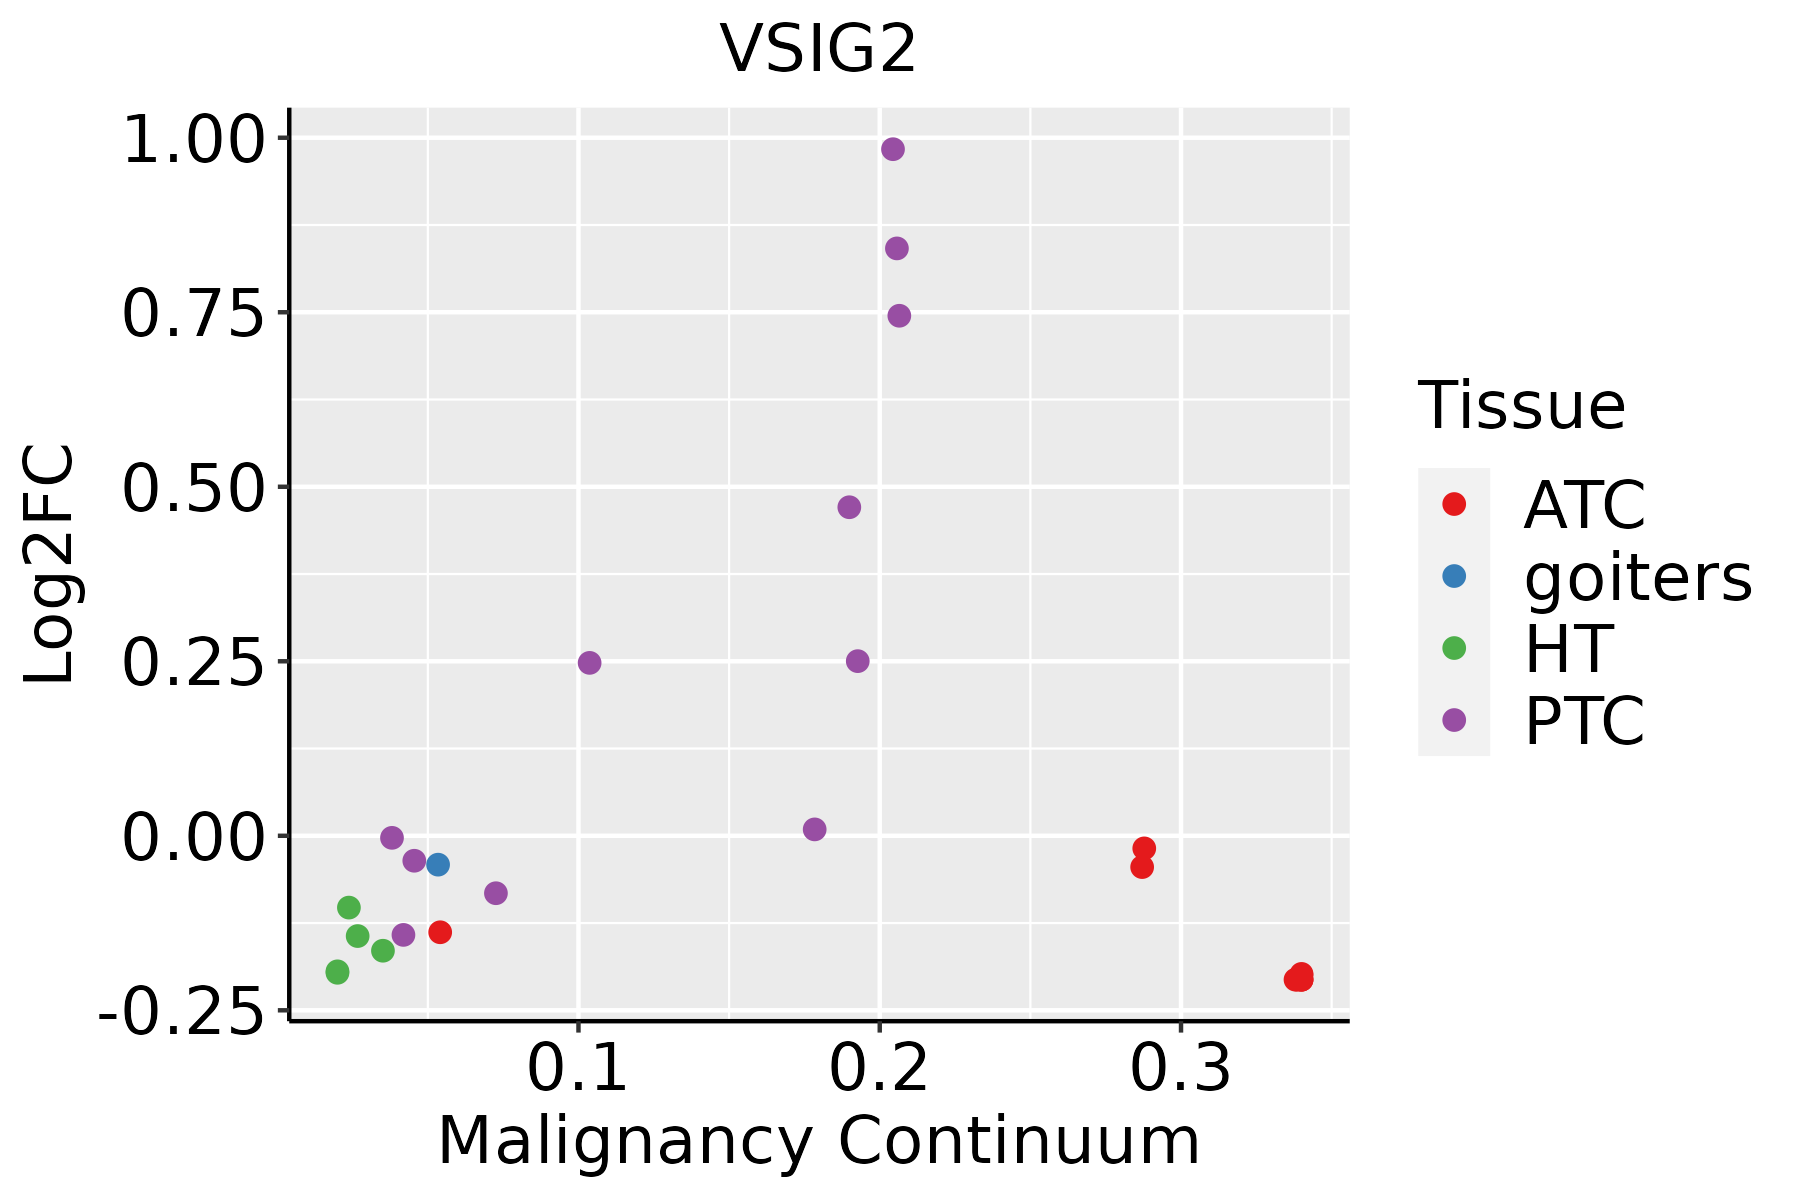 | ATC: Anaplastic thyroid cancer |
| HT: Hashimoto's thyroiditis | ||
| PTC: Papillary thyroid cancer |
| ∗log2FC in expression of this searched gene in stem-like cells from each diseased tissue sample relative to stem-like cells in normal samples in each tissue plotted against the malignancy continuum. Samples are colored based on if they are from different disease stage. |
Top |
Malignant transformation related pathway analysis |
| Find out the enriched GO biological processes and KEGG pathways involved in transition from healthy to precancer to cancer |
| Tissue | Disease Stage | Enriched GO biological Processes |
| Colorectum | AD |  |
| Colorectum | SER |  |
| Colorectum | MSS |  |
| Colorectum | MSI-H |  |
| Colorectum | FAP |  |
| ∗Top 15 enriched GO BP terms are showed in the bar plot of each disease state in each tissue. Each row represents a significant GO biological process which is colored according to the -log10(p.adjust). |
| Page: 1 2 3 4 5 6 7 8 9 |
| GO ID | Tissue | Disease Stage | Description | Gene Ratio | Bg Ratio | pvalue | p.adjust | Count |
| Page: 1 |
| Pathway ID | Tissue | Disease Stage | Description | Gene Ratio | Bg Ratio | pvalue | p.adjust | qvalue | Count |
| Page: 1 |
Top |
Cell-cell communication analysis |
| Identification of potential cell-cell interactions between two cell types and their ligand-receptor pairs for different disease states |
| Ligand | Receptor | LRpair | Pathway | Tissue | Disease Stage |
| Page: 1 |
Top |
Single-cell gene regulatory network inference analysis |
| Find out the significant the regulons (TFs) and the target genes of each regulon across cell types for different disease states |
| TF | Cell Type | Tissue | Disease Stage | Target Gene | RSS | Regulon Activity |
| ∗The dot plots of a searched regulon are shown for all cell subpopulations in each disease state of each tissue based on the regulon specific score inferred using pySCENIC and by calculating the average expression. |
| Page: 1 |
Top |
Somatic mutation of malignant transformation related genes |
| Annotation of somatic variants for genes involved in malignant transformation |
| Hugo Symbol | Variant Class | Variant Classification | dbSNP RS | HGVSc | HGVSp | HGVSp Short | SWISSPROT | BIOTYPE | SIFT | PolyPhen | Tumor Sample Barcode | Tissue | Histology | Sex | Age | Stage | Therapy Types | Drugs | Outcome |
| VSIG2 | SNV | Missense_Mutation | novel | c.430C>A | p.Pro144Thr | p.P144T | Q96IQ7 | protein_coding | deleterious(0) | probably_damaging(0.999) | TCGA-BH-A0H0-01 | Breast | breast invasive carcinoma | Female | >=65 | I/II | Hormone Therapy | arimidex | SD |
| VSIG2 | insertion | In_Frame_Ins | novel | c.428_429insGAGAAA | p.Val143_Pro144insArgAsn | p.V143_P144insRN | Q96IQ7 | protein_coding | TCGA-BH-A0H0-01 | Breast | breast invasive carcinoma | Female | >=65 | I/II | Hormone Therapy | arimidex | SD | ||
| VSIG2 | deletion | Frame_Shift_Del | novel | c.671delG | p.Gly224AlafsTer7 | p.G224Afs*7 | Q96IQ7 | protein_coding | TCGA-EW-A2FV-01 | Breast | breast invasive carcinoma | Female | <65 | III/IV | Chemotherapy | docetaxel | SD | ||
| VSIG2 | SNV | Missense_Mutation | c.165N>G | p.Phe55Leu | p.F55L | Q96IQ7 | protein_coding | tolerated(0.5) | probably_damaging(0.989) | TCGA-DR-A0ZM-01 | Cervix | cervical & endocervical cancer | Female | <65 | III/IV | Unspecific | Cisplatin | SD | |
| VSIG2 | SNV | Missense_Mutation | rs183266468 | c.779N>T | p.Ala260Val | p.A260V | Q96IQ7 | protein_coding | tolerated(1) | benign(0) | TCGA-AA-A010-01 | Colorectum | colon adenocarcinoma | Female | <65 | I/II | Chemotherapy | folinic | CR |
| VSIG2 | SNV | Missense_Mutation | c.134N>A | p.Cys45Tyr | p.C45Y | Q96IQ7 | protein_coding | deleterious(0.01) | probably_damaging(0.998) | TCGA-AP-A051-01 | Endometrium | uterine corpus endometrioid carcinoma | Female | >=65 | I/II | Unknown | Unknown | SD | |
| VSIG2 | SNV | Missense_Mutation | novel | c.652G>A | p.Val218Met | p.V218M | Q96IQ7 | protein_coding | tolerated(0.13) | possibly_damaging(0.675) | TCGA-AP-A0LM-01 | Endometrium | uterine corpus endometrioid carcinoma | Female | <65 | III/IV | Chemotherapy | cisplatin | SD |
| VSIG2 | SNV | Missense_Mutation | novel | c.260N>A | p.Ser87Tyr | p.S87Y | Q96IQ7 | protein_coding | deleterious(0) | possibly_damaging(0.548) | TCGA-AP-A1E0-01 | Endometrium | uterine corpus endometrioid carcinoma | Female | <65 | III/IV | Chemotherapy | paclitaxel | SD |
| VSIG2 | SNV | Missense_Mutation | novel | c.382N>T | p.Asp128Tyr | p.D128Y | Q96IQ7 | protein_coding | deleterious(0) | probably_damaging(1) | TCGA-AX-A2HC-01 | Endometrium | uterine corpus endometrioid carcinoma | Female | <65 | III/IV | Chemotherapy | paclitaxel | PD |
| VSIG2 | SNV | Missense_Mutation | novel | c.932C>T | p.Ser311Leu | p.S311L | Q96IQ7 | protein_coding | tolerated_low_confidence(0.07) | benign(0) | TCGA-AX-A2IO-01 | Endometrium | uterine corpus endometrioid carcinoma | Female | >=65 | I/II | Chemotherapy | carboplatin | SD |
| Page: 1 2 3 4 |
Top |
Related drugs of malignant transformation related genes |
| Identification of chemicals and drugs interact with genes involved in malignant transfromation |
| (DGIdb 4.0) |
| Entrez ID | Symbol | Category | Interaction Types | Drug Claim Name | Drug Name | PMIDs |
| Page: 1 |

Copyright 2023-Present -The University of Texas Health Science Center at Houston |