
|
|||||
|
 | |
| |
| |
| |
| |
| |
|
Gene: VSIG10 |
Gene summary for VSIG10 |
| Gene information | Species | Human | Gene symbol | VSIG10 | Gene ID | 54621 |
| Gene name | V-set and immunoglobulin domain containing 10 | |
| Gene Alias | VSIG10 | |
| Cytomap | 12q24.23 | |
| Gene Type | protein-coding | GO ID | GO:0007155 | UniProtAcc | Q8N0Z9 |
Top |
Malignant transformation analysis |
| Identification of the aberrant gene expression in precancerous and cancerous lesions by comparing the gene expression of stem-like cells in diseased tissues with normal stem cells |
| Entrez ID | Symbol | Replicates | Species | Organ | Tissue | Adj P-value | Log2FC | Malignancy |
| 54621 | VSIG10 | HTA11_347_2000001011 | Human | Colorectum | AD | 5.47e-08 | 4.98e-01 | -0.1954 |
| 54621 | VSIG10 | HTA11_1391_2000001011 | Human | Colorectum | AD | 8.49e-03 | 4.90e-01 | -0.059 |
| 54621 | VSIG10 | HTA11_99999965062_69753 | Human | Colorectum | MSI-H | 4.93e-02 | 8.84e-01 | 0.3487 |
| 54621 | VSIG10 | A015-C-203 | Human | Colorectum | FAP | 2.07e-16 | -1.95e-01 | -0.1294 |
| 54621 | VSIG10 | A002-C-201 | Human | Colorectum | FAP | 4.74e-08 | -2.46e-01 | 0.0324 |
| 54621 | VSIG10 | A001-C-108 | Human | Colorectum | FAP | 3.07e-08 | 3.16e-02 | -0.0272 |
| 54621 | VSIG10 | A002-C-205 | Human | Colorectum | FAP | 1.21e-13 | -1.55e-01 | -0.1236 |
| 54621 | VSIG10 | A015-C-006 | Human | Colorectum | FAP | 3.86e-08 | -2.45e-01 | -0.0994 |
| 54621 | VSIG10 | A015-C-106 | Human | Colorectum | FAP | 3.37e-06 | -7.26e-02 | -0.0511 |
| 54621 | VSIG10 | A002-C-114 | Human | Colorectum | FAP | 3.33e-13 | -2.46e-01 | -0.1561 |
| 54621 | VSIG10 | A015-C-104 | Human | Colorectum | FAP | 1.77e-17 | -1.21e-01 | -0.1899 |
| 54621 | VSIG10 | A001-C-014 | Human | Colorectum | FAP | 4.29e-08 | -6.72e-02 | 0.0135 |
| 54621 | VSIG10 | A002-C-016 | Human | Colorectum | FAP | 4.92e-15 | -3.18e-01 | 0.0521 |
| 54621 | VSIG10 | A015-C-002 | Human | Colorectum | FAP | 1.43e-06 | -2.00e-01 | -0.0763 |
| 54621 | VSIG10 | A001-C-203 | Human | Colorectum | FAP | 5.15e-05 | -8.29e-02 | -0.0481 |
| 54621 | VSIG10 | A002-C-116 | Human | Colorectum | FAP | 1.11e-22 | -3.03e-01 | -0.0452 |
| 54621 | VSIG10 | A014-C-008 | Human | Colorectum | FAP | 4.24e-08 | -1.71e-01 | -0.191 |
| 54621 | VSIG10 | A018-E-020 | Human | Colorectum | FAP | 9.57e-12 | -1.47e-01 | -0.2034 |
| 54621 | VSIG10 | F034 | Human | Colorectum | FAP | 7.29e-12 | -2.70e-01 | -0.0665 |
| 54621 | VSIG10 | F072B | Human | Colorectum | FAP | 1.51e-05 | -1.85e-01 | 0.257 |
| Page: 1 2 3 4 5 |
| Tissue | Expression Dynamics | Abbreviation |
| Colorectum (GSE201348) |  | FAP: Familial adenomatous polyposis |
| CRC: Colorectal cancer | ||
| Colorectum (HTA11) | 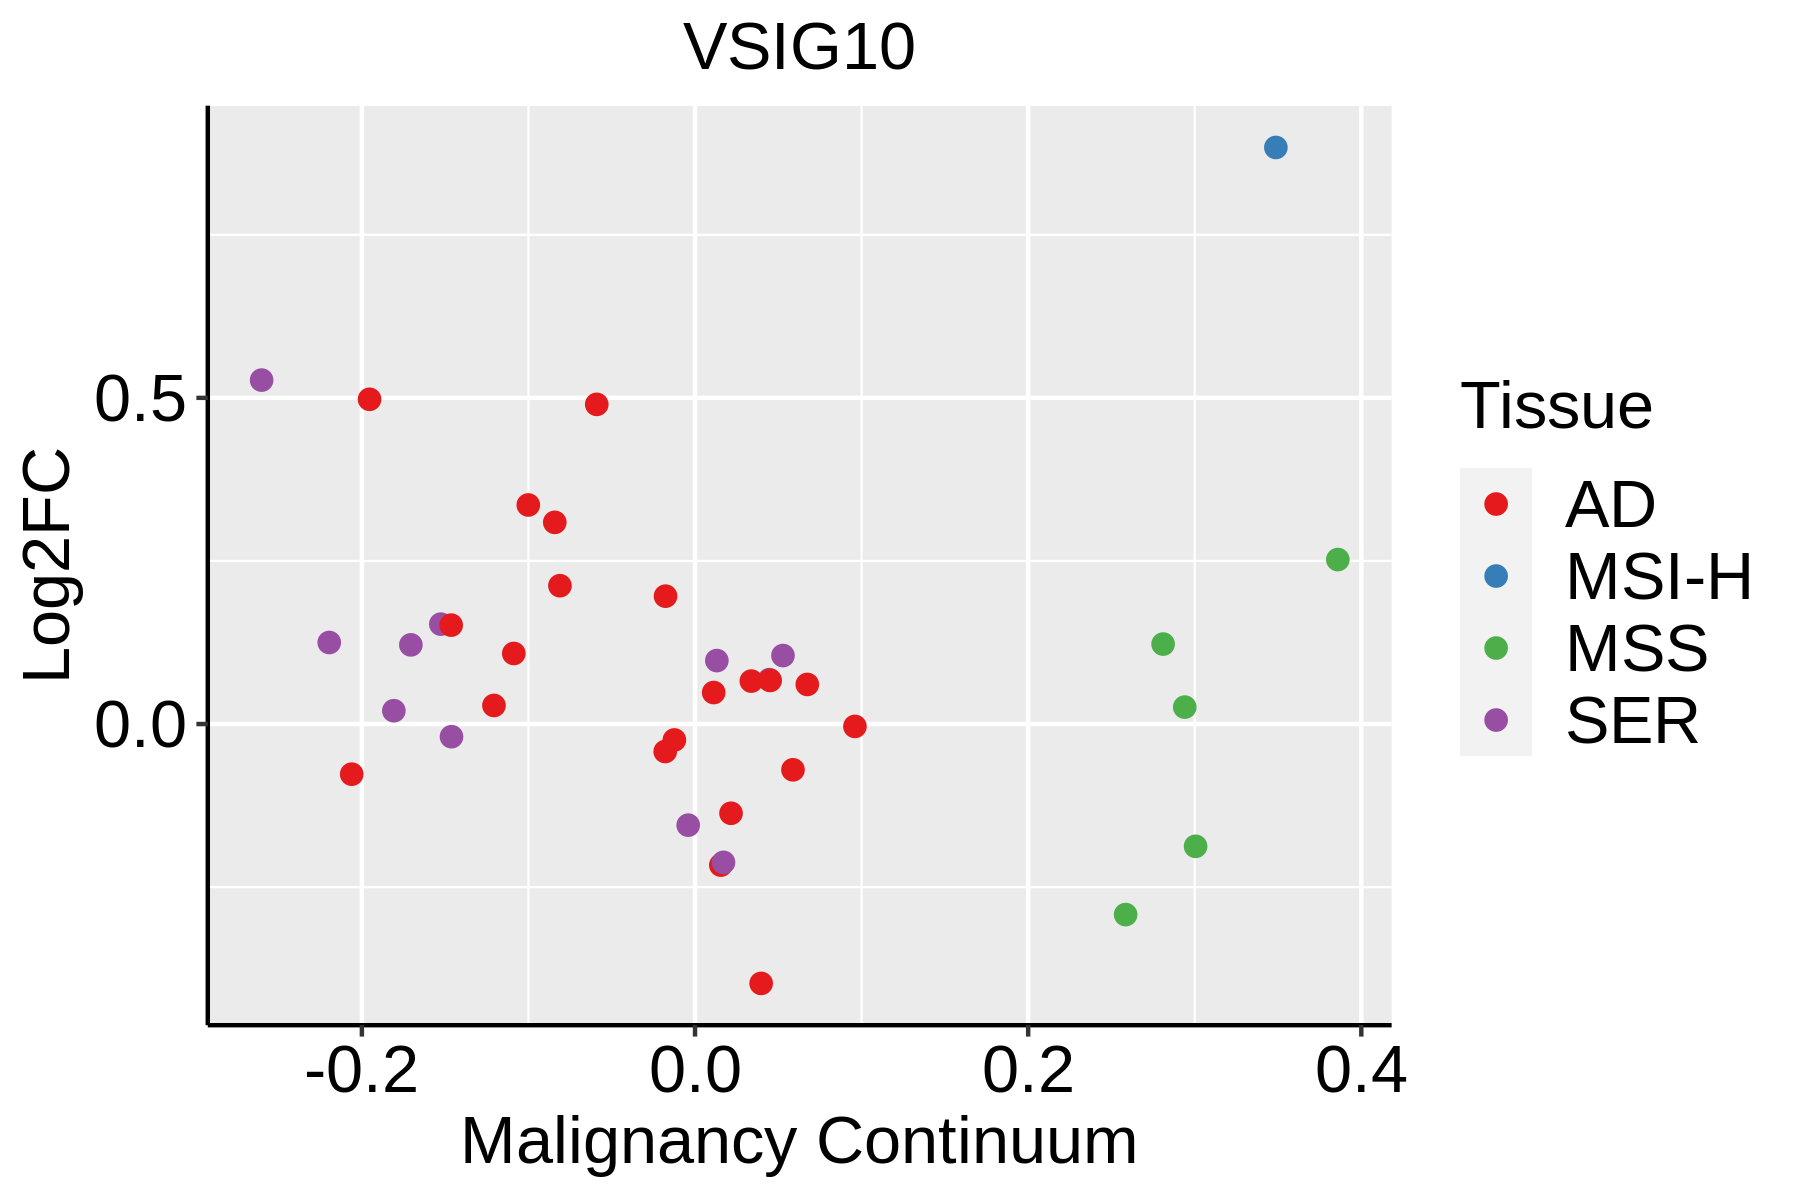 | AD: Adenomas |
| SER: Sessile serrated lesions | ||
| MSI-H: Microsatellite-high colorectal cancer | ||
| MSS: Microsatellite stable colorectal cancer | ||
| Esophagus | 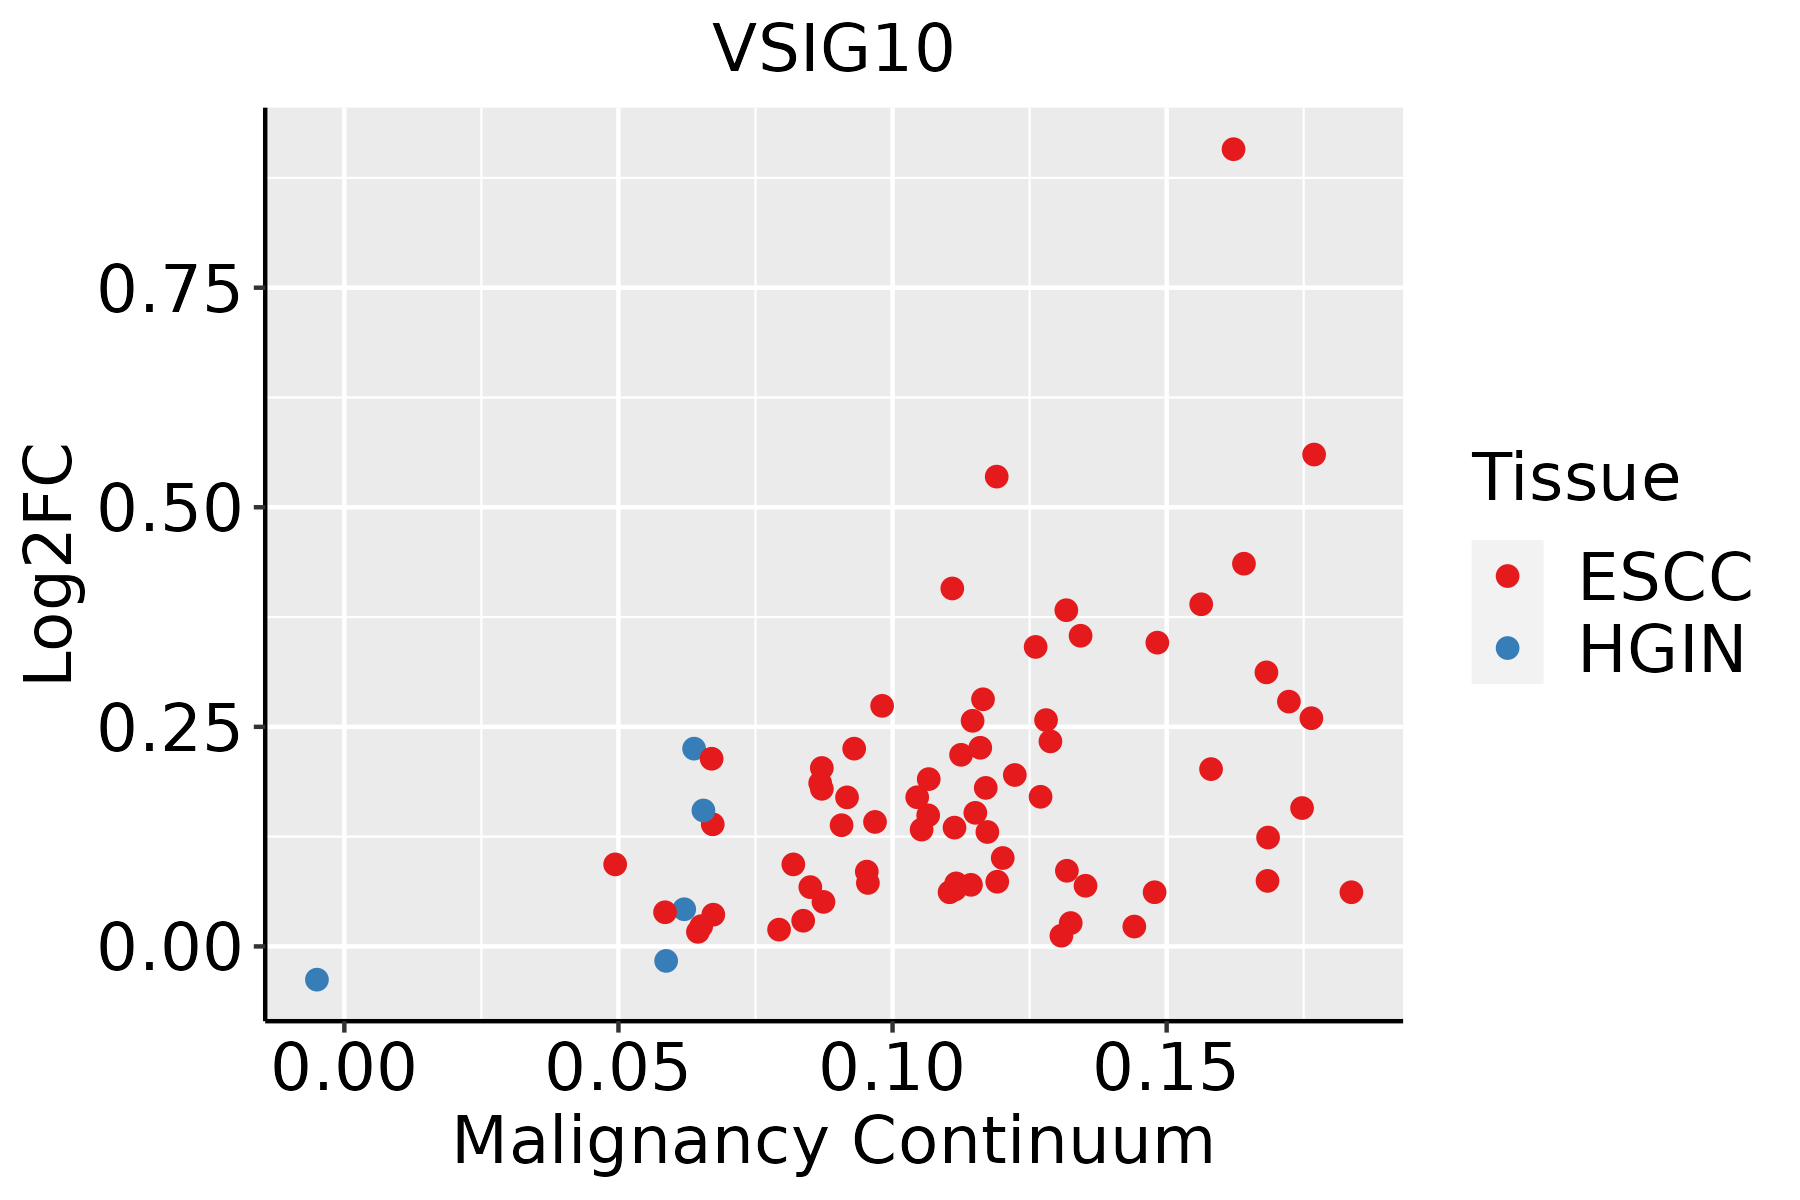 | ESCC: Esophageal squamous cell carcinoma |
| HGIN: High-grade intraepithelial neoplasias | ||
| LGIN: Low-grade intraepithelial neoplasias | ||
| Liver | 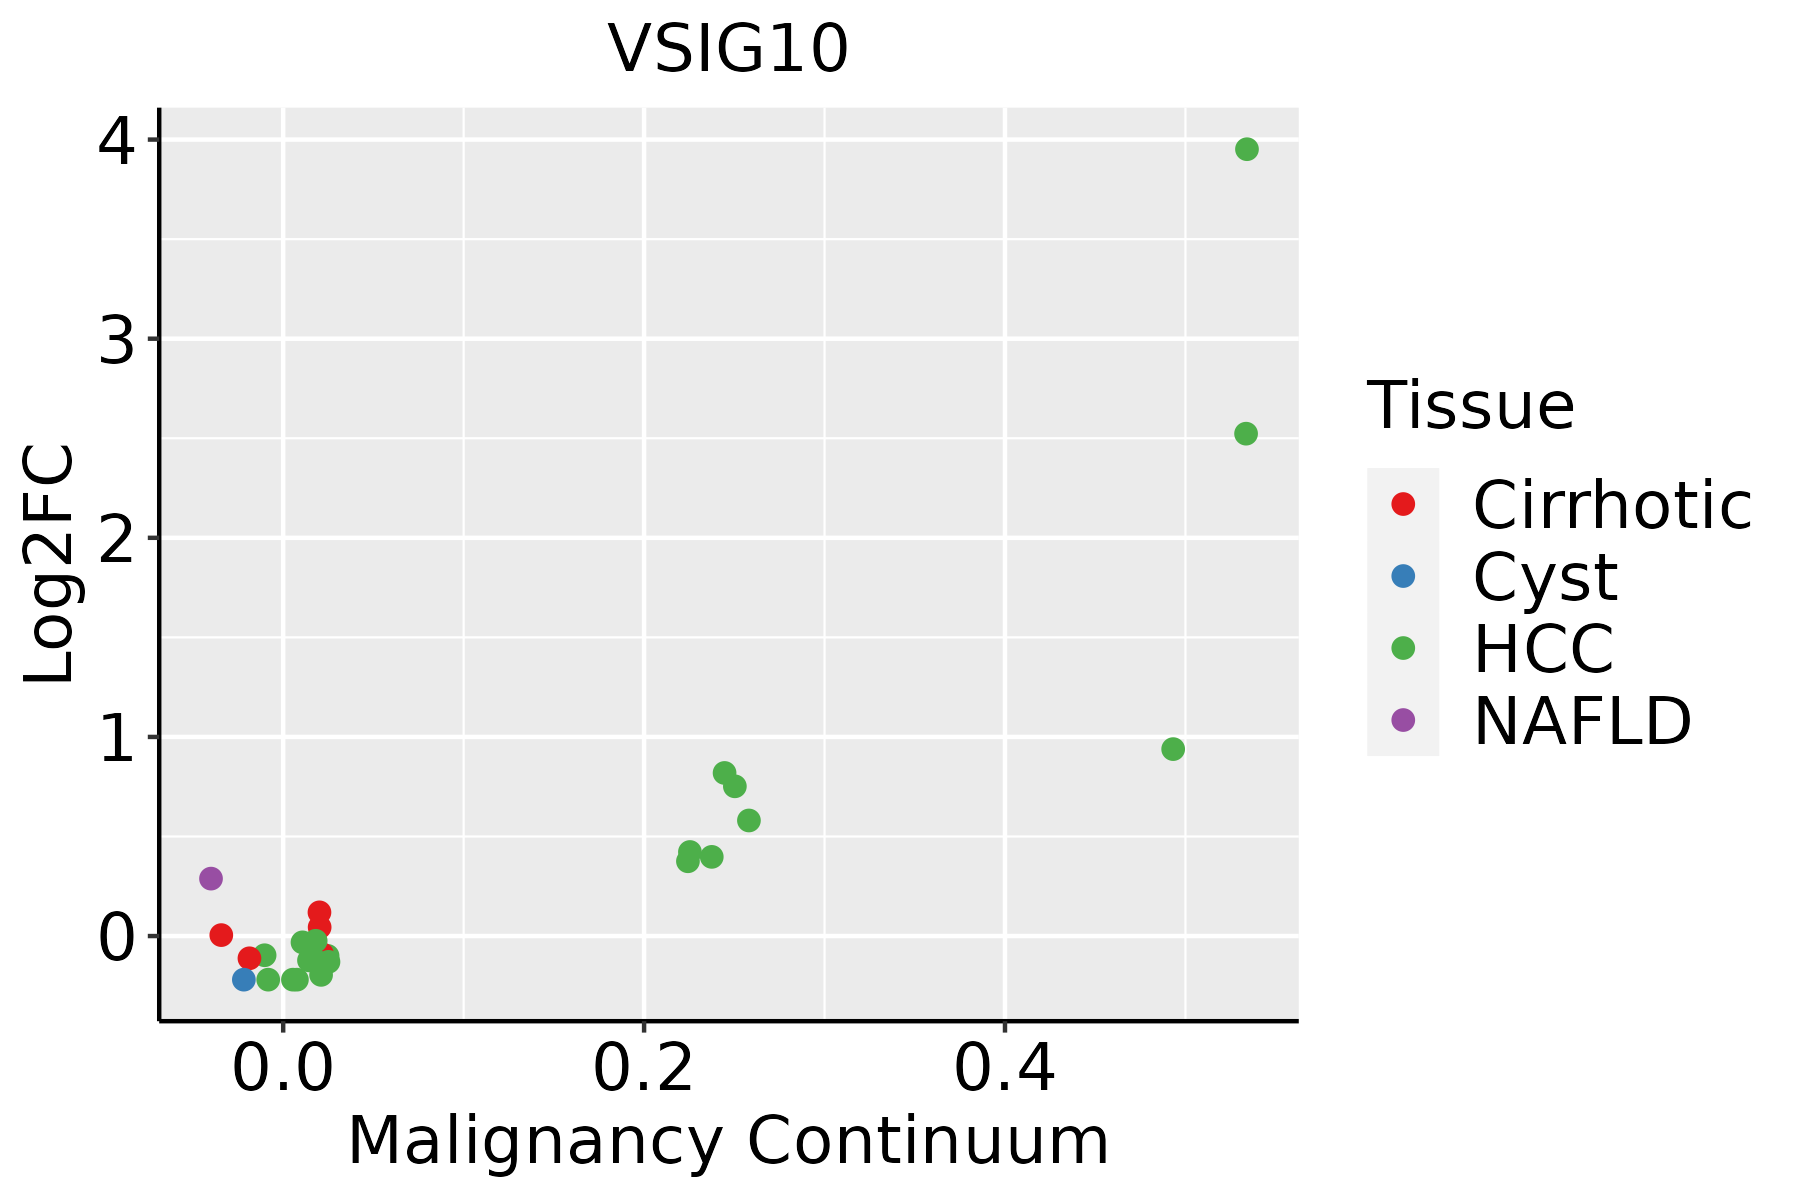 | HCC: Hepatocellular carcinoma |
| NAFLD: Non-alcoholic fatty liver disease | ||
| Thyroid | 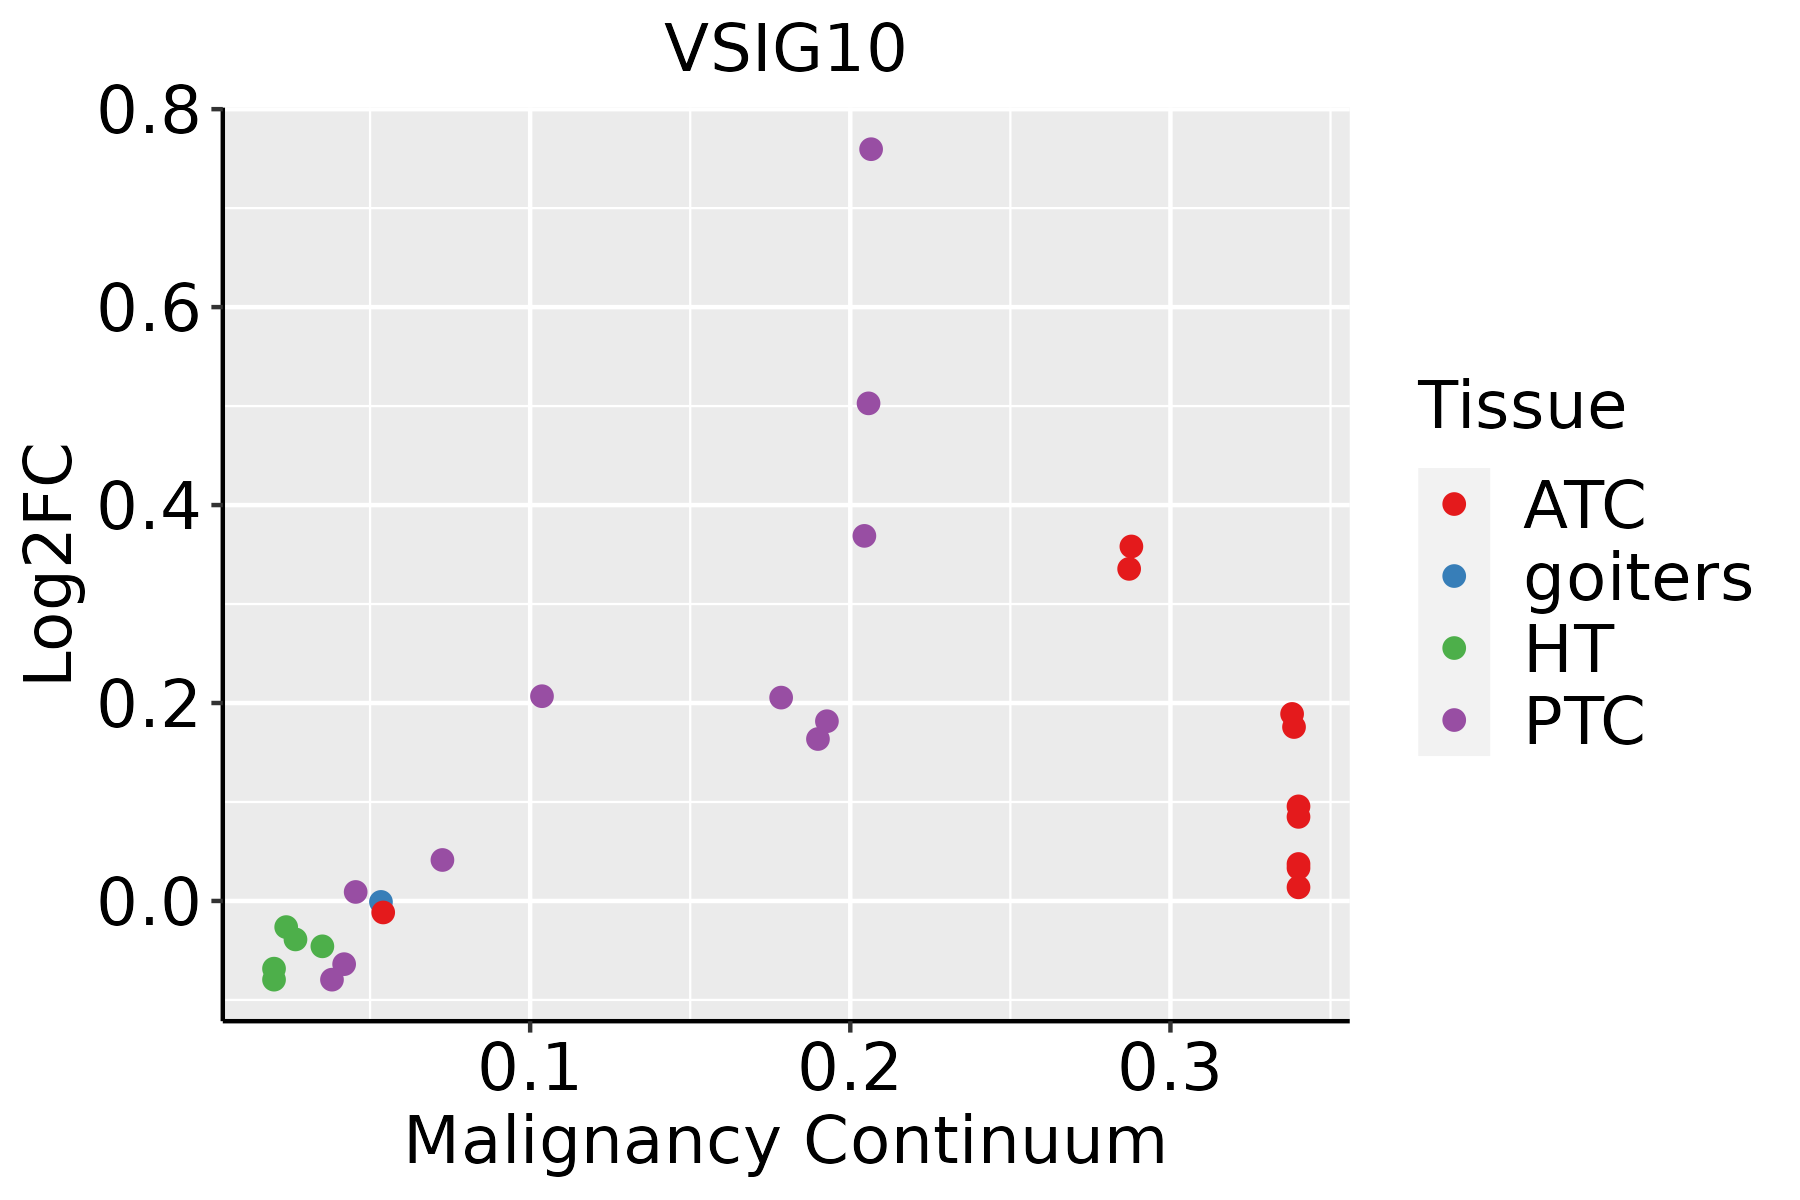 | ATC: Anaplastic thyroid cancer |
| HT: Hashimoto's thyroiditis | ||
| PTC: Papillary thyroid cancer |
| ∗log2FC in expression of this searched gene in stem-like cells from each diseased tissue sample relative to stem-like cells in normal samples in each tissue plotted against the malignancy continuum. Samples are colored based on if they are from different disease stage. |
Top |
Malignant transformation related pathway analysis |
| Find out the enriched GO biological processes and KEGG pathways involved in transition from healthy to precancer to cancer |
| Tissue | Disease Stage | Enriched GO biological Processes |
| Colorectum | AD |  |
| Colorectum | SER |  |
| Colorectum | MSS |  |
| Colorectum | MSI-H |  |
| Colorectum | FAP |  |
| ∗Top 15 enriched GO BP terms are showed in the bar plot of each disease state in each tissue. Each row represents a significant GO biological process which is colored according to the -log10(p.adjust). |
| Page: 1 2 3 4 5 6 7 8 9 |
| GO ID | Tissue | Disease Stage | Description | Gene Ratio | Bg Ratio | pvalue | p.adjust | Count |
| Page: 1 |
| Pathway ID | Tissue | Disease Stage | Description | Gene Ratio | Bg Ratio | pvalue | p.adjust | qvalue | Count |
| Page: 1 |
Top |
Cell-cell communication analysis |
| Identification of potential cell-cell interactions between two cell types and their ligand-receptor pairs for different disease states |
| Ligand | Receptor | LRpair | Pathway | Tissue | Disease Stage |
| Page: 1 |
Top |
Single-cell gene regulatory network inference analysis |
| Find out the significant the regulons (TFs) and the target genes of each regulon across cell types for different disease states |
| TF | Cell Type | Tissue | Disease Stage | Target Gene | RSS | Regulon Activity |
| ∗The dot plots of a searched regulon are shown for all cell subpopulations in each disease state of each tissue based on the regulon specific score inferred using pySCENIC and by calculating the average expression. |
| Page: 1 |
Top |
Somatic mutation of malignant transformation related genes |
| Annotation of somatic variants for genes involved in malignant transformation |
| Hugo Symbol | Variant Class | Variant Classification | dbSNP RS | HGVSc | HGVSp | HGVSp Short | SWISSPROT | BIOTYPE | SIFT | PolyPhen | Tumor Sample Barcode | Tissue | Histology | Sex | Age | Stage | Therapy Types | Drugs | Outcome |
| VSIG10 | SNV | Missense_Mutation | novel | c.304A>C | p.Thr102Pro | p.T102P | Q8N0Z9 | protein_coding | deleterious(0) | probably_damaging(0.987) | TCGA-BH-A0H3-01 | Breast | breast invasive carcinoma | Female | <65 | I/II | Unknown | Unknown | SD |
| VSIG10 | SNV | Missense_Mutation | c.1355N>C | p.Asn452Thr | p.N452T | Q8N0Z9 | protein_coding | tolerated(0.09) | benign(0.01) | TCGA-D8-A1XK-01 | Breast | breast invasive carcinoma | Female | <65 | I/II | Chemotherapy | doxorubicine+cyclophosphamide | SD | |
| VSIG10 | SNV | Missense_Mutation | novel | c.821N>G | p.Val274Gly | p.V274G | Q8N0Z9 | protein_coding | deleterious(0) | probably_damaging(0.975) | TCGA-E9-A1NF-01 | Breast | breast invasive carcinoma | Female | <65 | I/II | Chemotherapy | doxorubicin | PD |
| VSIG10 | SNV | Missense_Mutation | rs774654305 | c.737N>A | p.Arg246His | p.R246H | Q8N0Z9 | protein_coding | tolerated(0.12) | benign(0.012) | TCGA-EA-A3HS-01 | Cervix | cervical & endocervical cancer | Female | <65 | I/II | Unknown | Unknown | SD |
| VSIG10 | SNV | Missense_Mutation | rs754405924 | c.568N>A | p.Leu190Met | p.L190M | Q8N0Z9 | protein_coding | tolerated(0.15) | possibly_damaging(0.755) | TCGA-A6-5660-01 | Colorectum | colon adenocarcinoma | Male | >=65 | III/IV | Ancillary | leucovorin | SD |
| VSIG10 | SNV | Missense_Mutation | rs750908297 | c.364N>A | p.Gly122Ser | p.G122S | Q8N0Z9 | protein_coding | tolerated(0.07) | probably_damaging(0.967) | TCGA-A6-6651-01 | Colorectum | colon adenocarcinoma | Female | <65 | III/IV | Ancillary | leucovorin | SD |
| VSIG10 | SNV | Missense_Mutation | rs376013945 | c.1078N>T | p.Arg360Cys | p.R360C | Q8N0Z9 | protein_coding | deleterious(0) | probably_damaging(0.918) | TCGA-AD-A5EJ-01 | Colorectum | colon adenocarcinoma | Female | >=65 | I/II | Unknown | Unknown | SD |
| VSIG10 | SNV | Missense_Mutation | rs371765006 | c.983C>T | p.Thr328Met | p.T328M | Q8N0Z9 | protein_coding | deleterious(0) | probably_damaging(1) | TCGA-AZ-4313-01 | Colorectum | colon adenocarcinoma | Female | <65 | I/II | Unknown | Unknown | SD |
| VSIG10 | SNV | Missense_Mutation | novel | c.1240N>G | p.Ile414Val | p.I414V | Q8N0Z9 | protein_coding | tolerated(0.5) | benign(0.091) | TCGA-AZ-4315-01 | Colorectum | colon adenocarcinoma | Male | <65 | I/II | Unknown | Unknown | SD |
| VSIG10 | SNV | Missense_Mutation | rs774654305 | c.737G>A | p.Arg246His | p.R246H | Q8N0Z9 | protein_coding | tolerated(0.12) | benign(0.012) | TCGA-CK-4951-01 | Colorectum | colon adenocarcinoma | Female | >=65 | I/II | Unknown | Unknown | PD |
| Page: 1 2 3 4 5 |
Top |
Related drugs of malignant transformation related genes |
| Identification of chemicals and drugs interact with genes involved in malignant transfromation |
| (DGIdb 4.0) |
| Entrez ID | Symbol | Category | Interaction Types | Drug Claim Name | Drug Name | PMIDs |
| Page: 1 |

Copyright 2023-Present -The University of Texas Health Science Center at Houston |