
|
|||||
|
 | |
| |
| |
| |
| |
| |
|
Gene: VSIG1 |
Gene summary for VSIG1 |
| Gene information | Species | Human | Gene symbol | VSIG1 | Gene ID | 340547 |
| Gene name | V-set and immunoglobulin domain containing 1 | |
| Gene Alias | 1700062D20Rik | |
| Cytomap | Xq22.3 | |
| Gene Type | protein-coding | GO ID | GO:0000902 | UniProtAcc | Q86XK7 |
Top |
Malignant transformation analysis |
| Identification of the aberrant gene expression in precancerous and cancerous lesions by comparing the gene expression of stem-like cells in diseased tissues with normal stem cells |
| Entrez ID | Symbol | Replicates | Species | Organ | Tissue | Adj P-value | Log2FC | Malignancy |
| 340547 | VSIG1 | P94T-E | Human | Esophagus | ESCC | 3.53e-11 | 1.47e+00 | 0.0879 |
| 340547 | VSIG1 | P104T-E | Human | Esophagus | ESCC | 1.13e-24 | 1.57e+00 | 0.0931 |
| 340547 | VSIG1 | HCC2_Meng | Human | Liver | HCC | 8.44e-41 | 5.20e-01 | 0.0107 |
| 340547 | VSIG1 | HCC1 | Human | Liver | HCC | 8.19e-15 | 1.21e+00 | 0.5336 |
| 340547 | VSIG1 | HCC2 | Human | Liver | HCC | 4.81e-13 | 1.99e+00 | 0.5341 |
| 340547 | VSIG1 | HCC5 | Human | Liver | HCC | 3.41e-22 | 1.21e+00 | 0.4932 |
| 340547 | VSIG1 | S028 | Human | Liver | HCC | 7.23e-03 | 3.98e-01 | 0.2503 |
| 340547 | VSIG1 | S029 | Human | Liver | HCC | 1.29e-24 | 1.21e+00 | 0.2581 |
| 340547 | VSIG1 | Pat01-B | Human | Stomach | GC | 9.11e-43 | -1.15e+00 | 0.5754 |
| 340547 | VSIG1 | Pat02-B | Human | Stomach | GC | 1.87e-53 | -6.55e-01 | 0.0368 |
| 340547 | VSIG1 | Pat03-B | Human | Stomach | GC | 1.35e-51 | -1.15e+00 | 0.3693 |
| 340547 | VSIG1 | Pat04-B | Human | Stomach | GC | 8.72e-40 | -6.89e-01 | -0.1483 |
| 340547 | VSIG1 | Pat05-B | Human | Stomach | GC | 3.69e-24 | -8.02e-01 | -0.0353 |
| 340547 | VSIG1 | Pat06-B | Human | Stomach | GC | 4.69e-72 | -3.93e-01 | -0.1961 |
| 340547 | VSIG1 | Pat07-B | Human | Stomach | GC | 6.72e-15 | -1.28e+00 | 0.0935 |
| 340547 | VSIG1 | Pat08-B | Human | Stomach | GC | 8.15e-13 | -9.82e-01 | 0.0182 |
| 340547 | VSIG1 | Pat09-B | Human | Stomach | GC | 2.18e-26 | -6.40e-01 | -0.0359 |
| 340547 | VSIG1 | Pat10-B | Human | Stomach | GC | 6.72e-06 | -5.89e-01 | 0.084 |
| 340547 | VSIG1 | Pat11-B | Human | Stomach | GC | 3.34e-34 | -4.19e-01 | -0.182 |
| 340547 | VSIG1 | Pat12-B | Human | Stomach | GC | 3.00e-39 | -6.52e-01 | 0.0325 |
| Page: 1 2 3 |
| Tissue | Expression Dynamics | Abbreviation |
| Esophagus |  | ESCC: Esophageal squamous cell carcinoma |
| HGIN: High-grade intraepithelial neoplasias | ||
| LGIN: Low-grade intraepithelial neoplasias | ||
| GC |  | CAG: Chronic atrophic gastritis |
| CAG with IM: Chronic atrophic gastritis with intestinal metaplasia | ||
| CSG: Chronic superficial gastritis | ||
| GC: Gastric cancer | ||
| SIM: Severe intestinal metaplasia | ||
| WIM: Wild intestinal metaplasia | ||
| Liver | 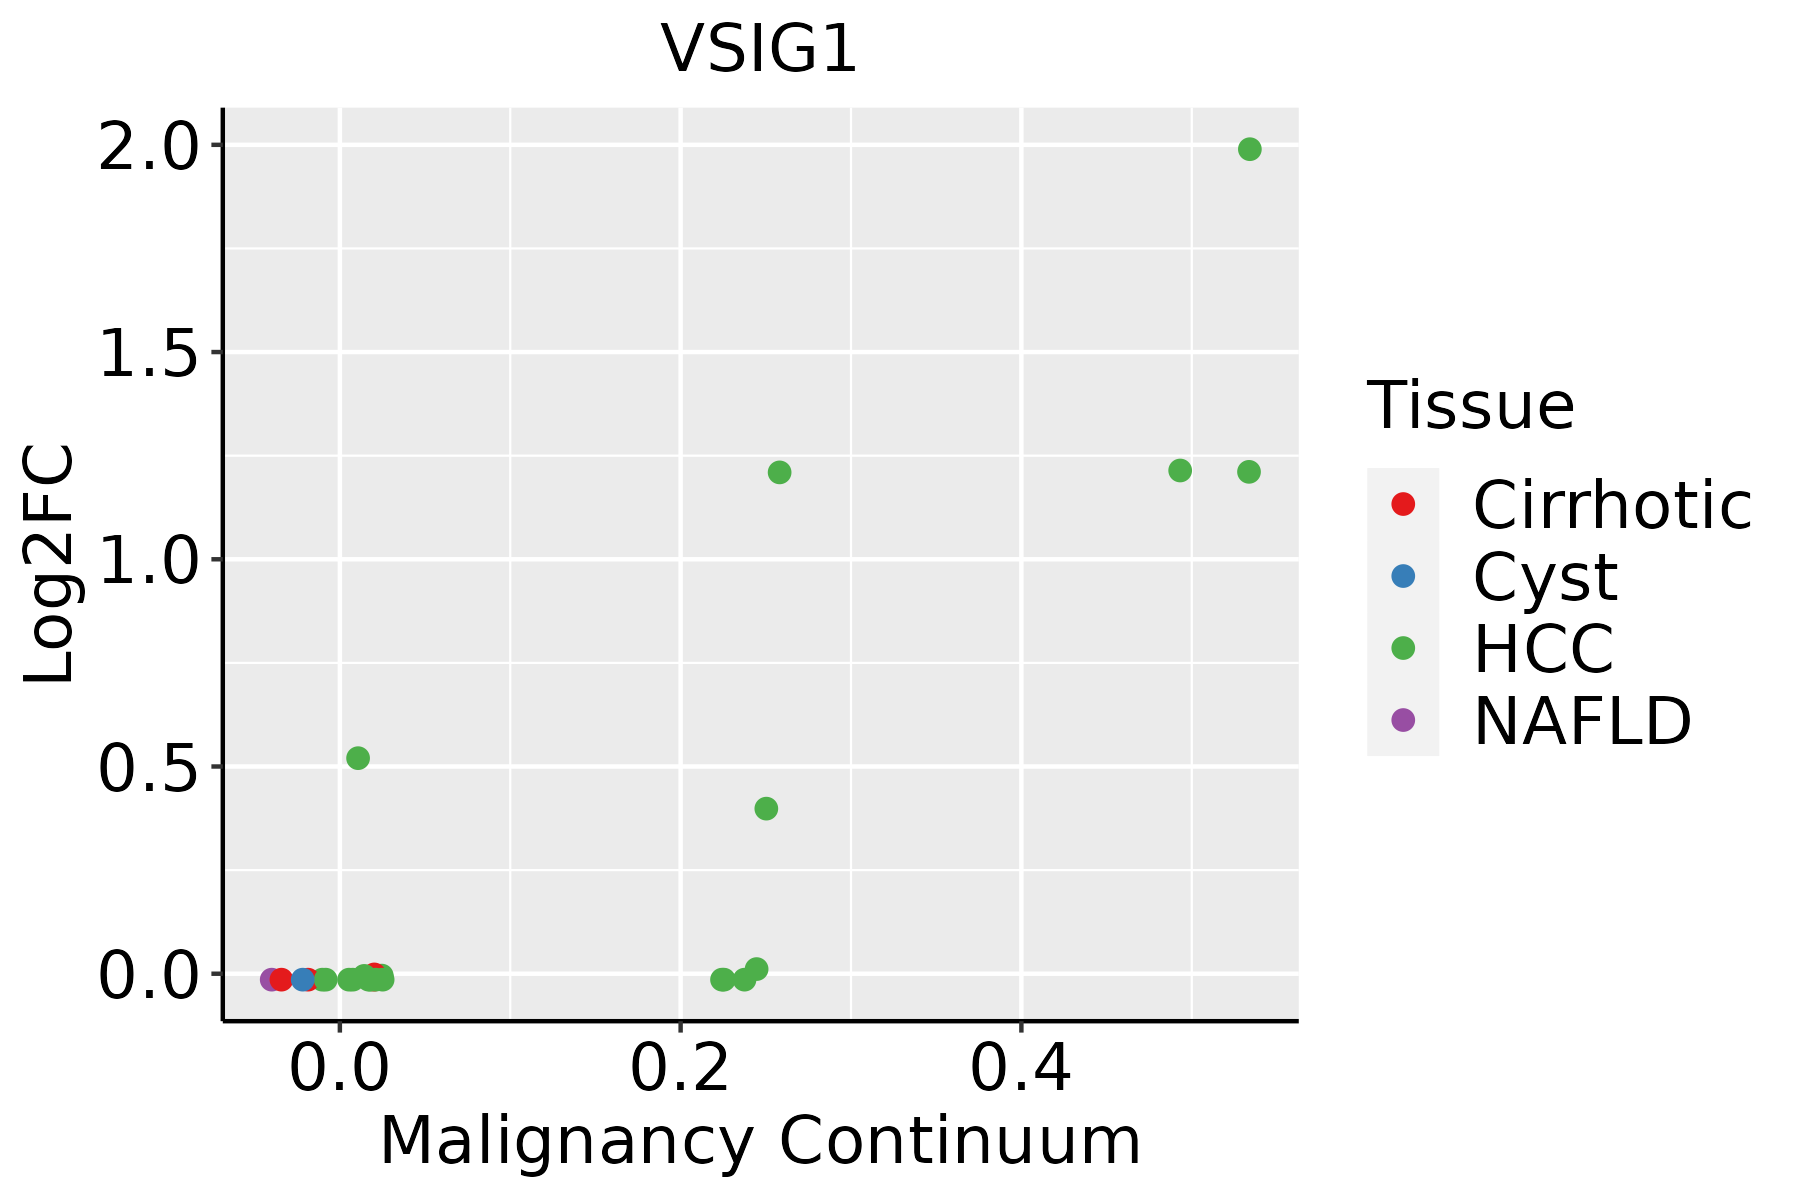 | HCC: Hepatocellular carcinoma |
| NAFLD: Non-alcoholic fatty liver disease |
| ∗log2FC in expression of this searched gene in stem-like cells from each diseased tissue sample relative to stem-like cells in normal samples in each tissue plotted against the malignancy continuum. Samples are colored based on if they are from different disease stage. |
Top |
Malignant transformation related pathway analysis |
| Find out the enriched GO biological processes and KEGG pathways involved in transition from healthy to precancer to cancer |
| Tissue | Disease Stage | Enriched GO biological Processes |
| Colorectum | AD |  |
| Colorectum | SER |  |
| Colorectum | MSS |  |
| Colorectum | MSI-H |  |
| Colorectum | FAP |  |
| ∗Top 15 enriched GO BP terms are showed in the bar plot of each disease state in each tissue. Each row represents a significant GO biological process which is colored according to the -log10(p.adjust). |
| Page: 1 2 3 4 5 6 7 8 9 |
| GO ID | Tissue | Disease Stage | Description | Gene Ratio | Bg Ratio | pvalue | p.adjust | Count |
| GO:000206420 | Esophagus | ESCC | epithelial cell development | 136/8552 | 220/18723 | 9.50e-07 | 1.21e-05 | 136 |
| GO:00033824 | Esophagus | ESCC | epithelial cell morphogenesis | 22/8552 | 33/18723 | 1.22e-02 | 4.08e-02 | 22 |
| GO:000206422 | Liver | HCC | epithelial cell development | 114/7958 | 220/18723 | 3.19e-03 | 1.47e-02 | 114 |
| GO:0007586 | Stomach | GC | digestion | 38/1159 | 137/18723 | 1.80e-15 | 1.22e-12 | 38 |
| GO:00226006 | Stomach | GC | digestive system process | 30/1159 | 104/18723 | 5.40e-13 | 2.10e-10 | 30 |
| GO:00018946 | Stomach | GC | tissue homeostasis | 43/1159 | 268/18723 | 8.25e-09 | 8.22e-07 | 43 |
| GO:00602496 | Stomach | GC | anatomical structure homeostasis | 47/1159 | 314/18723 | 1.62e-08 | 1.40e-06 | 47 |
| GO:00302776 | Stomach | GC | maintenance of gastrointestinal epithelium | 9/1159 | 22/18723 | 3.09e-06 | 1.27e-04 | 9 |
| GO:00106696 | Stomach | GC | epithelial structure maintenance | 10/1159 | 30/18723 | 7.63e-06 | 2.77e-04 | 10 |
| GO:00020646 | Stomach | GC | epithelial cell development | 30/1159 | 220/18723 | 3.92e-05 | 9.90e-04 | 30 |
| GO:0003382 | Stomach | GC | epithelial cell morphogenesis | 8/1159 | 33/18723 | 7.27e-04 | 9.50e-03 | 8 |
| GO:00075861 | Stomach | CAG with IM | digestion | 29/1050 | 137/18723 | 4.42e-10 | 6.93e-08 | 29 |
| GO:000189411 | Stomach | CAG with IM | tissue homeostasis | 42/1050 | 268/18723 | 1.40e-09 | 1.74e-07 | 42 |
| GO:006024911 | Stomach | CAG with IM | anatomical structure homeostasis | 46/1050 | 314/18723 | 2.18e-09 | 2.64e-07 | 46 |
| GO:002260011 | Stomach | CAG with IM | digestive system process | 22/1050 | 104/18723 | 5.62e-08 | 4.16e-06 | 22 |
| GO:003027711 | Stomach | CAG with IM | maintenance of gastrointestinal epithelium | 9/1050 | 22/18723 | 1.36e-06 | 6.46e-05 | 9 |
| GO:00106691 | Stomach | CAG with IM | epithelial structure maintenance | 10/1050 | 30/18723 | 3.16e-06 | 1.28e-04 | 10 |
| GO:000206411 | Stomach | CAG with IM | epithelial cell development | 29/1050 | 220/18723 | 1.64e-05 | 5.16e-04 | 29 |
| GO:00033821 | Stomach | CAG with IM | epithelial cell morphogenesis | 7/1050 | 33/18723 | 2.02e-03 | 2.10e-02 | 7 |
| GO:000189421 | Stomach | CSG | tissue homeostasis | 40/1034 | 268/18723 | 9.33e-09 | 8.66e-07 | 40 |
| Page: 1 2 3 |
| Pathway ID | Tissue | Disease Stage | Description | Gene Ratio | Bg Ratio | pvalue | p.adjust | qvalue | Count |
| Page: 1 |
Top |
Cell-cell communication analysis |
| Identification of potential cell-cell interactions between two cell types and their ligand-receptor pairs for different disease states |
| Ligand | Receptor | LRpair | Pathway | Tissue | Disease Stage |
| Page: 1 |
Top |
Single-cell gene regulatory network inference analysis |
| Find out the significant the regulons (TFs) and the target genes of each regulon across cell types for different disease states |
| TF | Cell Type | Tissue | Disease Stage | Target Gene | RSS | Regulon Activity |
| ∗The dot plots of a searched regulon are shown for all cell subpopulations in each disease state of each tissue based on the regulon specific score inferred using pySCENIC and by calculating the average expression. |
| Page: 1 |
Top |
Somatic mutation of malignant transformation related genes |
| Annotation of somatic variants for genes involved in malignant transformation |
| Hugo Symbol | Variant Class | Variant Classification | dbSNP RS | HGVSc | HGVSp | HGVSp Short | SWISSPROT | BIOTYPE | SIFT | PolyPhen | Tumor Sample Barcode | Tissue | Histology | Sex | Age | Stage | Therapy Types | Drugs | Outcome |
| VSIG1 | SNV | Missense_Mutation | c.391N>T | p.Asp131Tyr | p.D131Y | Q86XK7 | protein_coding | tolerated(0.07) | possibly_damaging(0.793) | TCGA-A2-A1FZ-01 | Breast | breast invasive carcinoma | Female | <65 | I/II | Unspecific | Arimidex | SD | |
| VSIG1 | SNV | Missense_Mutation | rs753742122 | c.155G>A | p.Arg52Gln | p.R52Q | Q86XK7 | protein_coding | tolerated(0.65) | benign(0.035) | TCGA-AN-A046-01 | Breast | breast invasive carcinoma | Female | >=65 | I/II | Unknown | Unknown | SD |
| VSIG1 | SNV | Missense_Mutation | novel | c.911G>T | p.Arg304Ile | p.R304I | Q86XK7 | protein_coding | deleterious(0.01) | possibly_damaging(0.497) | TCGA-AN-A046-01 | Breast | breast invasive carcinoma | Female | >=65 | I/II | Unknown | Unknown | SD |
| VSIG1 | SNV | Missense_Mutation | c.643N>A | p.Gly215Arg | p.G215R | Q86XK7 | protein_coding | tolerated(0.06) | probably_damaging(0.984) | TCGA-C8-A12L-01 | Breast | breast invasive carcinoma | Female | >=65 | I/II | Unknown | Unknown | SD | |
| VSIG1 | SNV | Missense_Mutation | c.640G>C | p.Glu214Gln | p.E214Q | Q86XK7 | protein_coding | tolerated(0.19) | benign(0.422) | TCGA-E2-A1LB-01 | Breast | breast invasive carcinoma | Female | <65 | I/II | Chemotherapy | cytoxan | SD | |
| VSIG1 | insertion | Nonsense_Mutation | novel | c.571_572insCCTCAGGACTGTTCCAGTGCTAACTCACCTGGG | p.His191delinsProSerGlyLeuPheGlnCysTerLeuThrTrpAsp | p.H191delinsPSGLFQC*LTWD | Q86XK7 | protein_coding | TCGA-AO-A128-01 | Breast | breast invasive carcinoma | Female | <65 | I/II | Chemotherapy | doxorubicin | SD | ||
| VSIG1 | insertion | Frame_Shift_Ins | novel | c.576_577insTGGAGATCAAAGGGGTTTTTAAATGTTCAAAAACTGGAGGG | p.Ile193TrpfsTer43 | p.I193Wfs*43 | Q86XK7 | protein_coding | TCGA-BH-A0AY-01 | Breast | breast invasive carcinoma | Female | <65 | I/II | Chemotherapy | SD | |||
| VSIG1 | SNV | Missense_Mutation | c.1165N>A | p.Glu389Lys | p.E389K | Q86XK7 | protein_coding | tolerated_low_confidence(0.08) | benign(0.026) | TCGA-C5-A2M2-01 | Cervix | cervical & endocervical cancer | Female | <65 | I/II | Unknown | Unknown | SD | |
| VSIG1 | SNV | Missense_Mutation | c.552A>C | p.Gln184His | p.Q184H | Q86XK7 | protein_coding | tolerated(0.28) | possibly_damaging(0.505) | TCGA-EK-A2RN-01 | Cervix | cervical & endocervical cancer | Female | <65 | I/II | Unknown | Unknown | SD | |
| VSIG1 | SNV | Missense_Mutation | c.1231N>C | p.Glu411Gln | p.E411Q | Q86XK7 | protein_coding | deleterious_low_confidence(0.01) | benign(0.031) | TCGA-LP-A5U2-01 | Cervix | cervical & endocervical cancer | Female | <65 | III/IV | Unknown | Unknown | SD |
| Page: 1 2 3 4 5 6 7 |
Top |
Related drugs of malignant transformation related genes |
| Identification of chemicals and drugs interact with genes involved in malignant transfromation |
| (DGIdb 4.0) |
| Entrez ID | Symbol | Category | Interaction Types | Drug Claim Name | Drug Name | PMIDs |
| Page: 1 |

Copyright 2023-Present -The University of Texas Health Science Center at Houston |