| Tissue | Expression Dynamics | Abbreviation |
| Colorectum (GSE201348) | 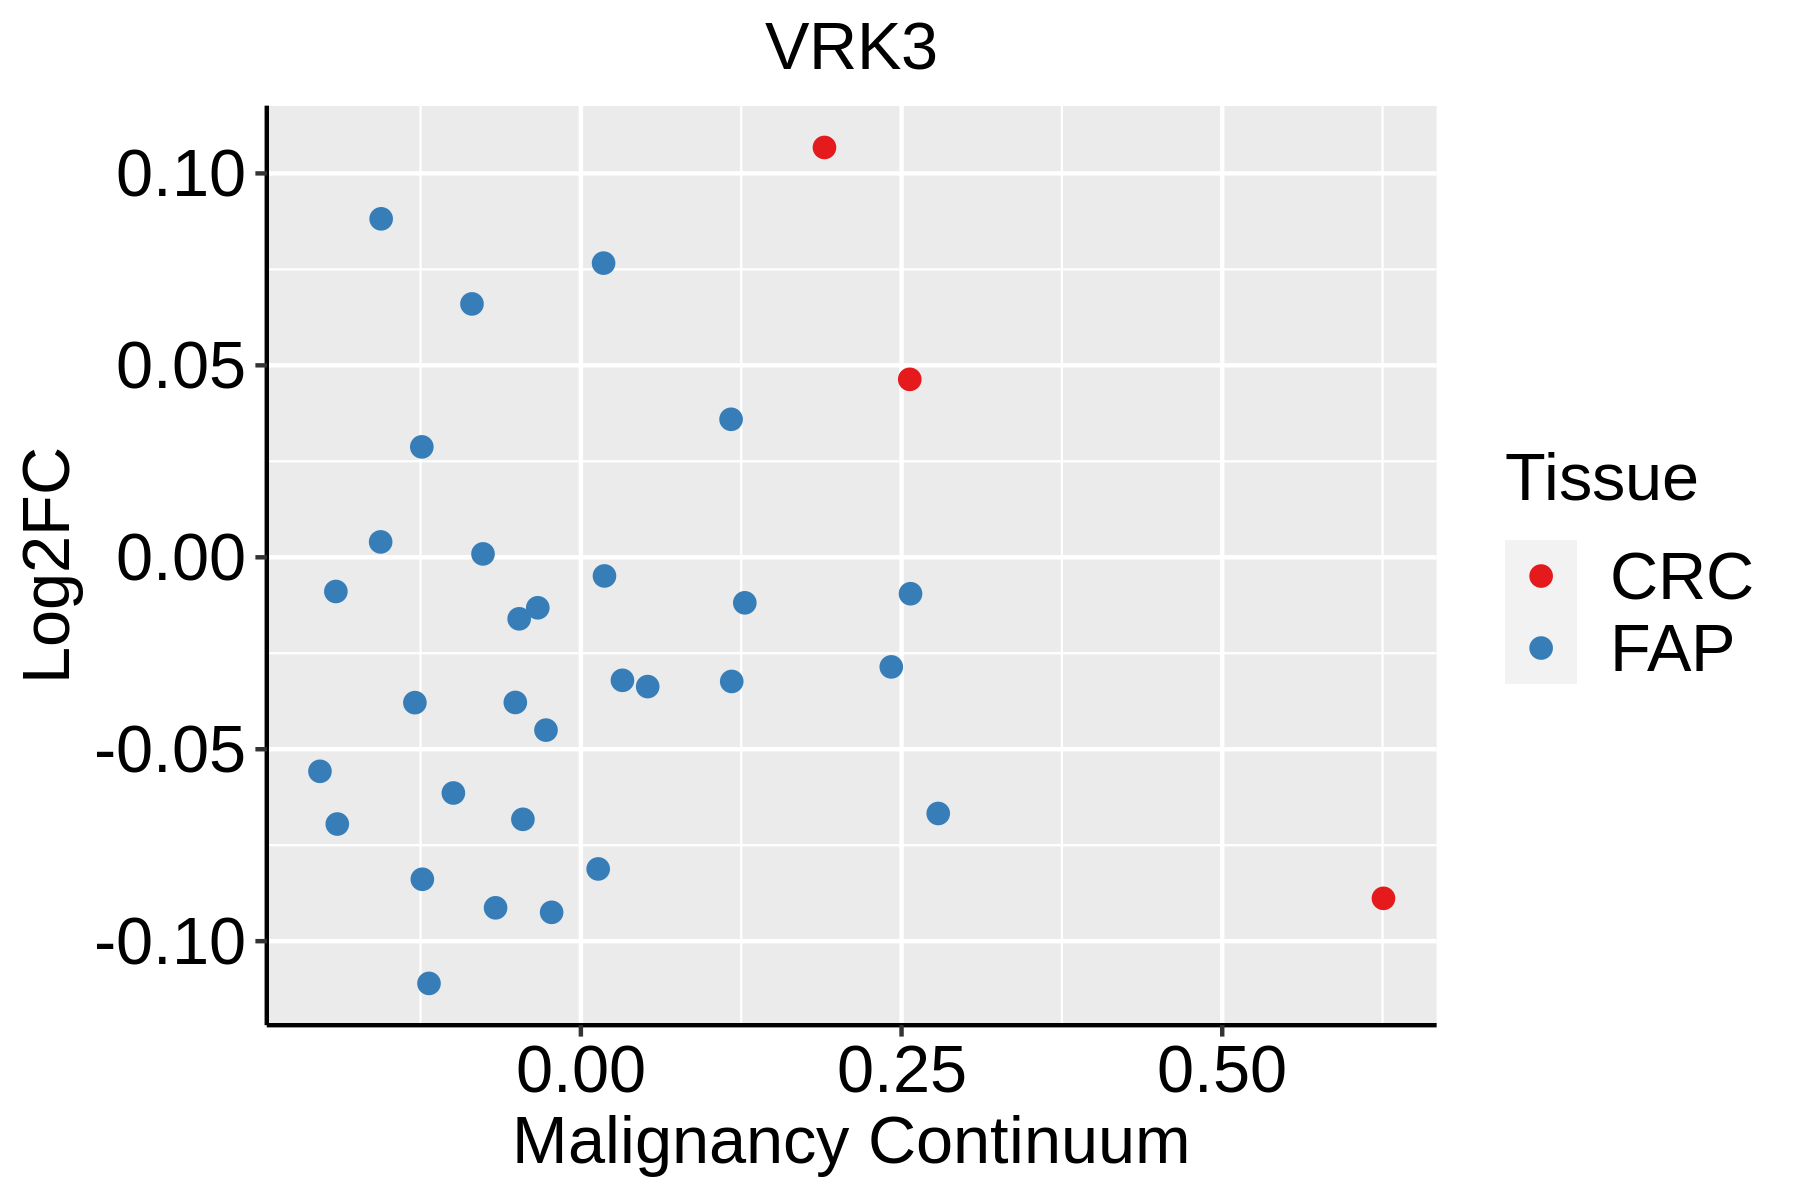 | FAP: Familial adenomatous polyposis |
| CRC: Colorectal cancer |
| Colorectum (HTA11) | 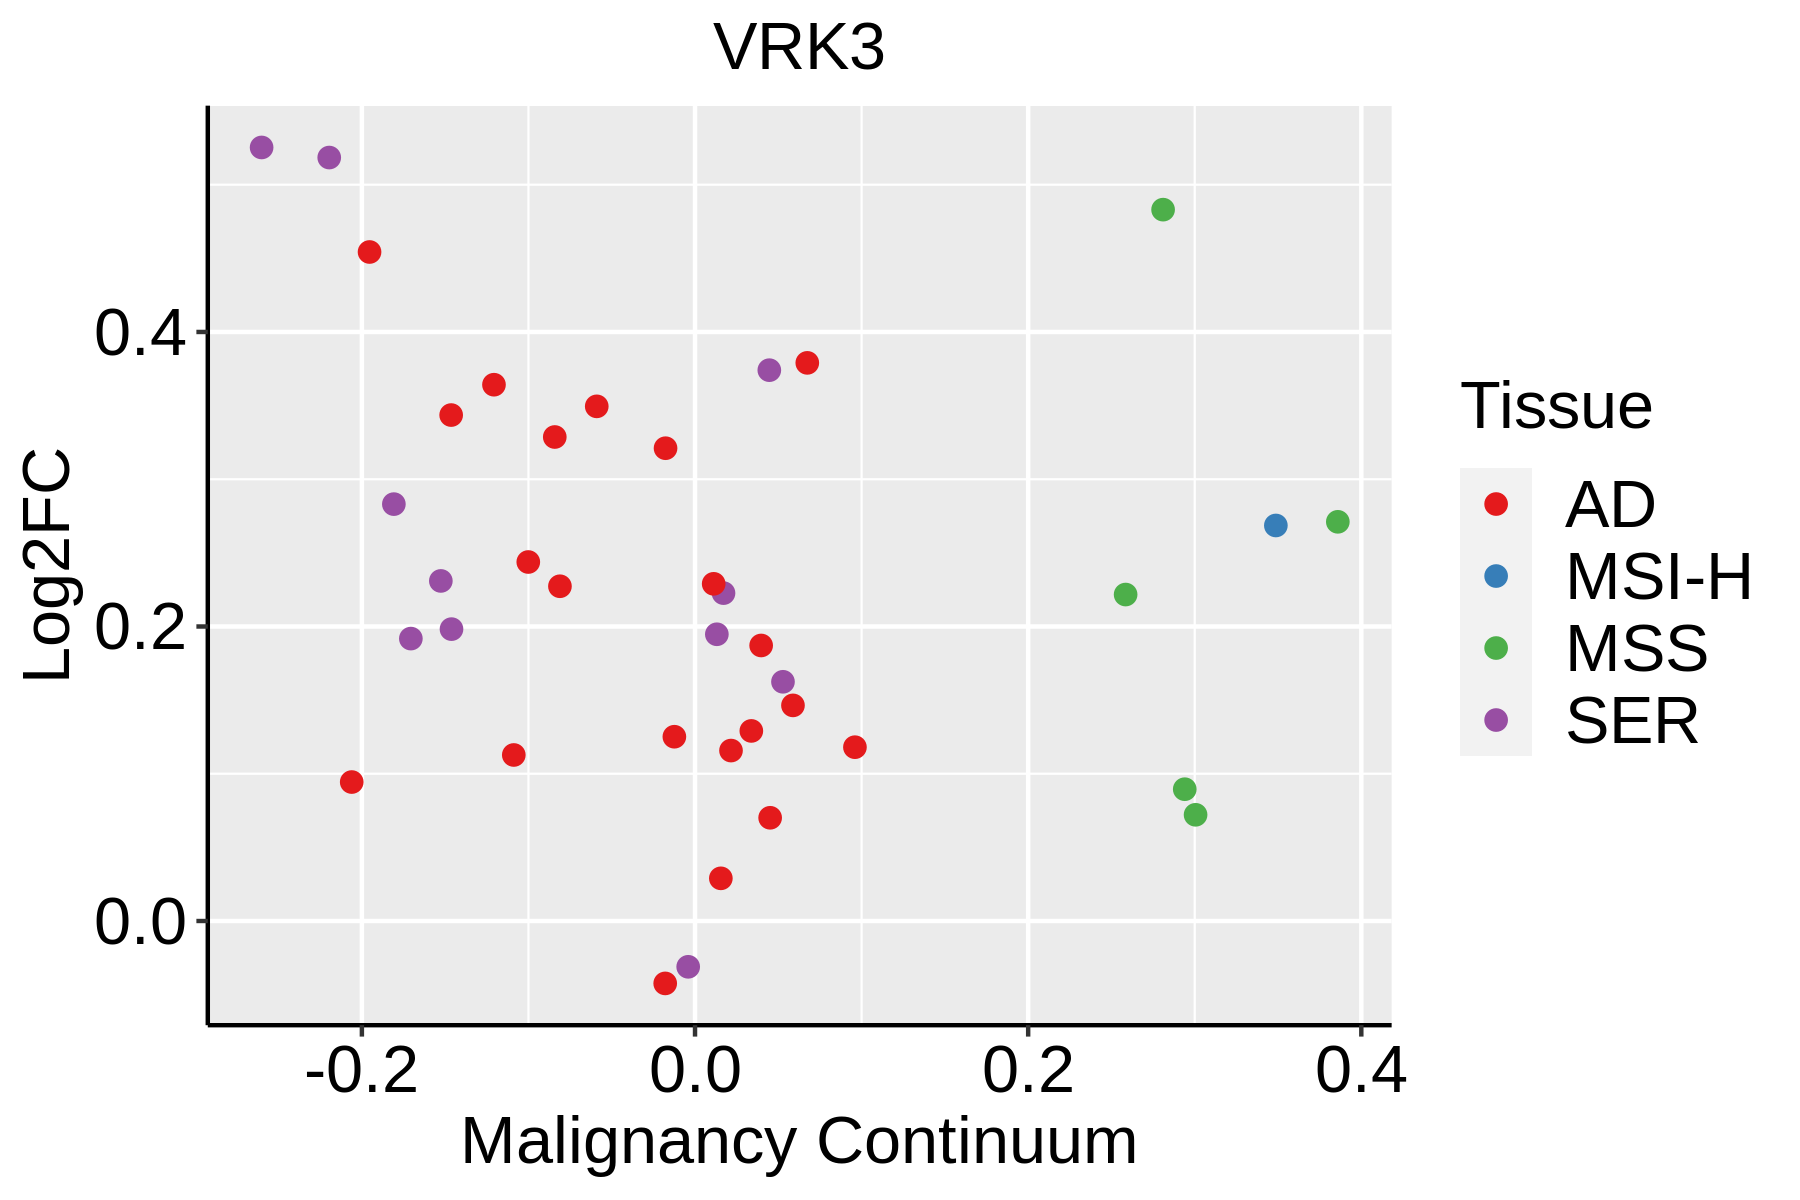 | AD: Adenomas |
| SER: Sessile serrated lesions |
| MSI-H: Microsatellite-high colorectal cancer |
| MSS: Microsatellite stable colorectal cancer |
| Esophagus | 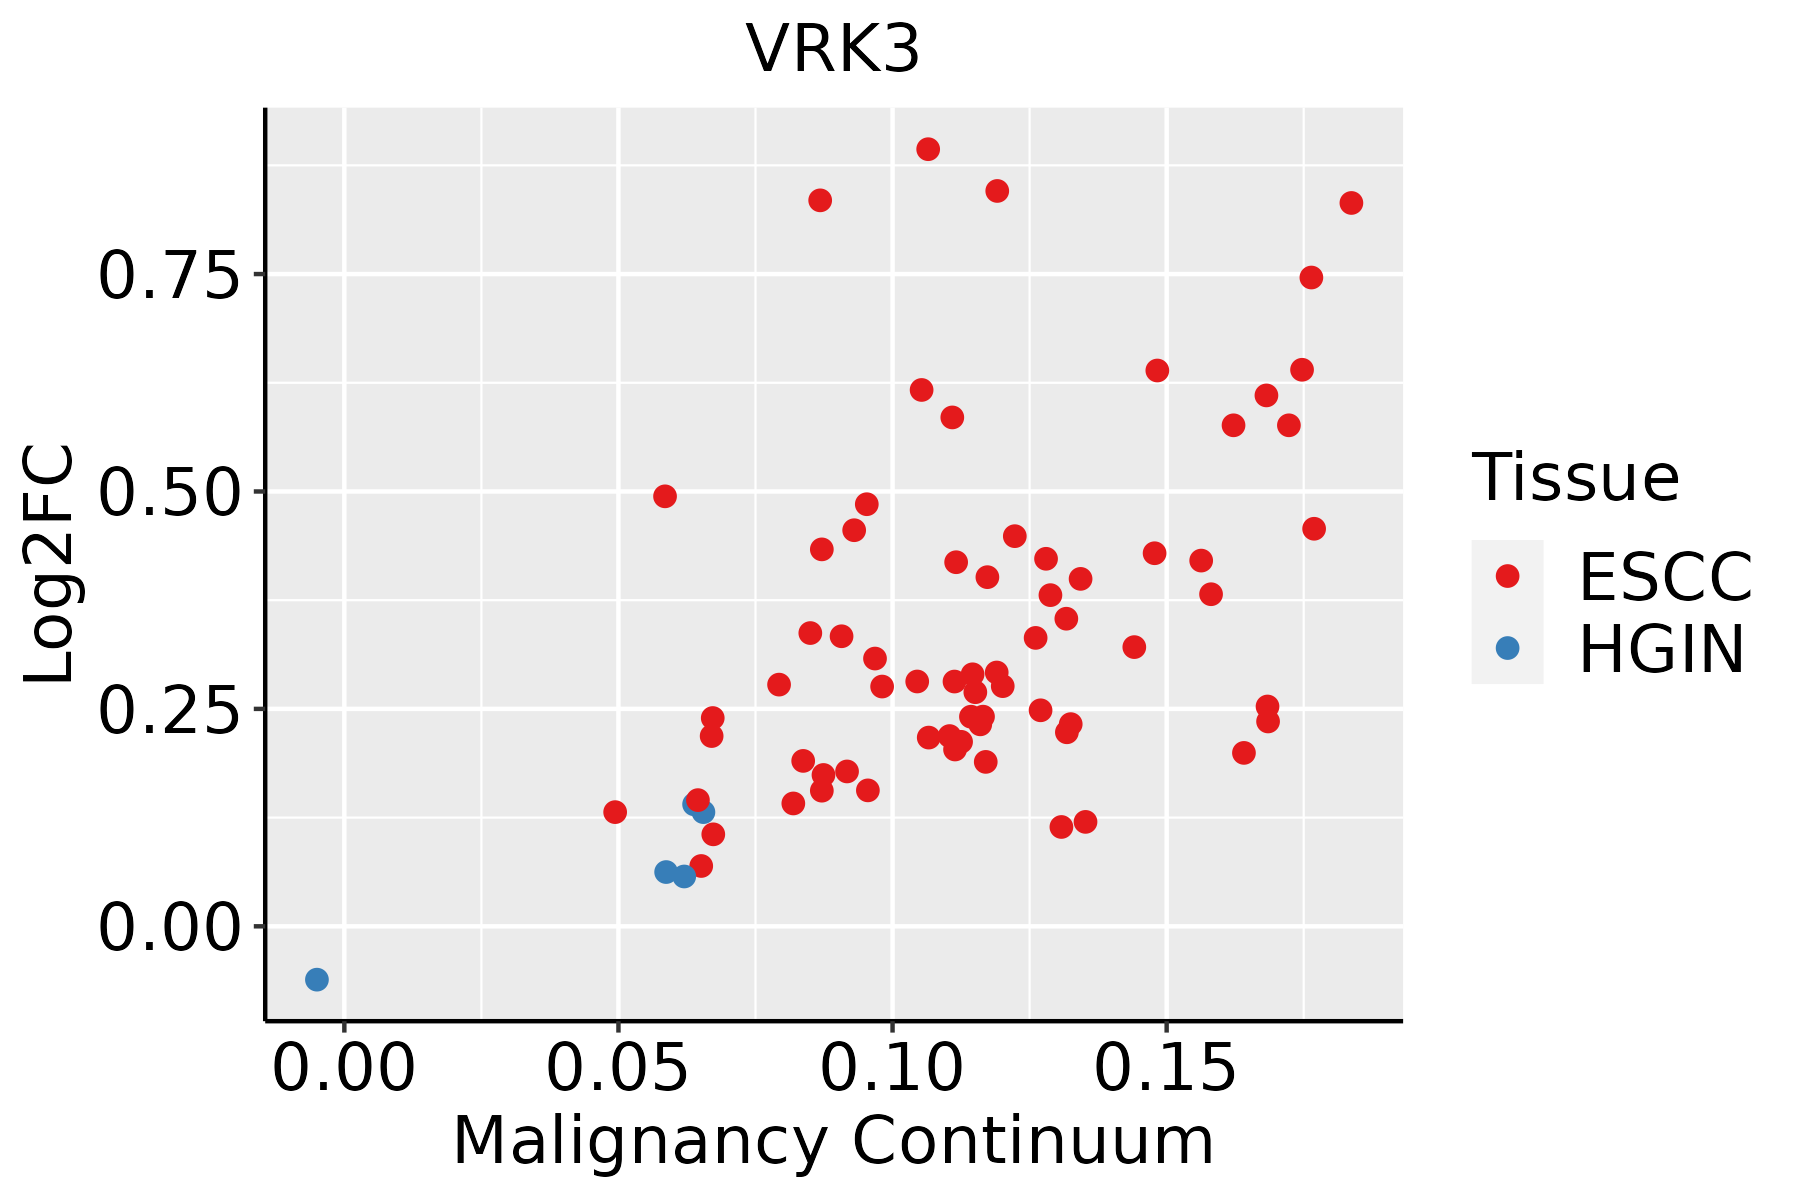 | ESCC: Esophageal squamous cell carcinoma |
| HGIN: High-grade intraepithelial neoplasias |
| LGIN: Low-grade intraepithelial neoplasias |
| Liver |  | HCC: Hepatocellular carcinoma |
| NAFLD: Non-alcoholic fatty liver disease |
| Oral Cavity | 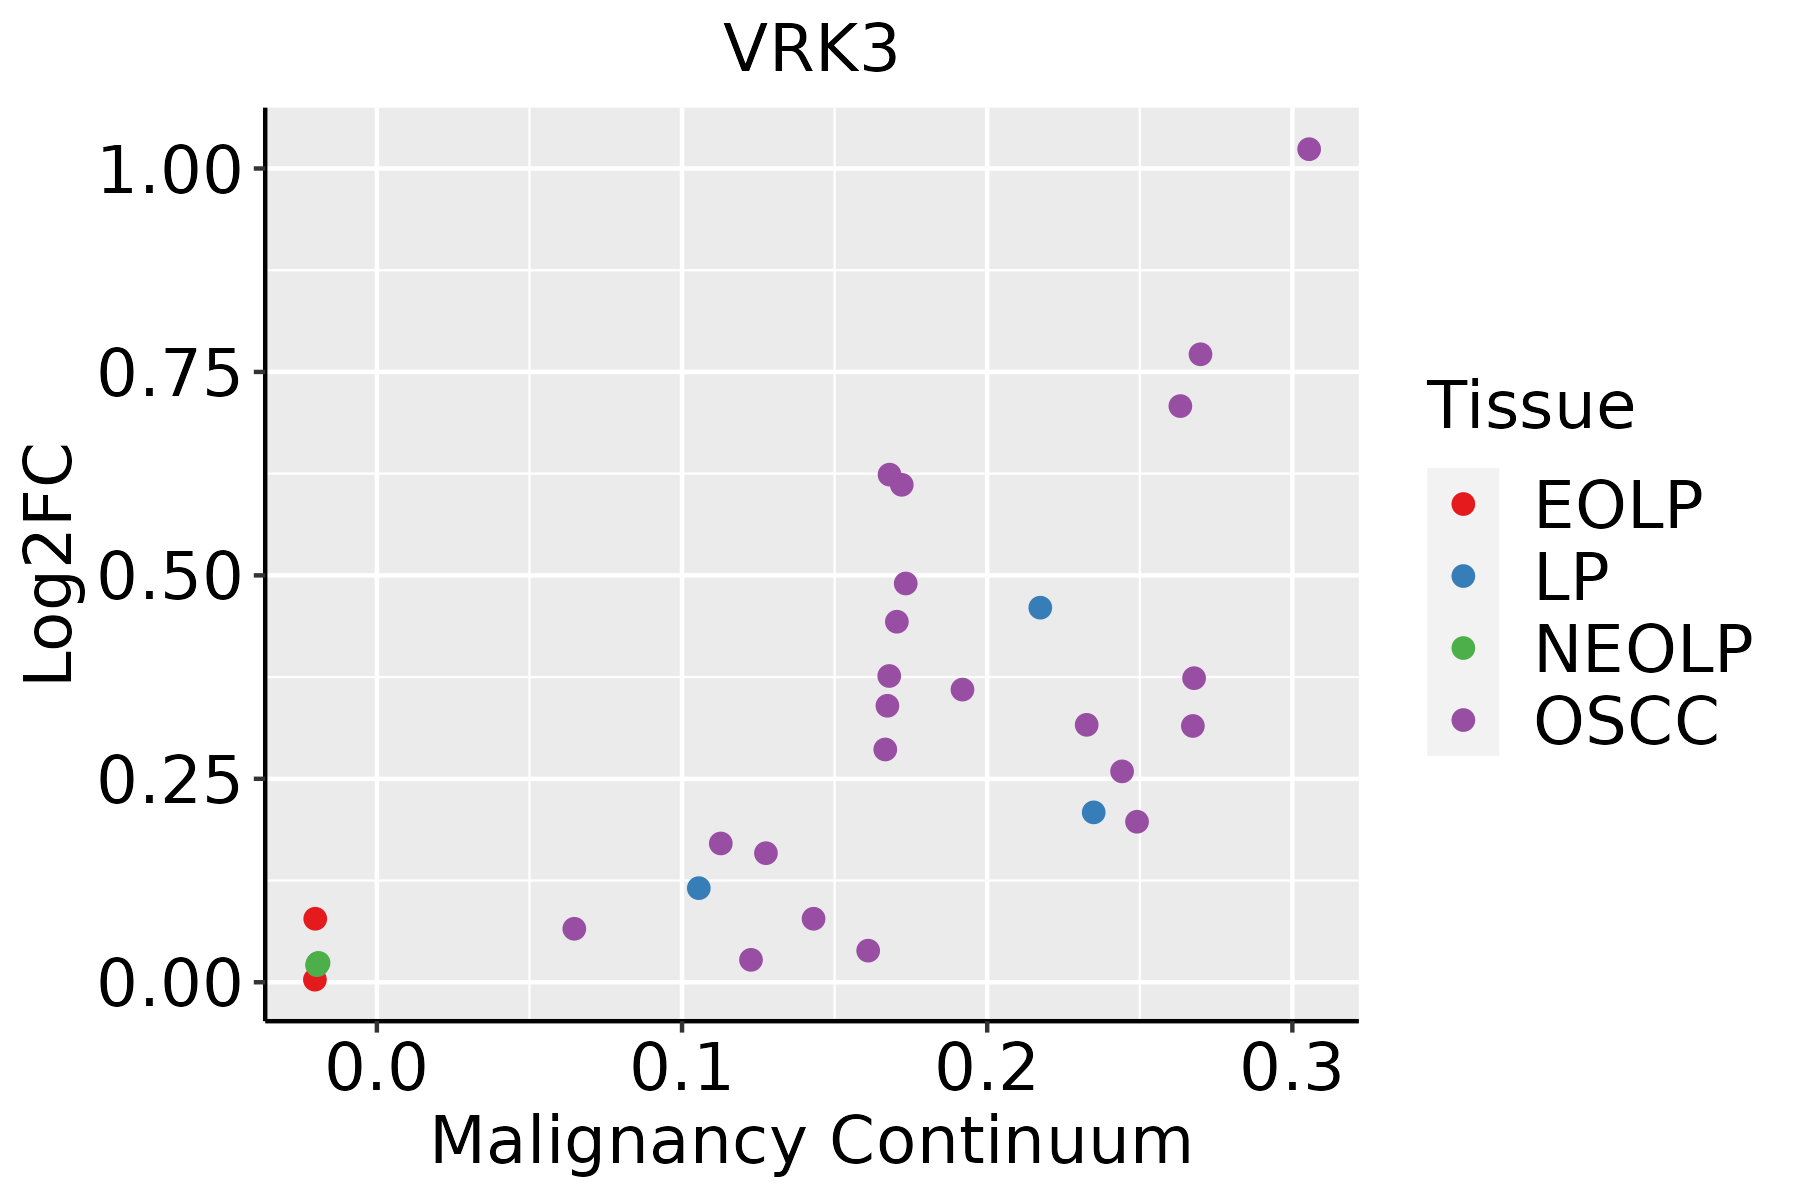 | EOLP: Erosive Oral lichen planus |
| LP: leukoplakia |
| NEOLP: Non-erosive oral lichen planus |
| OSCC: Oral squamous cell carcinoma |
| Thyroid | 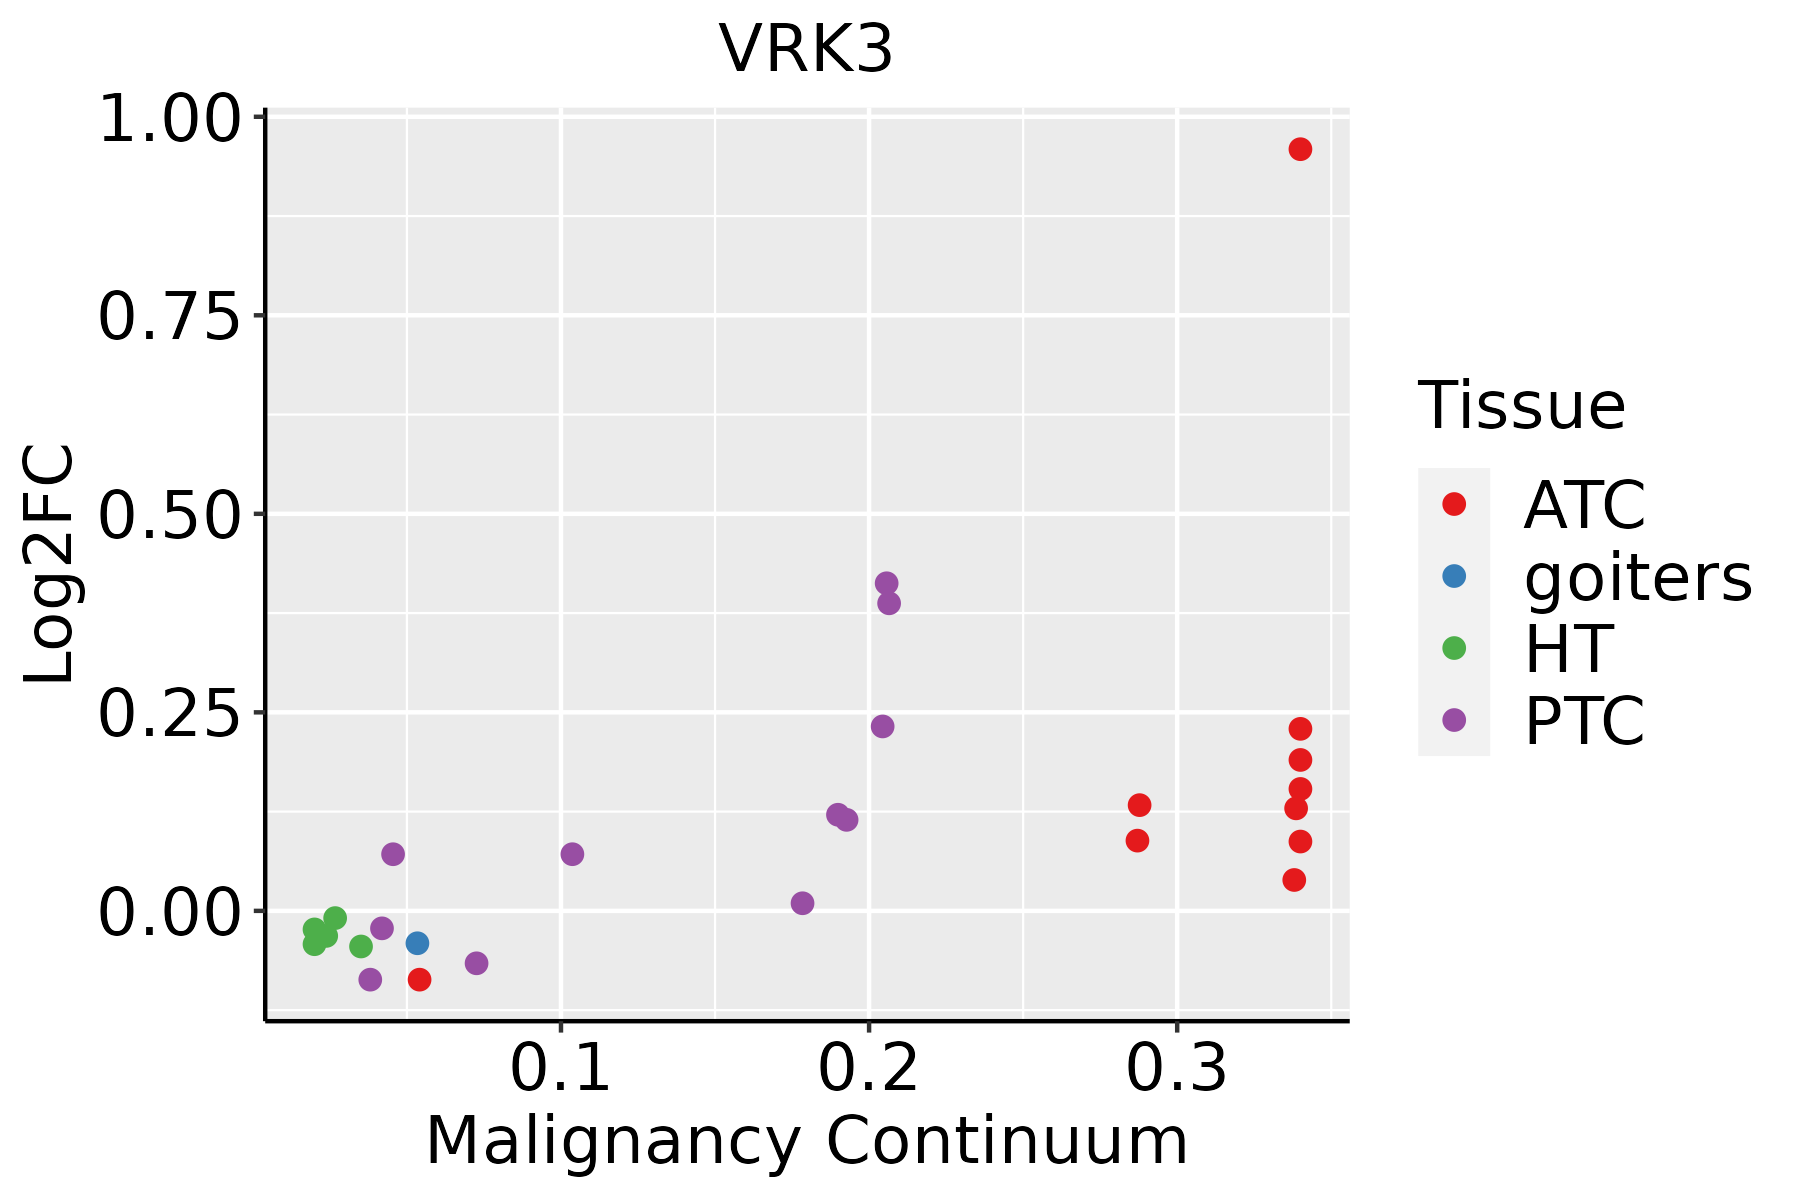 | ATC: Anaplastic thyroid cancer |
| HT: Hashimoto's thyroiditis |
| PTC: Papillary thyroid cancer |
| GO ID | Tissue | Disease Stage | Description | Gene Ratio | Bg Ratio | pvalue | p.adjust | Count |
| GO:0016311 | Colorectum | AD | dephosphorylation | 123/3918 | 417/18723 | 1.84e-05 | 3.82e-04 | 123 |
| GO:0006470 | Colorectum | AD | protein dephosphorylation | 88/3918 | 281/18723 | 2.56e-05 | 4.89e-04 | 88 |
| GO:0035303 | Colorectum | AD | regulation of dephosphorylation | 46/3918 | 128/18723 | 6.20e-05 | 1.04e-03 | 46 |
| GO:0035304 | Colorectum | AD | regulation of protein dephosphorylation | 33/3918 | 90/18723 | 4.23e-04 | 4.77e-03 | 33 |
| GO:0043409 | Colorectum | AD | negative regulation of MAPK cascade | 57/3918 | 180/18723 | 4.61e-04 | 5.14e-03 | 57 |
| GO:0010921 | Colorectum | AD | regulation of phosphatase activity | 30/3918 | 84/18723 | 1.24e-03 | 1.09e-02 | 30 |
| GO:0018105 | Colorectum | AD | peptidyl-serine phosphorylation | 88/3918 | 315/18723 | 1.73e-03 | 1.43e-02 | 88 |
| GO:0010922 | Colorectum | AD | positive regulation of phosphatase activity | 15/3918 | 34/18723 | 1.96e-03 | 1.58e-02 | 15 |
| GO:0035306 | Colorectum | AD | positive regulation of dephosphorylation | 22/3918 | 59/18723 | 2.86e-03 | 2.14e-02 | 22 |
| GO:0018209 | Colorectum | AD | peptidyl-serine modification | 92/3918 | 338/18723 | 3.19e-03 | 2.36e-02 | 92 |
| GO:0043666 | Colorectum | AD | regulation of phosphoprotein phosphatase activity | 21/3918 | 58/18723 | 5.25e-03 | 3.47e-02 | 21 |
| GO:00064701 | Colorectum | SER | protein dephosphorylation | 65/2897 | 281/18723 | 4.44e-04 | 6.51e-03 | 65 |
| GO:00434091 | Colorectum | SER | negative regulation of MAPK cascade | 45/2897 | 180/18723 | 5.81e-04 | 7.98e-03 | 45 |
| GO:00109211 | Colorectum | SER | regulation of phosphatase activity | 24/2897 | 84/18723 | 1.61e-03 | 1.71e-02 | 24 |
| GO:00353031 | Colorectum | SER | regulation of dephosphorylation | 33/2897 | 128/18723 | 1.71e-03 | 1.78e-02 | 33 |
| GO:00353041 | Colorectum | SER | regulation of protein dephosphorylation | 25/2897 | 90/18723 | 2.00e-03 | 1.98e-02 | 25 |
| GO:00436661 | Colorectum | SER | regulation of phosphoprotein phosphatase activity | 18/2897 | 58/18723 | 2.18e-03 | 2.11e-02 | 18 |
| GO:00163111 | Colorectum | SER | dephosphorylation | 86/2897 | 417/18723 | 2.73e-03 | 2.46e-02 | 86 |
| GO:00181051 | Colorectum | SER | peptidyl-serine phosphorylation | 66/2897 | 315/18723 | 5.47e-03 | 4.06e-02 | 66 |
| GO:00353032 | Colorectum | MSS | regulation of dephosphorylation | 41/3467 | 128/18723 | 1.64e-04 | 2.33e-03 | 41 |
| Hugo Symbol | Variant Class | Variant Classification | dbSNP RS | HGVSc | HGVSp | HGVSp Short | SWISSPROT | BIOTYPE | SIFT | PolyPhen | Tumor Sample Barcode | Tissue | Histology | Sex | Age | Stage | Therapy Types | Drugs | Outcome |
| VRK3 | SNV | Missense_Mutation | | c.1378N>A | p.Leu460Met | p.L460M | Q8IV63 | protein_coding | tolerated(0.41) | benign(0.031) | TCGA-A2-A0CW-01 | Breast | breast invasive carcinoma | Female | >=65 | I/II | Hormone Therapy | anastrozole | SD |
| VRK3 | SNV | Missense_Mutation | novel | c.330G>C | p.Gln110His | p.Q110H | Q8IV63 | protein_coding | deleterious(0.01) | benign(0.007) | TCGA-AC-A5XS-01 | Breast | breast invasive carcinoma | Female | >=65 | I/II | Hormone Therapy | femara | SD |
| VRK3 | SNV | Missense_Mutation | | c.926N>G | p.Ala309Gly | p.A309G | Q8IV63 | protein_coding | deleterious(0.01) | probably_damaging(0.913) | TCGA-BH-A1EY-01 | Breast | breast invasive carcinoma | Female | >=65 | I/II | Unknown | Unknown | PD |
| VRK3 | SNV | Missense_Mutation | | c.26G>A | p.Gly9Asp | p.G9D | Q8IV63 | protein_coding | deleterious(0) | probably_damaging(0.998) | TCGA-D8-A1Y1-01 | Breast | breast invasive carcinoma | Female | >=65 | III/IV | Hormone Therapy | tamoxiphen | PD |
| VRK3 | deletion | In_Frame_Del | novel | c.410_430delNNNNNNNNNNNNNNNNNNNNN | p.Pro137_Ser143del | p.P137_S143del | Q8IV63 | protein_coding | | | TCGA-B6-A0IJ-01 | Breast | breast invasive carcinoma | Female | <65 | I/II | Unknown | Unknown | SD |
| VRK3 | insertion | In_Frame_Ins | novel | c.398_399insGTT | p.Thr133_Arg134insPhe | p.T133_R134insF | Q8IV63 | protein_coding | | | TCGA-BH-A0BM-01 | Breast | breast invasive carcinoma | Female | <65 | I/II | Chemotherapy | adriamycin | SD |
| VRK3 | insertion | Frame_Shift_Ins | novel | c.397_398insTGGAGGAGCTGGGATTTGAACCCTGGTCAGCCTGG | p.Thr133MetfsTer20 | p.T133Mfs*20 | Q8IV63 | protein_coding | | | TCGA-BH-A0BM-01 | Breast | breast invasive carcinoma | Female | <65 | I/II | Chemotherapy | adriamycin | SD |
| VRK3 | SNV | Missense_Mutation | novel | c.844N>A | p.Ser282Thr | p.S282T | Q8IV63 | protein_coding | tolerated(0.14) | benign(0.007) | TCGA-2W-A8YY-01 | Cervix | cervical & endocervical cancer | Female | <65 | I/II | Chemotherapy | cisplatin | CR |
| VRK3 | SNV | Missense_Mutation | novel | c.74N>A | p.Ser25Tyr | p.S25Y | Q8IV63 | protein_coding | deleterious(0.04) | possibly_damaging(0.596) | TCGA-2W-A8YY-01 | Cervix | cervical & endocervical cancer | Female | <65 | I/II | Chemotherapy | cisplatin | CR |
| VRK3 | SNV | Missense_Mutation | rs771945391 | c.1106N>C | p.Arg369Pro | p.R369P | Q8IV63 | protein_coding | deleterious(0) | probably_damaging(1) | TCGA-C5-A8YT-01 | Cervix | cervical & endocervical cancer | Female | <65 | I/II | Chemotherapy | cisplatin | PD |


