| Tissue | Expression Dynamics | Abbreviation |
| Cervix | 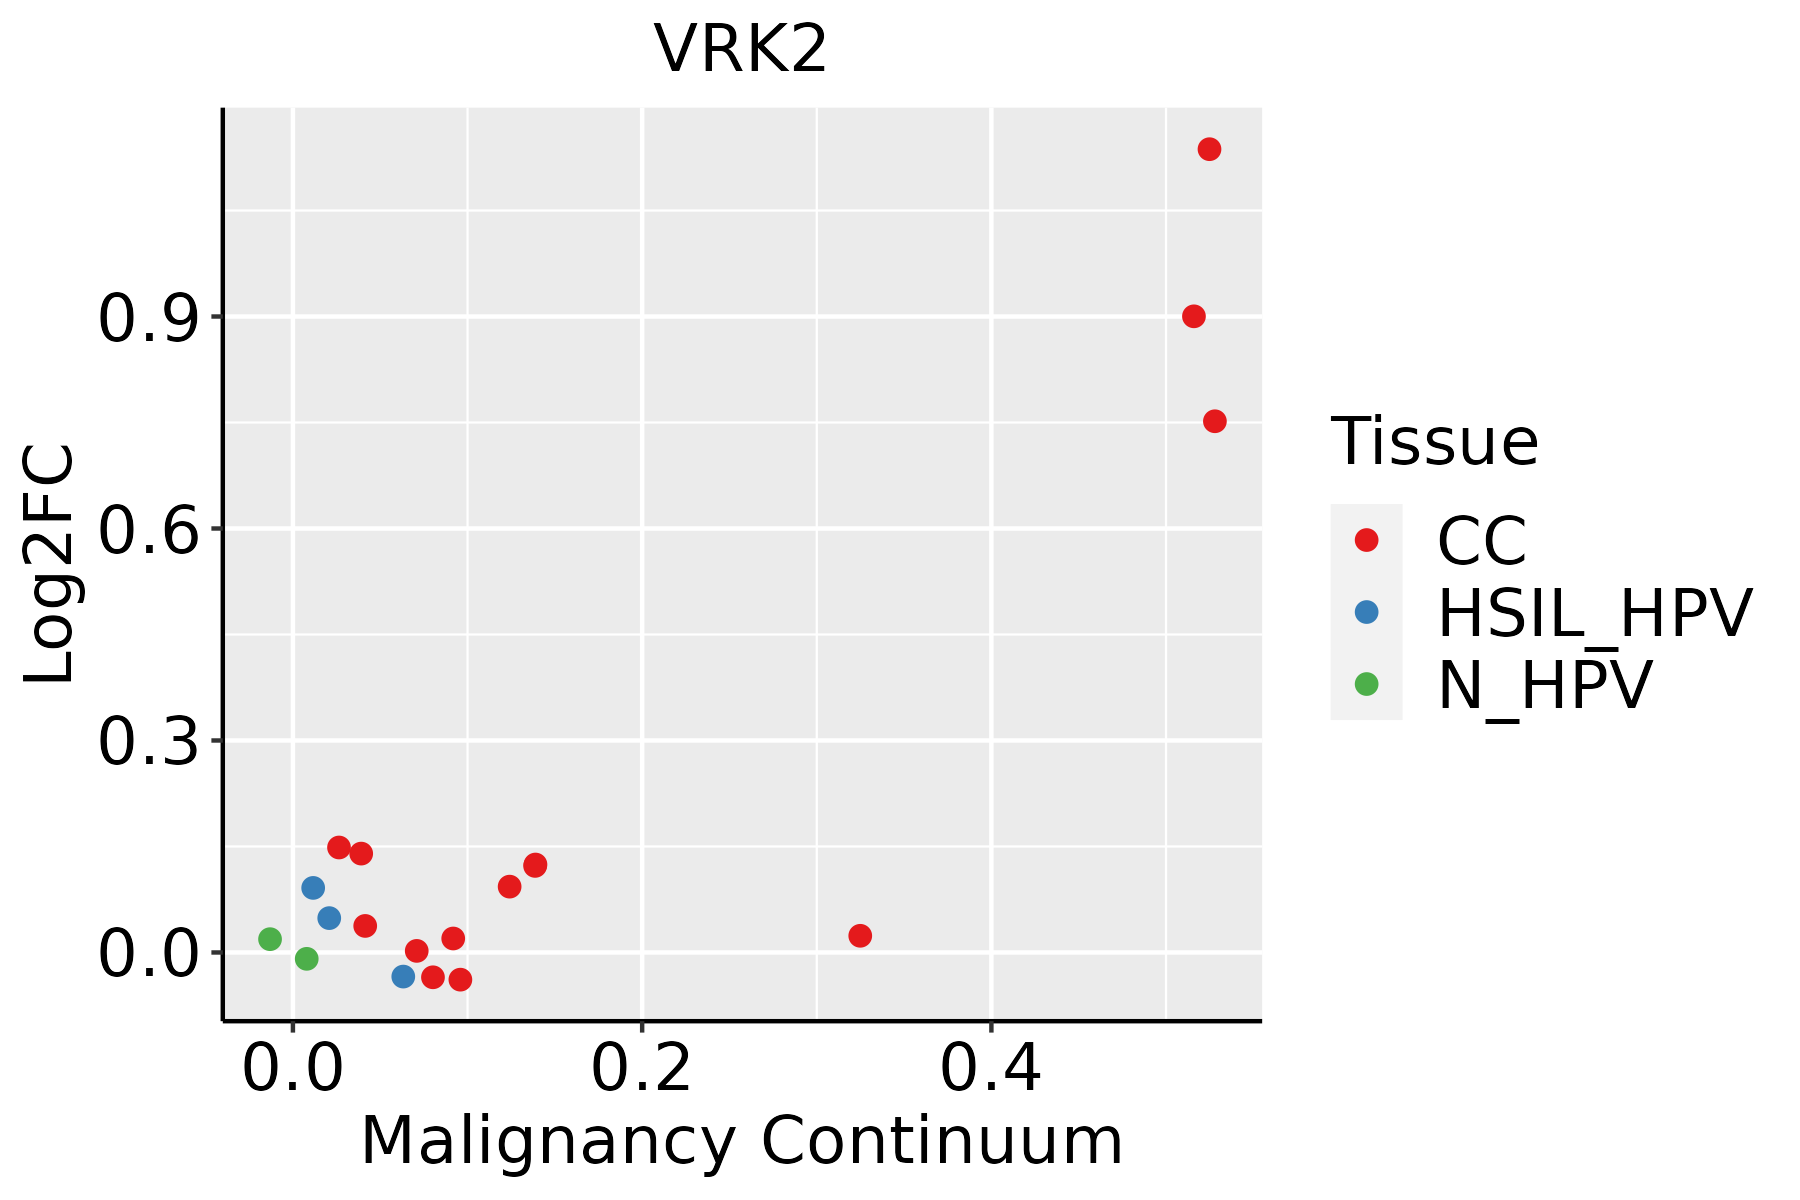 | CC: Cervix cancer |
| HSIL_HPV: HPV-infected high-grade squamous intraepithelial lesions |
| N_HPV: HPV-infected normal cervix |
| Esophagus |  | ESCC: Esophageal squamous cell carcinoma |
| HGIN: High-grade intraepithelial neoplasias |
| LGIN: Low-grade intraepithelial neoplasias |
| Liver | 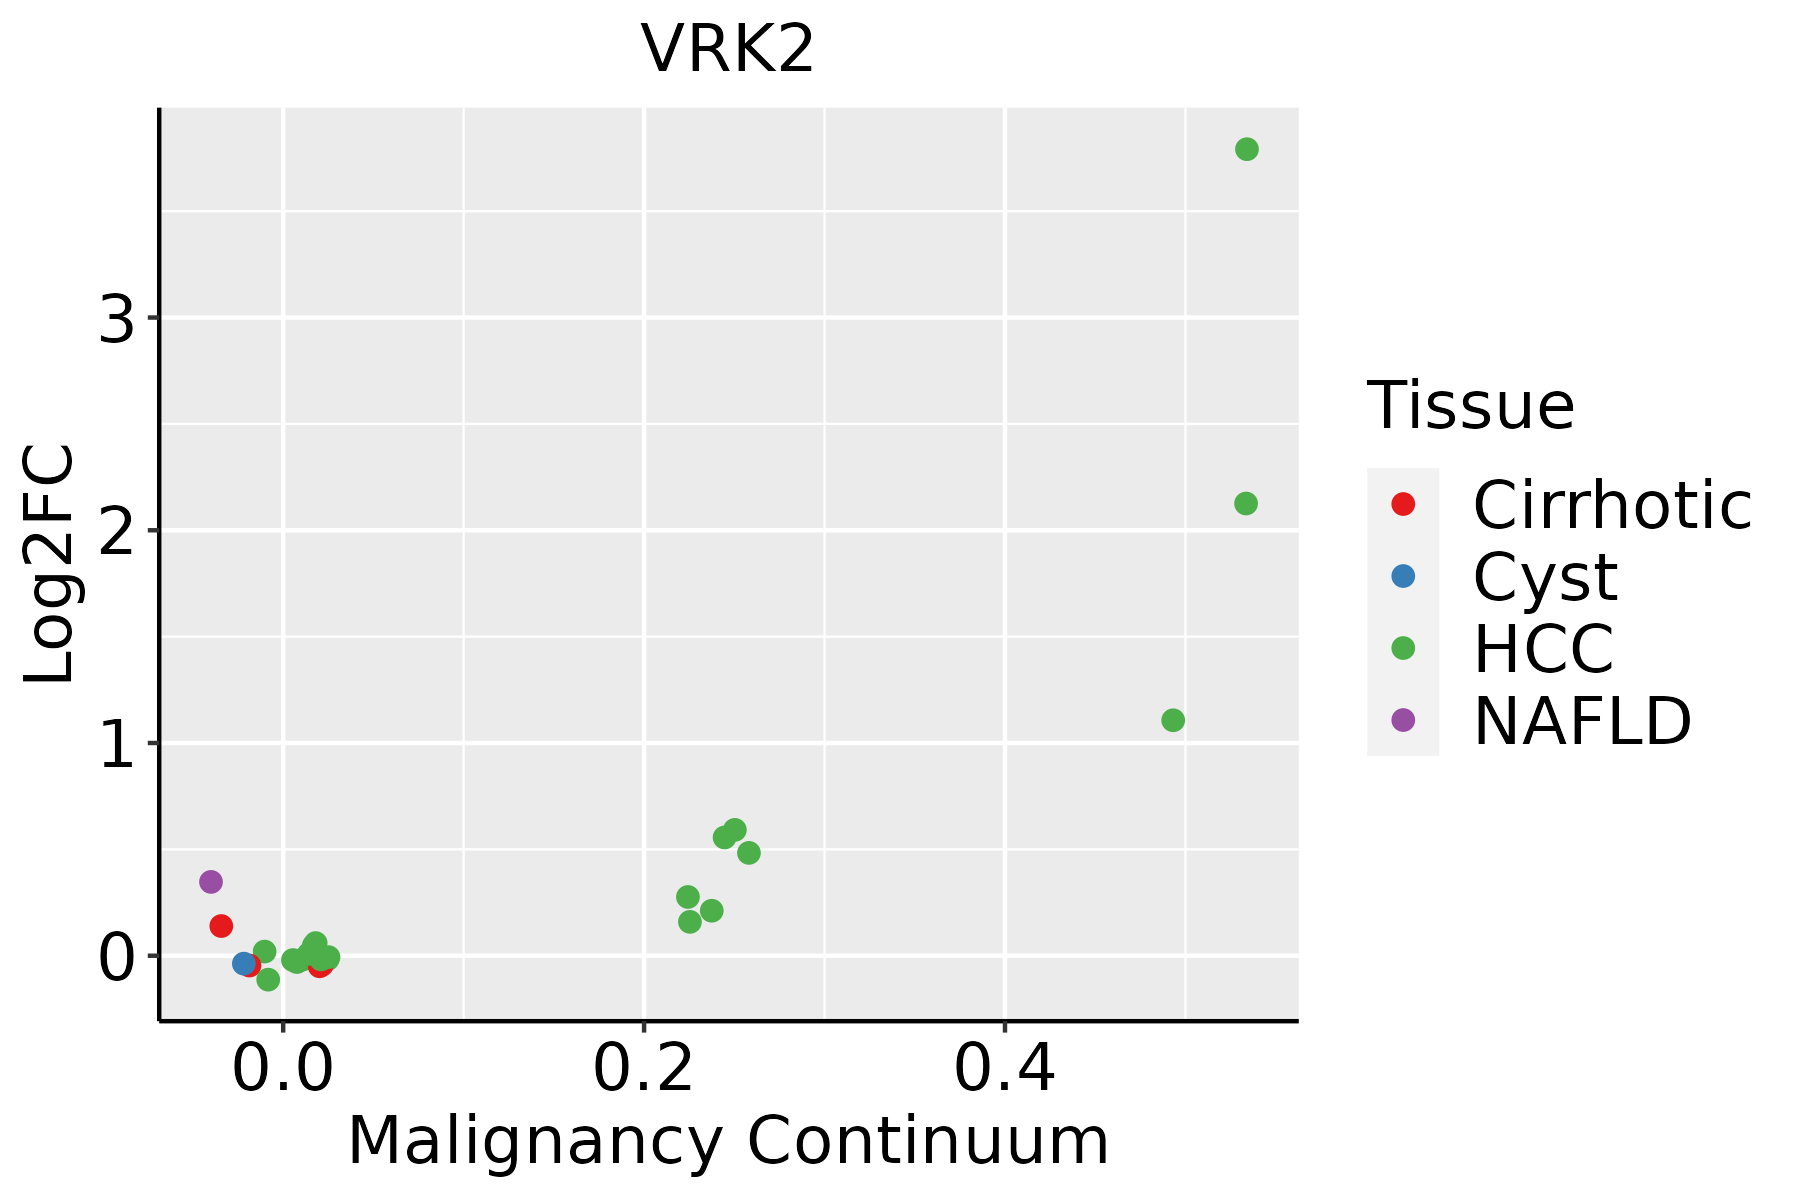 | HCC: Hepatocellular carcinoma |
| NAFLD: Non-alcoholic fatty liver disease |
| Oral Cavity |  | EOLP: Erosive Oral lichen planus |
| LP: leukoplakia |
| NEOLP: Non-erosive oral lichen planus |
| OSCC: Oral squamous cell carcinoma |
| Skin | 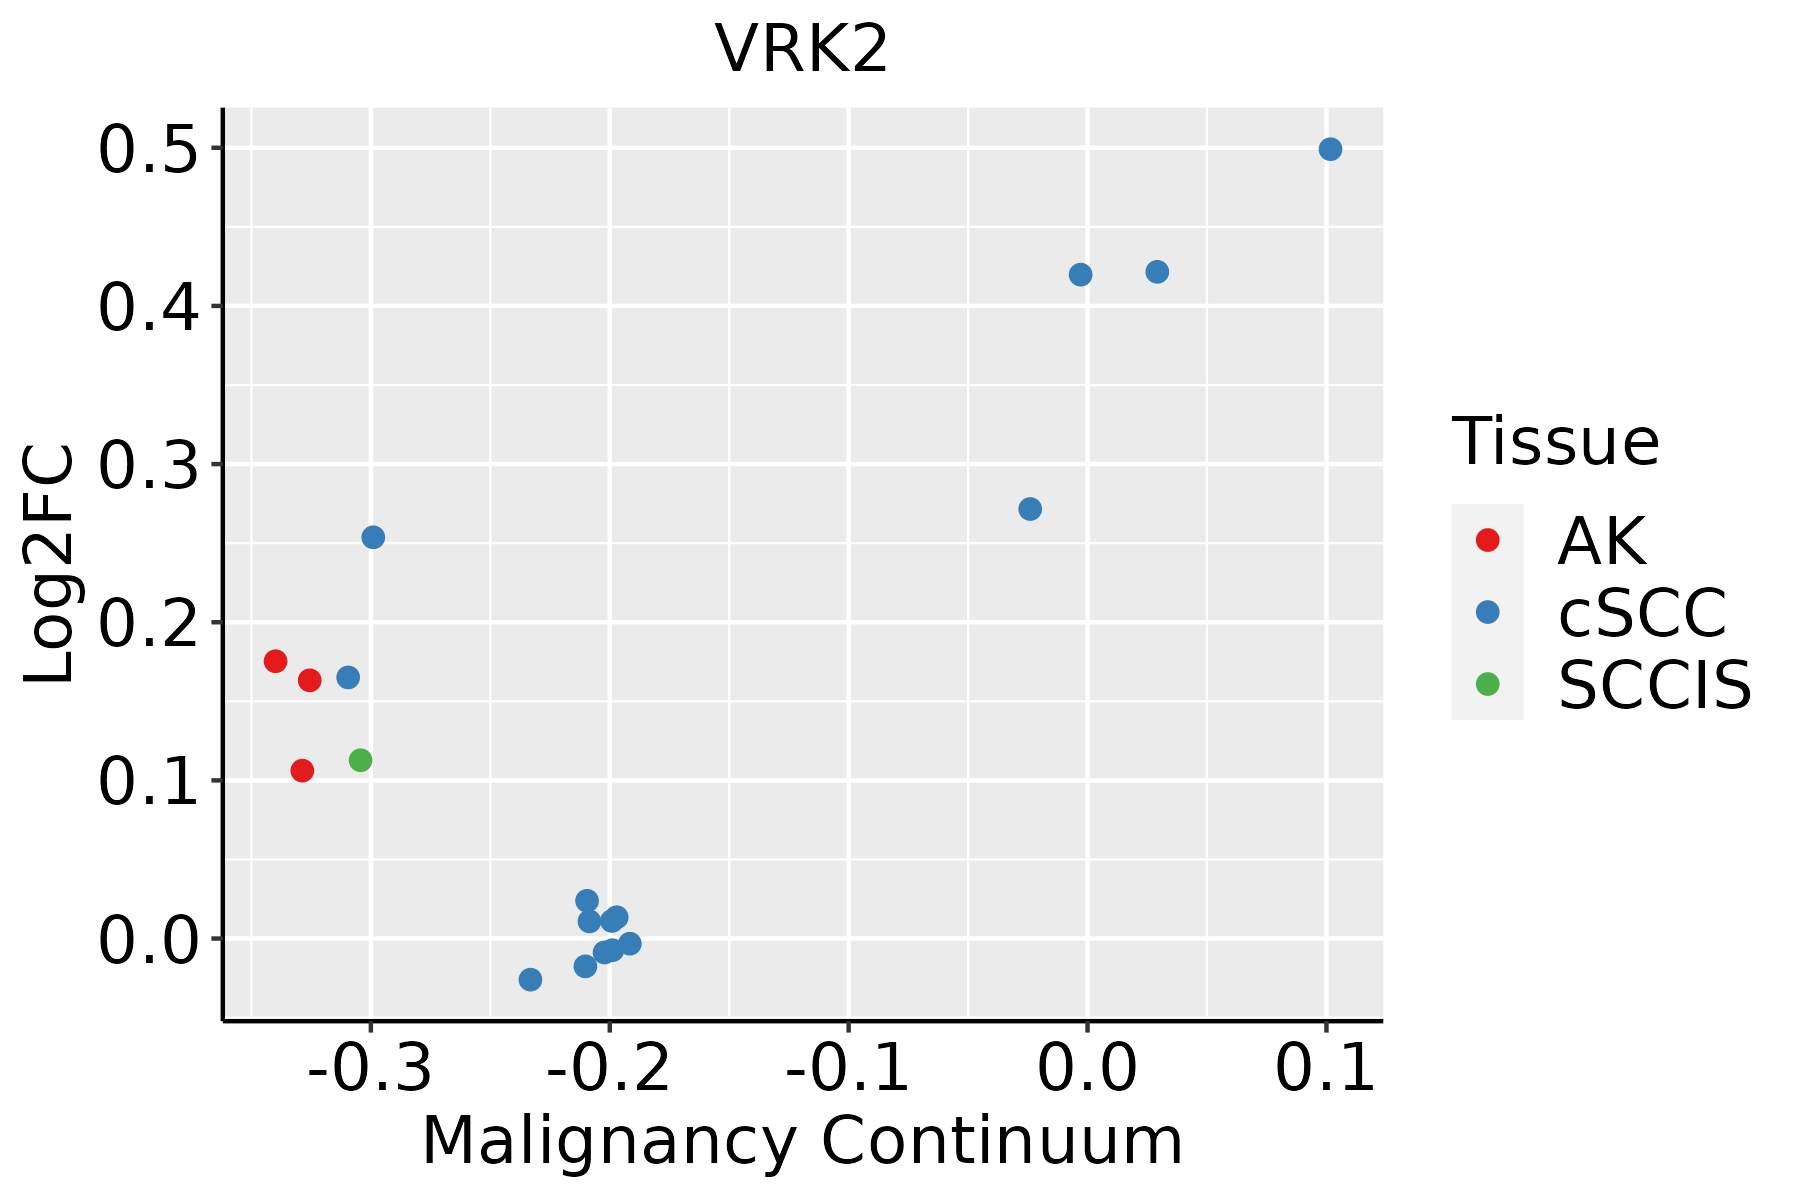 | AK: Actinic keratosis |
| cSCC: Cutaneous squamous cell carcinoma |
| SCCIS:squamous cell carcinoma in situ |
| GO ID | Tissue | Disease Stage | Description | Gene Ratio | Bg Ratio | pvalue | p.adjust | Count |
| GO:000697910 | Cervix | CC | response to oxidative stress | 102/2311 | 446/18723 | 2.99e-10 | 4.36e-08 | 102 |
| GO:006219710 | Cervix | CC | cellular response to chemical stress | 76/2311 | 337/18723 | 1.01e-07 | 5.25e-06 | 76 |
| GO:003459910 | Cervix | CC | cellular response to oxidative stress | 63/2311 | 288/18723 | 3.58e-06 | 9.50e-05 | 63 |
| GO:00181057 | Cervix | CC | peptidyl-serine phosphorylation | 63/2311 | 315/18723 | 6.65e-05 | 9.47e-04 | 63 |
| GO:00182096 | Cervix | CC | peptidyl-serine modification | 66/2311 | 338/18723 | 9.58e-05 | 1.25e-03 | 66 |
| GO:00192213 | Cervix | CC | cytokine-mediated signaling pathway | 84/2311 | 472/18723 | 3.25e-04 | 3.44e-03 | 84 |
| GO:0006979111 | Esophagus | ESCC | response to oxidative stress | 303/8552 | 446/18723 | 7.15e-22 | 1.30e-19 | 303 |
| GO:0062197111 | Esophagus | ESCC | cellular response to chemical stress | 234/8552 | 337/18723 | 5.37e-19 | 5.97e-17 | 234 |
| GO:0034599111 | Esophagus | ESCC | cellular response to oxidative stress | 197/8552 | 288/18723 | 3.76e-15 | 2.15e-13 | 197 |
| GO:004677710 | Esophagus | ESCC | protein autophosphorylation | 138/8552 | 227/18723 | 2.98e-06 | 3.38e-05 | 138 |
| GO:00182099 | Esophagus | ESCC | peptidyl-serine modification | 196/8552 | 338/18723 | 3.07e-06 | 3.47e-05 | 196 |
| GO:00607595 | Esophagus | ESCC | regulation of response to cytokine stimulus | 103/8552 | 162/18723 | 3.14e-06 | 3.53e-05 | 103 |
| GO:001810515 | Esophagus | ESCC | peptidyl-serine phosphorylation | 184/8552 | 315/18723 | 3.22e-06 | 3.61e-05 | 184 |
| GO:00019595 | Esophagus | ESCC | regulation of cytokine-mediated signaling pathway | 95/8552 | 150/18723 | 9.48e-06 | 9.04e-05 | 95 |
| GO:000697922 | Liver | HCC | response to oxidative stress | 281/7958 | 446/18723 | 9.75e-19 | 1.24e-16 | 281 |
| GO:006219722 | Liver | HCC | cellular response to chemical stress | 216/7958 | 337/18723 | 6.86e-16 | 5.44e-14 | 216 |
| GO:003459922 | Liver | HCC | cellular response to oxidative stress | 183/7958 | 288/18723 | 3.65e-13 | 1.93e-11 | 183 |
| GO:001810511 | Liver | HCC | peptidyl-serine phosphorylation | 169/7958 | 315/18723 | 3.86e-05 | 3.81e-04 | 169 |
| GO:001820911 | Liver | HCC | peptidyl-serine modification | 177/7958 | 338/18723 | 1.45e-04 | 1.17e-03 | 177 |
| GO:00467775 | Liver | HCC | protein autophosphorylation | 123/7958 | 227/18723 | 2.40e-04 | 1.80e-03 | 123 |
| Hugo Symbol | Variant Class | Variant Classification | dbSNP RS | HGVSc | HGVSp | HGVSp Short | SWISSPROT | BIOTYPE | SIFT | PolyPhen | Tumor Sample Barcode | Tissue | Histology | Sex | Age | Stage | Therapy Types | Drugs | Outcome |
| VRK2 | SNV | Missense_Mutation | | c.271N>A | p.Glu91Lys | p.E91K | Q86Y07 | protein_coding | tolerated(1) | benign(0) | TCGA-AC-A23H-01 | Breast | breast invasive carcinoma | Female | >=65 | I/II | Unknown | Unknown | PD |
| VRK2 | SNV | Missense_Mutation | | c.556N>C | p.Asp186His | p.D186H | Q86Y07 | protein_coding | deleterious(0) | probably_damaging(1) | TCGA-C8-A12T-01 | Breast | breast invasive carcinoma | Female | <65 | I/II | Unknown | Unknown | SD |
| VRK2 | SNV | Missense_Mutation | novel | c.946C>A | p.His316Asn | p.H316N | Q86Y07 | protein_coding | tolerated(0.11) | benign(0) | TCGA-PE-A5DC-01 | Breast | breast invasive carcinoma | Female | >=65 | III/IV | Unknown | Unknown | SD |
| VRK2 | insertion | Nonsense_Mutation | novel | c.833_834insAATACCCCAAA | p.Trp278Ter | p.W278* | Q86Y07 | protein_coding | | | TCGA-B6-A0IJ-01 | Breast | breast invasive carcinoma | Female | <65 | I/II | Unknown | Unknown | SD |
| VRK2 | insertion | Frame_Shift_Ins | novel | c.834_835insTGTGATGCTTTGGCAT | p.Ala279CysfsTer14 | p.A279Cfs*14 | Q86Y07 | protein_coding | | | TCGA-B6-A0IJ-01 | Breast | breast invasive carcinoma | Female | <65 | I/II | Unknown | Unknown | SD |
| VRK2 | deletion | Frame_Shift_Del | novel | c.614delA | p.Asn205IlefsTer10 | p.N205Ifs*10 | Q86Y07 | protein_coding | | | TCGA-D8-A27V-01 | Breast | breast invasive carcinoma | Female | <65 | I/II | Hormone Therapy | tamoxiphen | SD |
| VRK2 | deletion | Frame_Shift_Del | rs768472226 | c.1089delA | p.Val364SerfsTer21 | p.V364Sfs*21 | Q86Y07 | protein_coding | | | TCGA-D8-A27V-01 | Breast | breast invasive carcinoma | Female | <65 | I/II | Hormone Therapy | tamoxiphen | SD |
| VRK2 | deletion | Frame_Shift_Del | novel | c.621delN | p.Gly209AlafsTer6 | p.G209Afs*6 | Q86Y07 | protein_coding | | | TCGA-EW-A2FV-01 | Breast | breast invasive carcinoma | Female | <65 | III/IV | Chemotherapy | docetaxel | SD |
| VRK2 | SNV | Missense_Mutation | novel | c.608A>G | p.Gln203Arg | p.Q203R | Q86Y07 | protein_coding | tolerated(0.08) | benign(0.019) | TCGA-2W-A8YY-01 | Cervix | cervical & endocervical cancer | Female | <65 | I/II | Chemotherapy | cisplatin | CR |
| VRK2 | SNV | Missense_Mutation | novel | c.808N>A | p.Glu270Lys | p.E270K | Q86Y07 | protein_coding | deleterious(0.02) | benign(0.197) | TCGA-ZJ-AAXU-01 | Cervix | cervical & endocervical cancer | Female | <65 | I/II | Unknown | Unknown | SD |


