
|
|||||
|
 | |
| |
| |
| |
| |
| |
|
Gene: VRK1 |
Gene summary for VRK1 |
| Gene information | Species | Human | Gene symbol | VRK1 | Gene ID | 7443 |
| Gene name | VRK serine/threonine kinase 1 | |
| Gene Alias | PCH1 | |
| Cytomap | 14q32.2 | |
| Gene Type | protein-coding | GO ID | GO:0000278 | UniProtAcc | Q99986 |
Top |
Malignant transformation analysis |
| Identification of the aberrant gene expression in precancerous and cancerous lesions by comparing the gene expression of stem-like cells in diseased tissues with normal stem cells |
| Entrez ID | Symbol | Replicates | Species | Organ | Tissue | Adj P-value | Log2FC | Malignancy |
| 7443 | VRK1 | LZE2T | Human | Esophagus | ESCC | 4.98e-02 | 3.97e-01 | 0.082 |
| 7443 | VRK1 | LZE7T | Human | Esophagus | ESCC | 1.40e-05 | 2.31e-01 | 0.0667 |
| 7443 | VRK1 | LZE24T | Human | Esophagus | ESCC | 4.21e-04 | 1.46e-01 | 0.0596 |
| 7443 | VRK1 | LZE6T | Human | Esophagus | ESCC | 1.54e-02 | 1.86e-01 | 0.0845 |
| 7443 | VRK1 | P2T-E | Human | Esophagus | ESCC | 3.84e-23 | 5.35e-01 | 0.1177 |
| 7443 | VRK1 | P4T-E | Human | Esophagus | ESCC | 2.09e-13 | 4.80e-01 | 0.1323 |
| 7443 | VRK1 | P5T-E | Human | Esophagus | ESCC | 3.18e-21 | 5.30e-01 | 0.1327 |
| 7443 | VRK1 | P8T-E | Human | Esophagus | ESCC | 5.36e-07 | 2.27e-01 | 0.0889 |
| 7443 | VRK1 | P9T-E | Human | Esophagus | ESCC | 2.61e-04 | 1.71e-01 | 0.1131 |
| 7443 | VRK1 | P10T-E | Human | Esophagus | ESCC | 9.72e-25 | 4.72e-01 | 0.116 |
| 7443 | VRK1 | P12T-E | Human | Esophagus | ESCC | 1.90e-17 | 3.51e-01 | 0.1122 |
| 7443 | VRK1 | P15T-E | Human | Esophagus | ESCC | 2.39e-10 | 4.17e-01 | 0.1149 |
| 7443 | VRK1 | P16T-E | Human | Esophagus | ESCC | 2.45e-15 | 3.50e-01 | 0.1153 |
| 7443 | VRK1 | P17T-E | Human | Esophagus | ESCC | 1.27e-04 | 4.52e-01 | 0.1278 |
| 7443 | VRK1 | P20T-E | Human | Esophagus | ESCC | 9.90e-08 | 2.44e-01 | 0.1124 |
| 7443 | VRK1 | P21T-E | Human | Esophagus | ESCC | 1.40e-07 | 2.73e-01 | 0.1617 |
| 7443 | VRK1 | P22T-E | Human | Esophagus | ESCC | 3.77e-07 | 2.35e-01 | 0.1236 |
| 7443 | VRK1 | P23T-E | Human | Esophagus | ESCC | 3.75e-09 | 2.32e-01 | 0.108 |
| 7443 | VRK1 | P24T-E | Human | Esophagus | ESCC | 4.92e-11 | 3.63e-01 | 0.1287 |
| 7443 | VRK1 | P26T-E | Human | Esophagus | ESCC | 2.18e-11 | 3.79e-01 | 0.1276 |
| Page: 1 2 3 4 |
| Tissue | Expression Dynamics | Abbreviation |
| Esophagus | 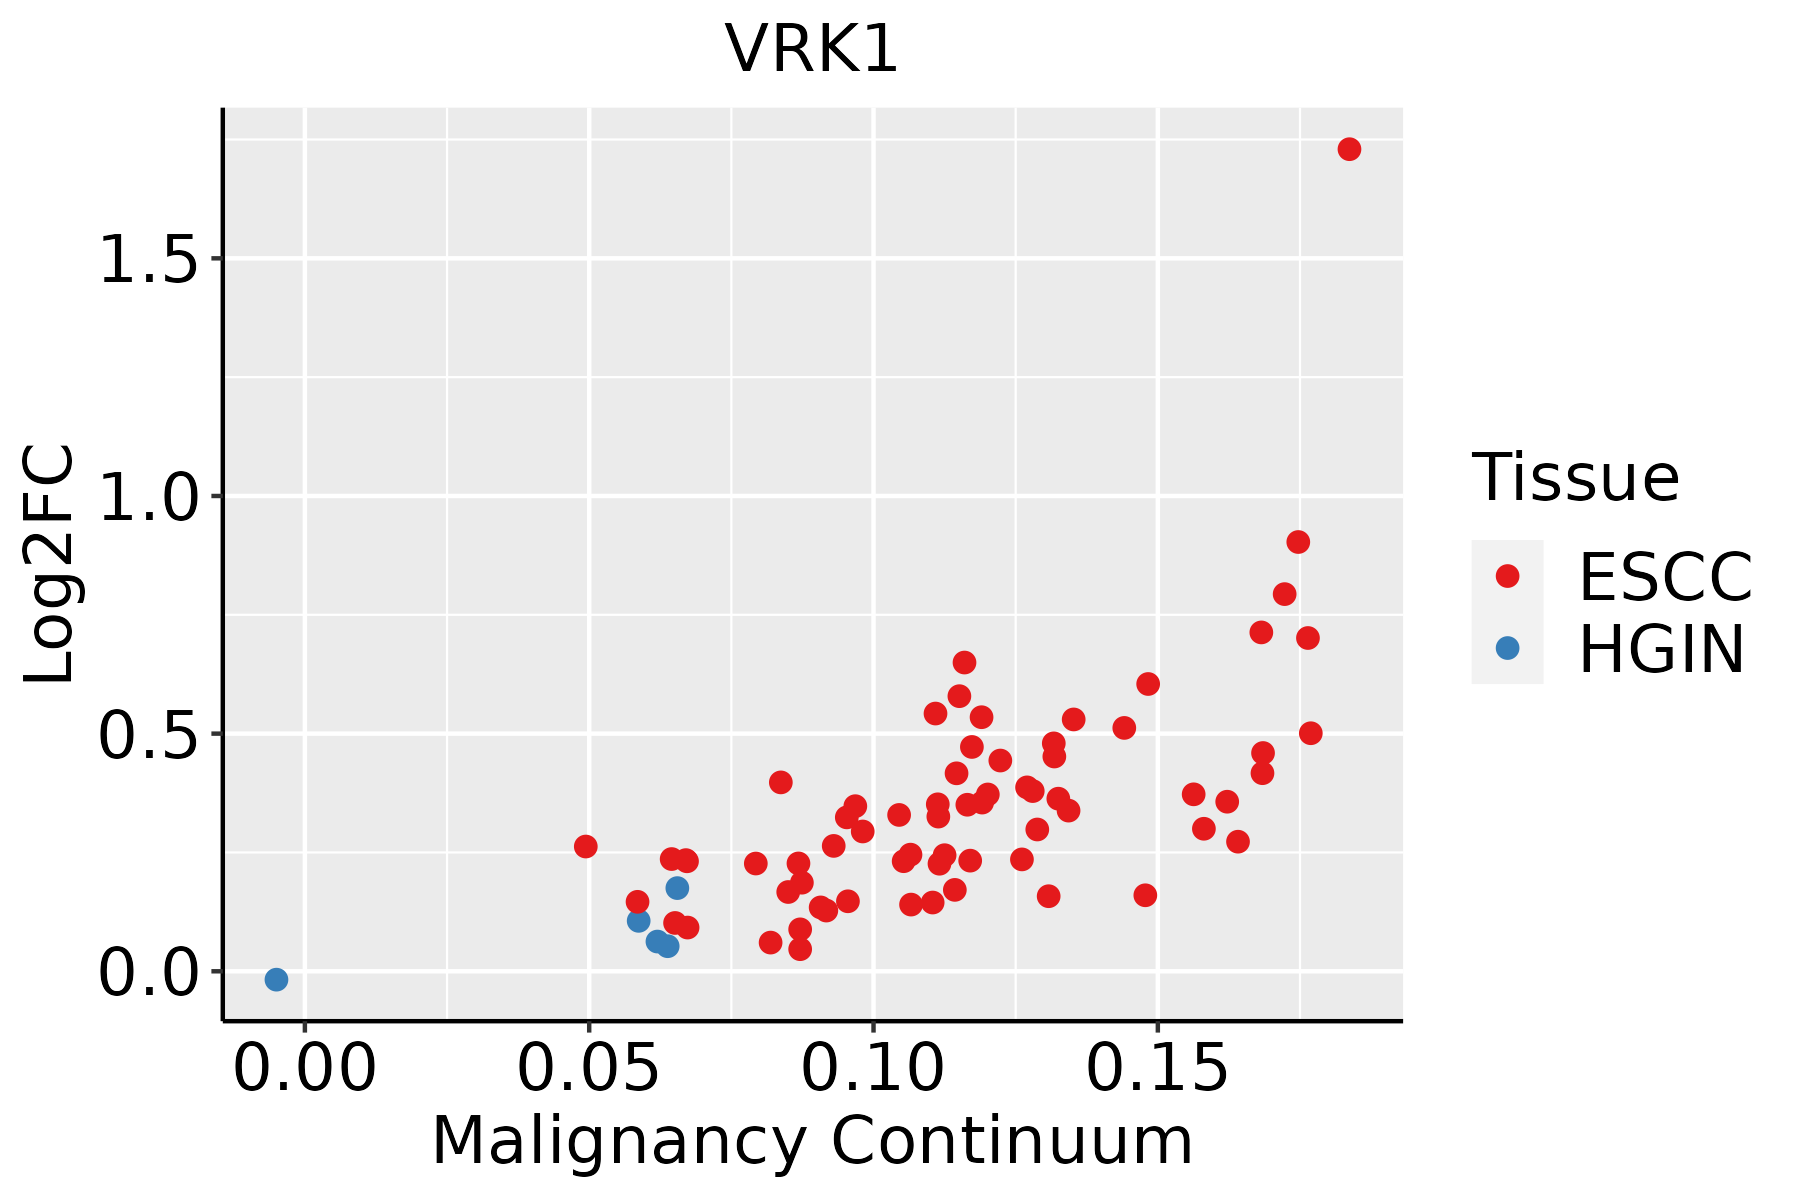 | ESCC: Esophageal squamous cell carcinoma |
| HGIN: High-grade intraepithelial neoplasias | ||
| LGIN: Low-grade intraepithelial neoplasias | ||
| Oral Cavity |  | EOLP: Erosive Oral lichen planus |
| LP: leukoplakia | ||
| NEOLP: Non-erosive oral lichen planus | ||
| OSCC: Oral squamous cell carcinoma | ||
| Skin | 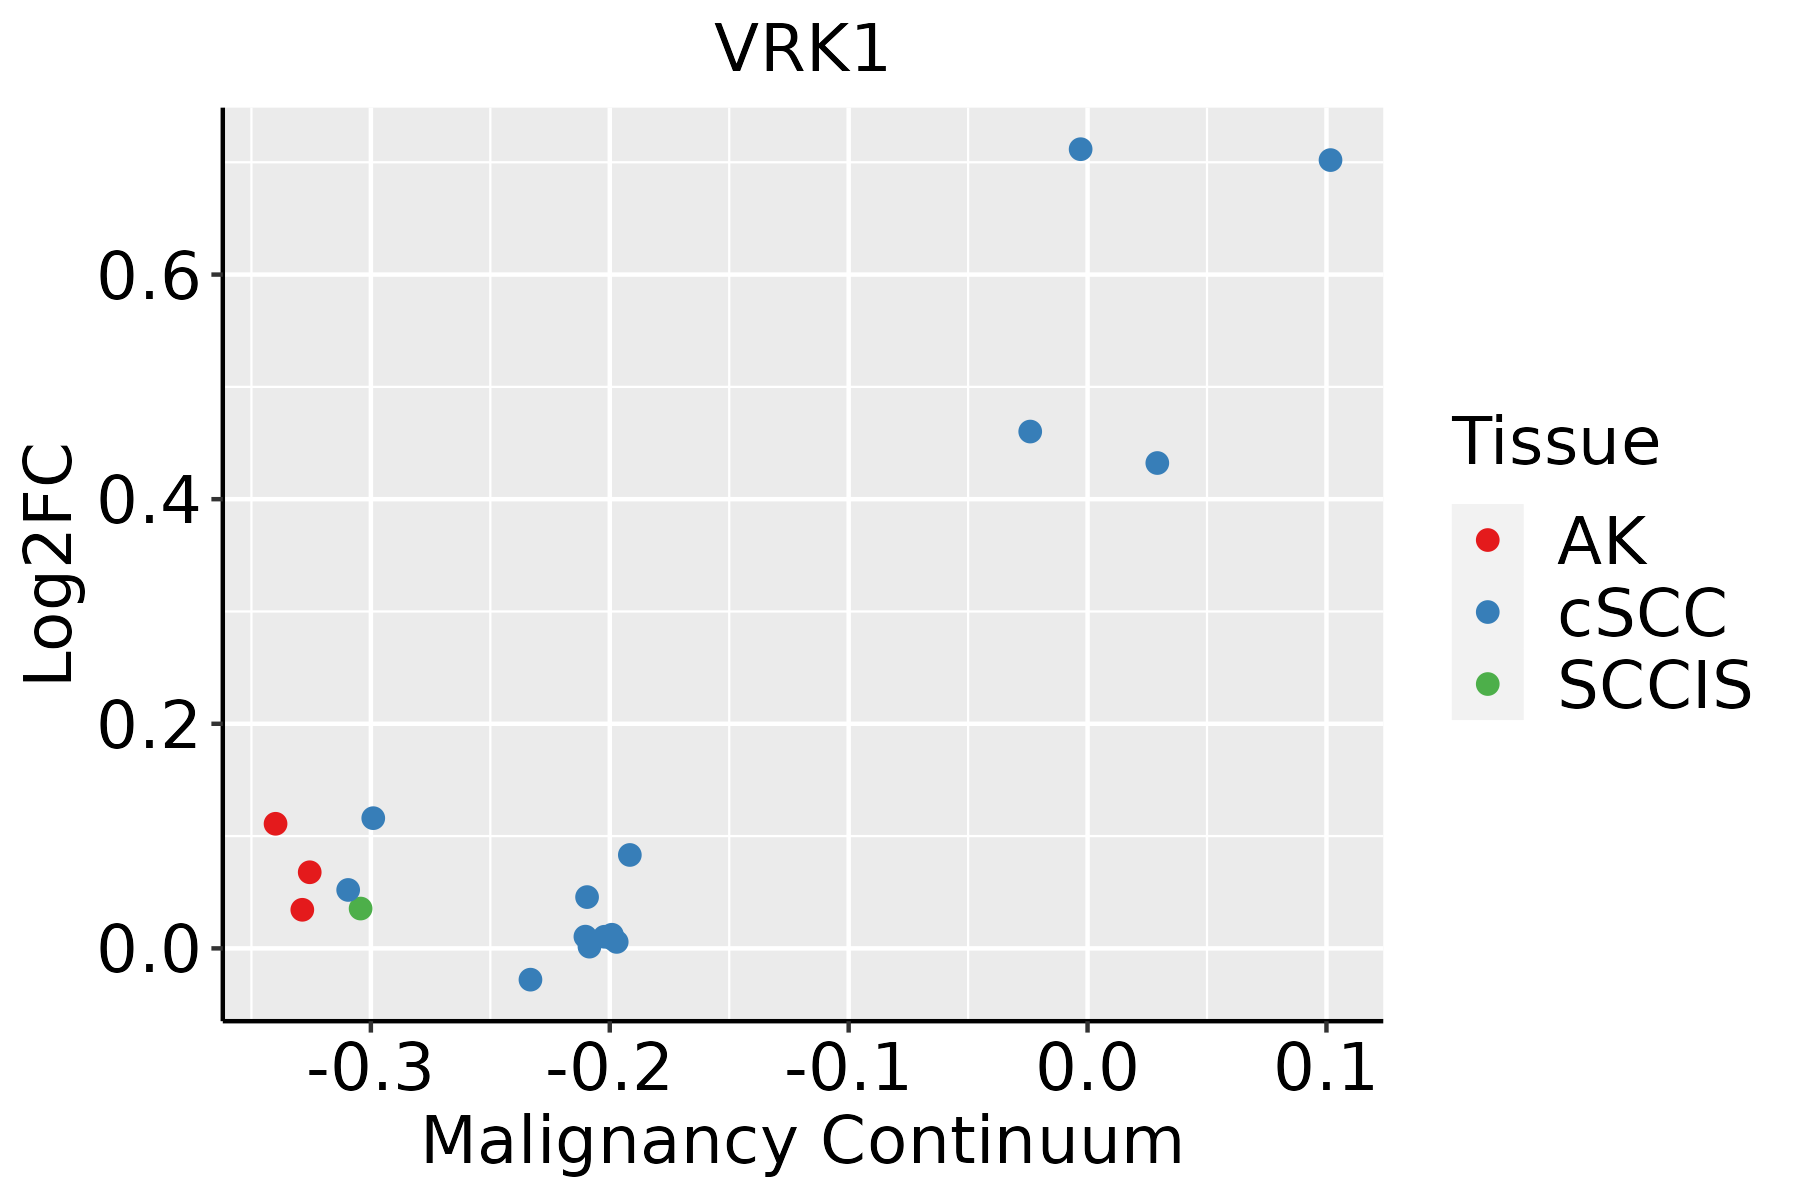 | AK: Actinic keratosis |
| cSCC: Cutaneous squamous cell carcinoma | ||
| SCCIS:squamous cell carcinoma in situ |
| ∗log2FC in expression of this searched gene in stem-like cells from each diseased tissue sample relative to stem-like cells in normal samples in each tissue plotted against the malignancy continuum. Samples are colored based on if they are from different disease stage. |
Top |
Malignant transformation related pathway analysis |
| Find out the enriched GO biological processes and KEGG pathways involved in transition from healthy to precancer to cancer |
| Tissue | Disease Stage | Enriched GO biological Processes |
| Colorectum | AD |  |
| Colorectum | SER |  |
| Colorectum | MSS |  |
| Colorectum | MSI-H |  |
| Colorectum | FAP |  |
| ∗Top 15 enriched GO BP terms are showed in the bar plot of each disease state in each tissue. Each row represents a significant GO biological process which is colored according to the -log10(p.adjust). |
| Page: 1 2 3 4 5 6 7 8 9 |
| GO ID | Tissue | Disease Stage | Description | Gene Ratio | Bg Ratio | pvalue | p.adjust | Count |
| GO:001657015 | Esophagus | ESCC | histone modification | 323/8552 | 463/18723 | 2.61e-26 | 7.88e-24 | 323 |
| GO:0022411111 | Esophagus | ESCC | cellular component disassembly | 305/8552 | 443/18723 | 1.94e-23 | 4.57e-21 | 305 |
| GO:190300816 | Esophagus | ESCC | organelle disassembly | 89/8552 | 114/18723 | 1.36e-12 | 5.80e-11 | 89 |
| GO:000699713 | Esophagus | ESCC | nucleus organization | 96/8552 | 133/18723 | 4.66e-10 | 1.21e-08 | 96 |
| GO:000699811 | Esophagus | ESCC | nuclear envelope organization | 39/8552 | 47/18723 | 1.48e-07 | 2.35e-06 | 39 |
| GO:007176312 | Esophagus | ESCC | nuclear membrane organization | 29/8552 | 33/18723 | 5.30e-07 | 7.04e-06 | 29 |
| GO:00070308 | Esophagus | ESCC | Golgi organization | 101/8552 | 157/18723 | 1.78e-06 | 2.10e-05 | 101 |
| GO:004677710 | Esophagus | ESCC | protein autophosphorylation | 138/8552 | 227/18723 | 2.98e-06 | 3.38e-05 | 138 |
| GO:00182099 | Esophagus | ESCC | peptidyl-serine modification | 196/8552 | 338/18723 | 3.07e-06 | 3.47e-05 | 196 |
| GO:001810515 | Esophagus | ESCC | peptidyl-serine phosphorylation | 184/8552 | 315/18723 | 3.22e-06 | 3.61e-05 | 184 |
| GO:00483083 | Esophagus | ESCC | organelle inheritance | 14/8552 | 15/18723 | 1.47e-04 | 9.85e-04 | 14 |
| GO:00483133 | Esophagus | ESCC | Golgi inheritance | 14/8552 | 15/18723 | 1.47e-04 | 9.85e-04 | 14 |
| GO:00165721 | Esophagus | ESCC | histone phosphorylation | 27/8552 | 39/18723 | 2.52e-03 | 1.08e-02 | 27 |
| GO:001810710 | Esophagus | ESCC | peptidyl-threonine phosphorylation | 66/8552 | 116/18723 | 9.76e-03 | 3.37e-02 | 66 |
| GO:001821010 | Esophagus | ESCC | peptidyl-threonine modification | 70/8552 | 125/18723 | 1.29e-02 | 4.25e-02 | 70 |
| GO:002241119 | Oral cavity | OSCC | cellular component disassembly | 283/7305 | 443/18723 | 9.57e-27 | 3.37e-24 | 283 |
| GO:00165707 | Oral cavity | OSCC | histone modification | 270/7305 | 463/18723 | 1.59e-17 | 1.50e-15 | 270 |
| GO:19030088 | Oral cavity | OSCC | organelle disassembly | 85/7305 | 114/18723 | 1.15e-14 | 6.93e-13 | 85 |
| GO:00069974 | Oral cavity | OSCC | nucleus organization | 85/7305 | 133/18723 | 5.12e-09 | 1.12e-07 | 85 |
| GO:00717633 | Oral cavity | OSCC | nuclear membrane organization | 29/7305 | 33/18723 | 8.40e-09 | 1.76e-07 | 29 |
| Page: 1 2 3 |
| Pathway ID | Tissue | Disease Stage | Description | Gene Ratio | Bg Ratio | pvalue | p.adjust | qvalue | Count |
| Page: 1 |
Top |
Cell-cell communication analysis |
| Identification of potential cell-cell interactions between two cell types and their ligand-receptor pairs for different disease states |
| Ligand | Receptor | LRpair | Pathway | Tissue | Disease Stage |
| Page: 1 |
Top |
Single-cell gene regulatory network inference analysis |
| Find out the significant the regulons (TFs) and the target genes of each regulon across cell types for different disease states |
| TF | Cell Type | Tissue | Disease Stage | Target Gene | RSS | Regulon Activity |
| ∗The dot plots of a searched regulon are shown for all cell subpopulations in each disease state of each tissue based on the regulon specific score inferred using pySCENIC and by calculating the average expression. |
| Page: 1 |
Top |
Somatic mutation of malignant transformation related genes |
| Annotation of somatic variants for genes involved in malignant transformation |
| Hugo Symbol | Variant Class | Variant Classification | dbSNP RS | HGVSc | HGVSp | HGVSp Short | SWISSPROT | BIOTYPE | SIFT | PolyPhen | Tumor Sample Barcode | Tissue | Histology | Sex | Age | Stage | Therapy Types | Drugs | Outcome |
| VRK1 | SNV | Missense_Mutation | c.25N>A | p.Ala9Thr | p.A9T | Q99986 | protein_coding | tolerated(0.08) | benign(0.039) | TCGA-AR-A24N-01 | Breast | breast invasive carcinoma | Female | <65 | I/II | Unknown | Unknown | SD | |
| VRK1 | SNV | Missense_Mutation | novel | c.280G>A | p.Glu94Lys | p.E94K | Q99986 | protein_coding | deleterious(0) | possibly_damaging(0.665) | TCGA-DS-A1OB-01 | Cervix | cervical & endocervical cancer | Female | <65 | I/II | Chemotherapy | carboplatin | PD |
| VRK1 | SNV | Missense_Mutation | novel | c.547C>T | p.Leu183Phe | p.L183F | Q99986 | protein_coding | deleterious(0) | probably_damaging(0.992) | TCGA-DS-A1OB-01 | Cervix | cervical & endocervical cancer | Female | <65 | I/II | Chemotherapy | carboplatin | PD |
| VRK1 | SNV | Missense_Mutation | rs757917768 | c.692A>G | p.Asp231Gly | p.D231G | Q99986 | protein_coding | deleterious(0) | probably_damaging(0.994) | TCGA-AA-3492-01 | Colorectum | colon adenocarcinoma | Female | >=65 | I/II | Unknown | Unknown | SD |
| VRK1 | SNV | Missense_Mutation | rs200927943 | c.962G>A | p.Arg321His | p.R321H | Q99986 | protein_coding | deleterious(0.02) | possibly_damaging(0.724) | TCGA-AA-3710-01 | Colorectum | colon adenocarcinoma | Female | >=65 | I/II | Unknown | Unknown | SD |
| VRK1 | SNV | Missense_Mutation | rs868247202 | c.97N>A | p.Ala33Thr | p.A33T | Q99986 | protein_coding | tolerated(0.34) | benign(0) | TCGA-AA-3864-01 | Colorectum | colon adenocarcinoma | Male | >=65 | I/II | Unknown | Unknown | SD |
| VRK1 | SNV | Missense_Mutation | c.664N>A | p.Asp222Asn | p.D222N | Q99986 | protein_coding | tolerated(1) | benign(0.275) | TCGA-AA-3984-01 | Colorectum | colon adenocarcinoma | Female | <65 | I/II | Unknown | Unknown | SD | |
| VRK1 | SNV | Missense_Mutation | c.631N>C | p.Lys211Gln | p.K211Q | Q99986 | protein_coding | deleterious(0) | possibly_damaging(0.715) | TCGA-CA-6718-01 | Colorectum | colon adenocarcinoma | Male | <65 | I/II | Unknown | Unknown | PD | |
| VRK1 | SNV | Missense_Mutation | c.569N>A | p.Pro190His | p.P190H | Q99986 | protein_coding | deleterious(0) | probably_damaging(0.984) | TCGA-DM-A1HB-01 | Colorectum | colon adenocarcinoma | Male | >=65 | III/IV | Unknown | Unknown | SD | |
| VRK1 | SNV | Missense_Mutation | c.817G>T | p.Asp273Tyr | p.D273Y | Q99986 | protein_coding | deleterious(0.01) | possibly_damaging(0.749) | TCGA-AG-A002-01 | Colorectum | rectum adenocarcinoma | Male | <65 | I/II | Unknown | Unknown | SD |
| Page: 1 2 3 4 5 |
Top |
Related drugs of malignant transformation related genes |
| Identification of chemicals and drugs interact with genes involved in malignant transfromation |
| (DGIdb 4.0) |
| Entrez ID | Symbol | Category | Interaction Types | Drug Claim Name | Drug Name | PMIDs |
| Page: 1 |

Copyright 2023-Present -The University of Texas Health Science Center at Houston |