
|
|||||
|
 | |
| |
| |
| |
| |
| |
|
Gene: VPS8 |
Gene summary for VPS8 |
| Gene information | Species | Human | Gene symbol | VPS8 | Gene ID | 23355 |
| Gene name | VPS8 subunit of CORVET complex | |
| Gene Alias | KIAA0804 | |
| Cytomap | 3q27.2 | |
| Gene Type | protein-coding | GO ID | GO:0006810 | UniProtAcc | B3KPR6 |
Top |
Malignant transformation analysis |
| Identification of the aberrant gene expression in precancerous and cancerous lesions by comparing the gene expression of stem-like cells in diseased tissues with normal stem cells |
| Entrez ID | Symbol | Replicates | Species | Organ | Tissue | Adj P-value | Log2FC | Malignancy |
| 23355 | VPS8 | CCI_1 | Human | Cervix | CC | 1.21e-06 | 5.75e-01 | 0.528 |
| 23355 | VPS8 | CCI_2 | Human | Cervix | CC | 4.44e-10 | 1.05e+00 | 0.5249 |
| 23355 | VPS8 | CCI_3 | Human | Cervix | CC | 1.32e-18 | 1.01e+00 | 0.516 |
| 23355 | VPS8 | sample3 | Human | Cervix | CC | 3.46e-03 | 1.23e-01 | 0.1387 |
| 23355 | VPS8 | T3 | Human | Cervix | CC | 1.19e-02 | 9.42e-02 | 0.1389 |
| 23355 | VPS8 | HTA11_3410_2000001011 | Human | Colorectum | AD | 9.43e-20 | -5.29e-01 | 0.0155 |
| 23355 | VPS8 | HTA11_2487_2000001011 | Human | Colorectum | SER | 1.32e-02 | -4.16e-01 | -0.1808 |
| 23355 | VPS8 | HTA11_3361_2000001011 | Human | Colorectum | AD | 5.89e-05 | -4.93e-01 | -0.1207 |
| 23355 | VPS8 | HTA11_5212_2000001011 | Human | Colorectum | AD | 3.02e-03 | -5.91e-01 | -0.2061 |
| 23355 | VPS8 | HTA11_5216_2000001011 | Human | Colorectum | SER | 2.31e-02 | -6.12e-01 | -0.1462 |
| 23355 | VPS8 | HTA11_866_3004761011 | Human | Colorectum | AD | 1.44e-17 | -5.89e-01 | 0.096 |
| 23355 | VPS8 | HTA11_8622_2000001021 | Human | Colorectum | SER | 1.11e-02 | -5.66e-01 | 0.0528 |
| 23355 | VPS8 | HTA11_10711_2000001011 | Human | Colorectum | AD | 6.53e-07 | -5.55e-01 | 0.0338 |
| 23355 | VPS8 | HTA11_7696_3000711011 | Human | Colorectum | AD | 1.14e-14 | -5.38e-01 | 0.0674 |
| 23355 | VPS8 | HTA11_6818_2000001011 | Human | Colorectum | AD | 1.13e-02 | -5.66e-01 | 0.0112 |
| 23355 | VPS8 | HTA11_99999970781_79442 | Human | Colorectum | MSS | 1.60e-10 | -4.68e-01 | 0.294 |
| 23355 | VPS8 | HTA11_99999971662_82457 | Human | Colorectum | MSS | 2.36e-04 | -3.66e-01 | 0.3859 |
| 23355 | VPS8 | HTA11_99999973899_84307 | Human | Colorectum | MSS | 8.60e-08 | -6.51e-01 | 0.2585 |
| 23355 | VPS8 | HTA11_99999974143_84620 | Human | Colorectum | MSS | 3.76e-25 | -6.95e-01 | 0.3005 |
| 23355 | VPS8 | F007 | Human | Colorectum | FAP | 2.44e-02 | -1.91e-01 | 0.1176 |
| Page: 1 2 3 4 5 6 7 |
| Tissue | Expression Dynamics | Abbreviation |
| Cervix | 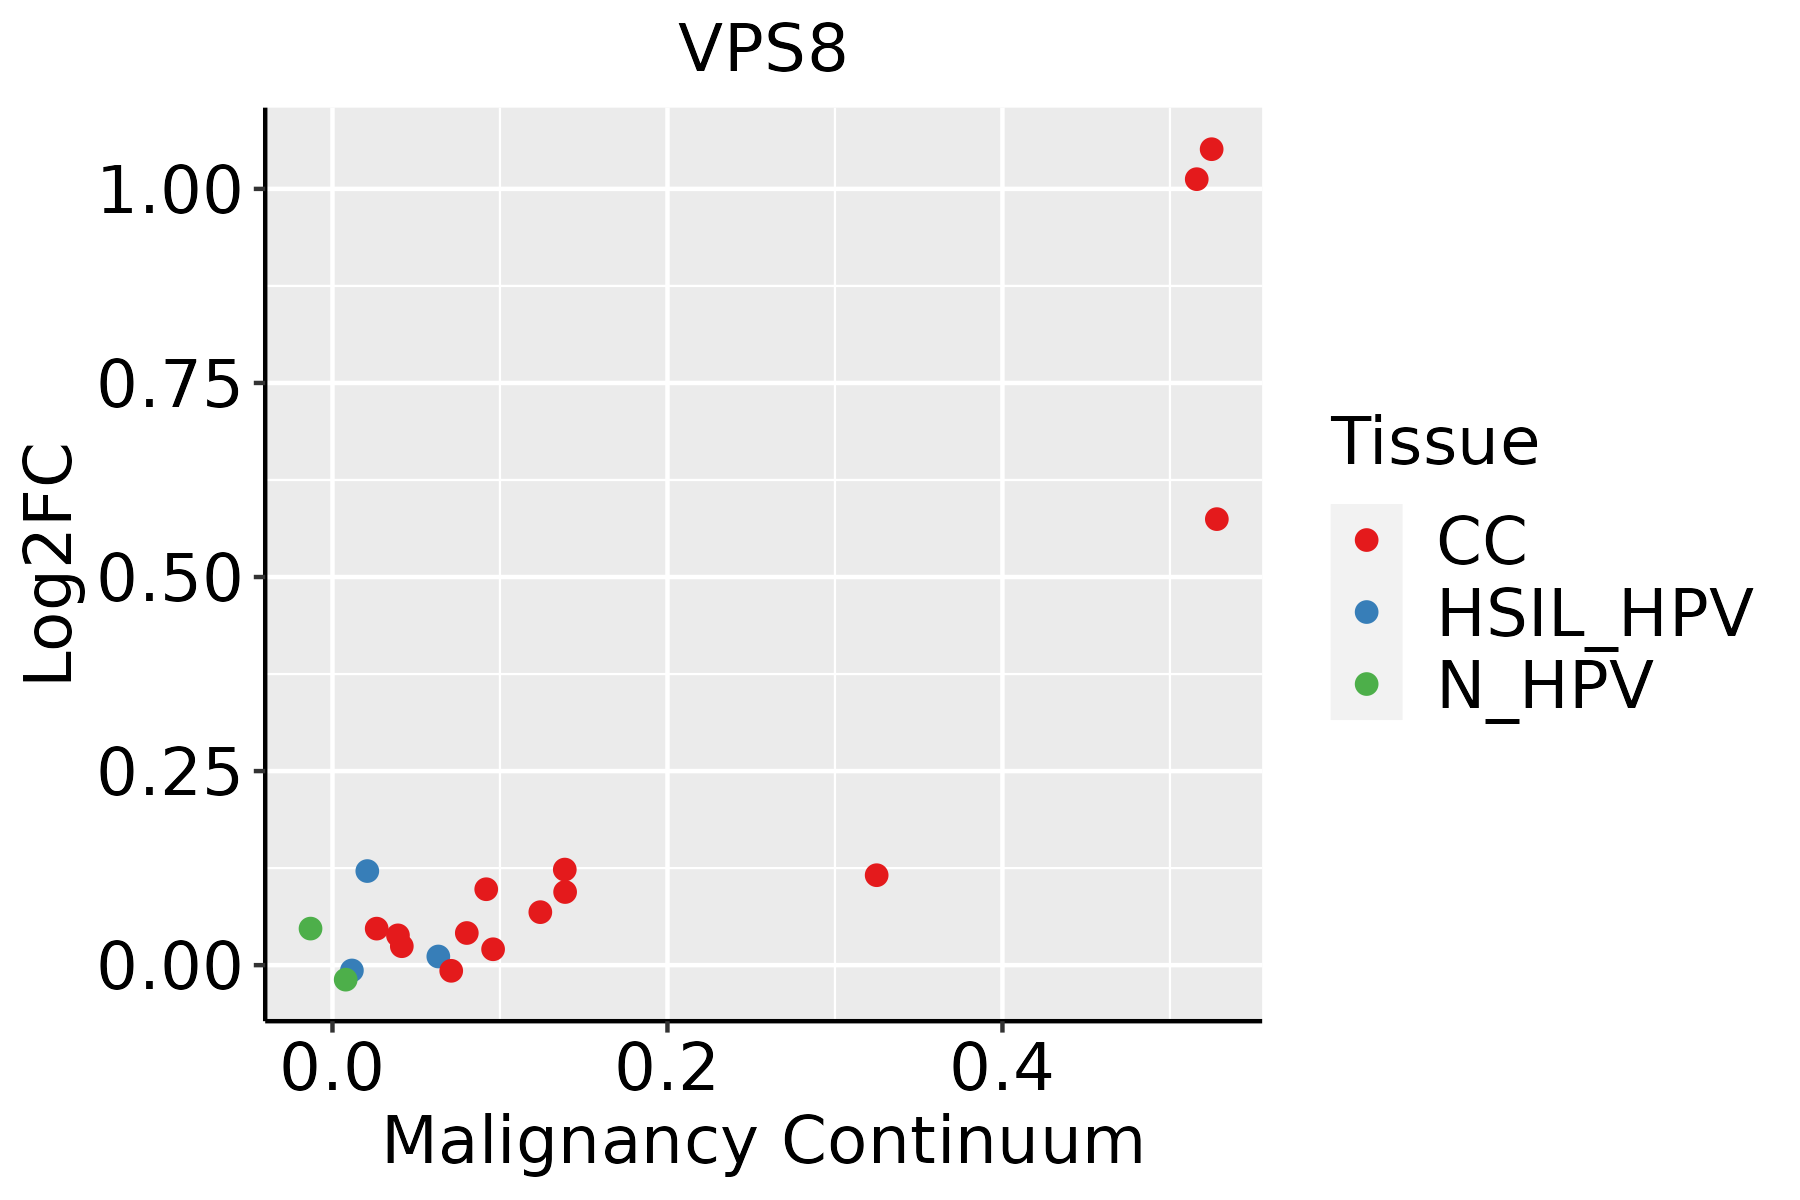 | CC: Cervix cancer |
| HSIL_HPV: HPV-infected high-grade squamous intraepithelial lesions | ||
| N_HPV: HPV-infected normal cervix | ||
| Colorectum (GSE201348) |  | FAP: Familial adenomatous polyposis |
| CRC: Colorectal cancer | ||
| Colorectum (HTA11) |  | AD: Adenomas |
| SER: Sessile serrated lesions | ||
| MSI-H: Microsatellite-high colorectal cancer | ||
| MSS: Microsatellite stable colorectal cancer | ||
| Esophagus | 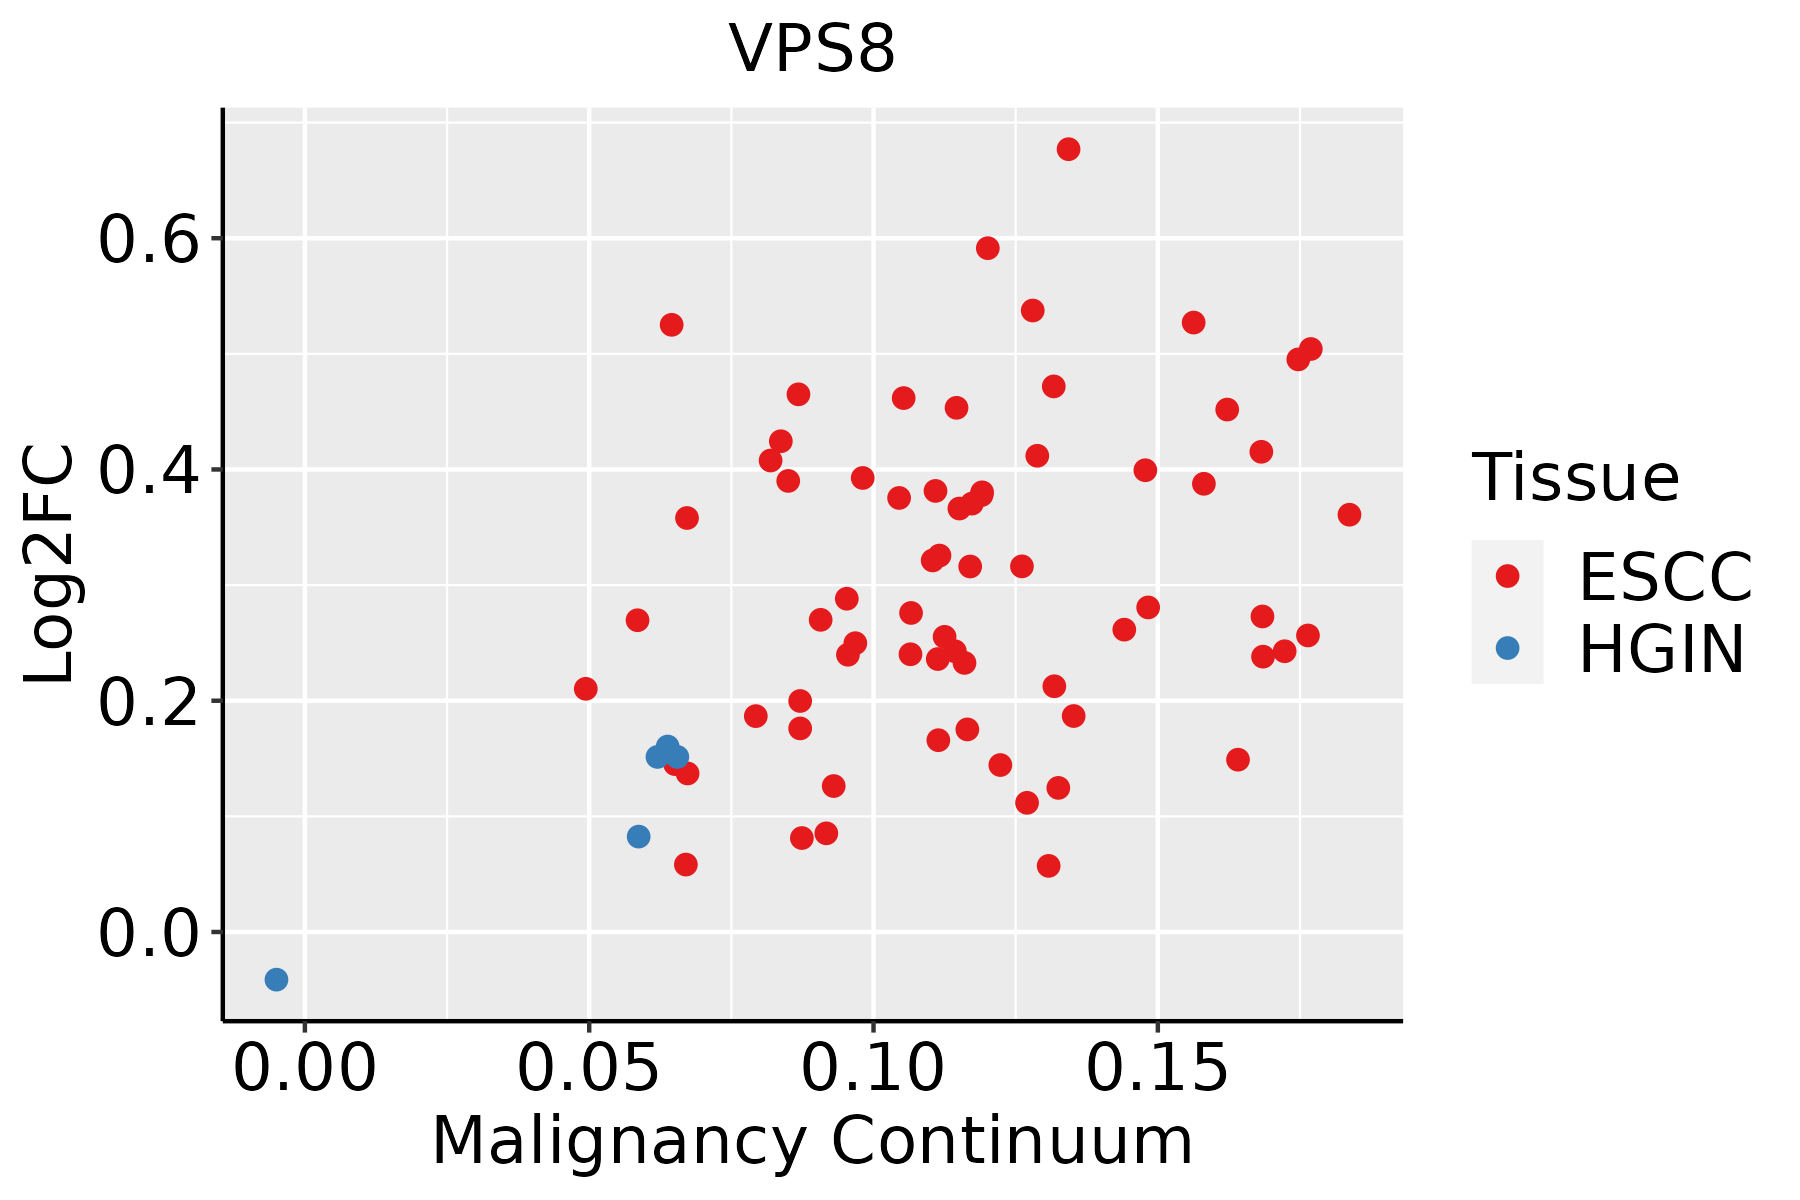 | ESCC: Esophageal squamous cell carcinoma |
| HGIN: High-grade intraepithelial neoplasias | ||
| LGIN: Low-grade intraepithelial neoplasias | ||
| Lung | 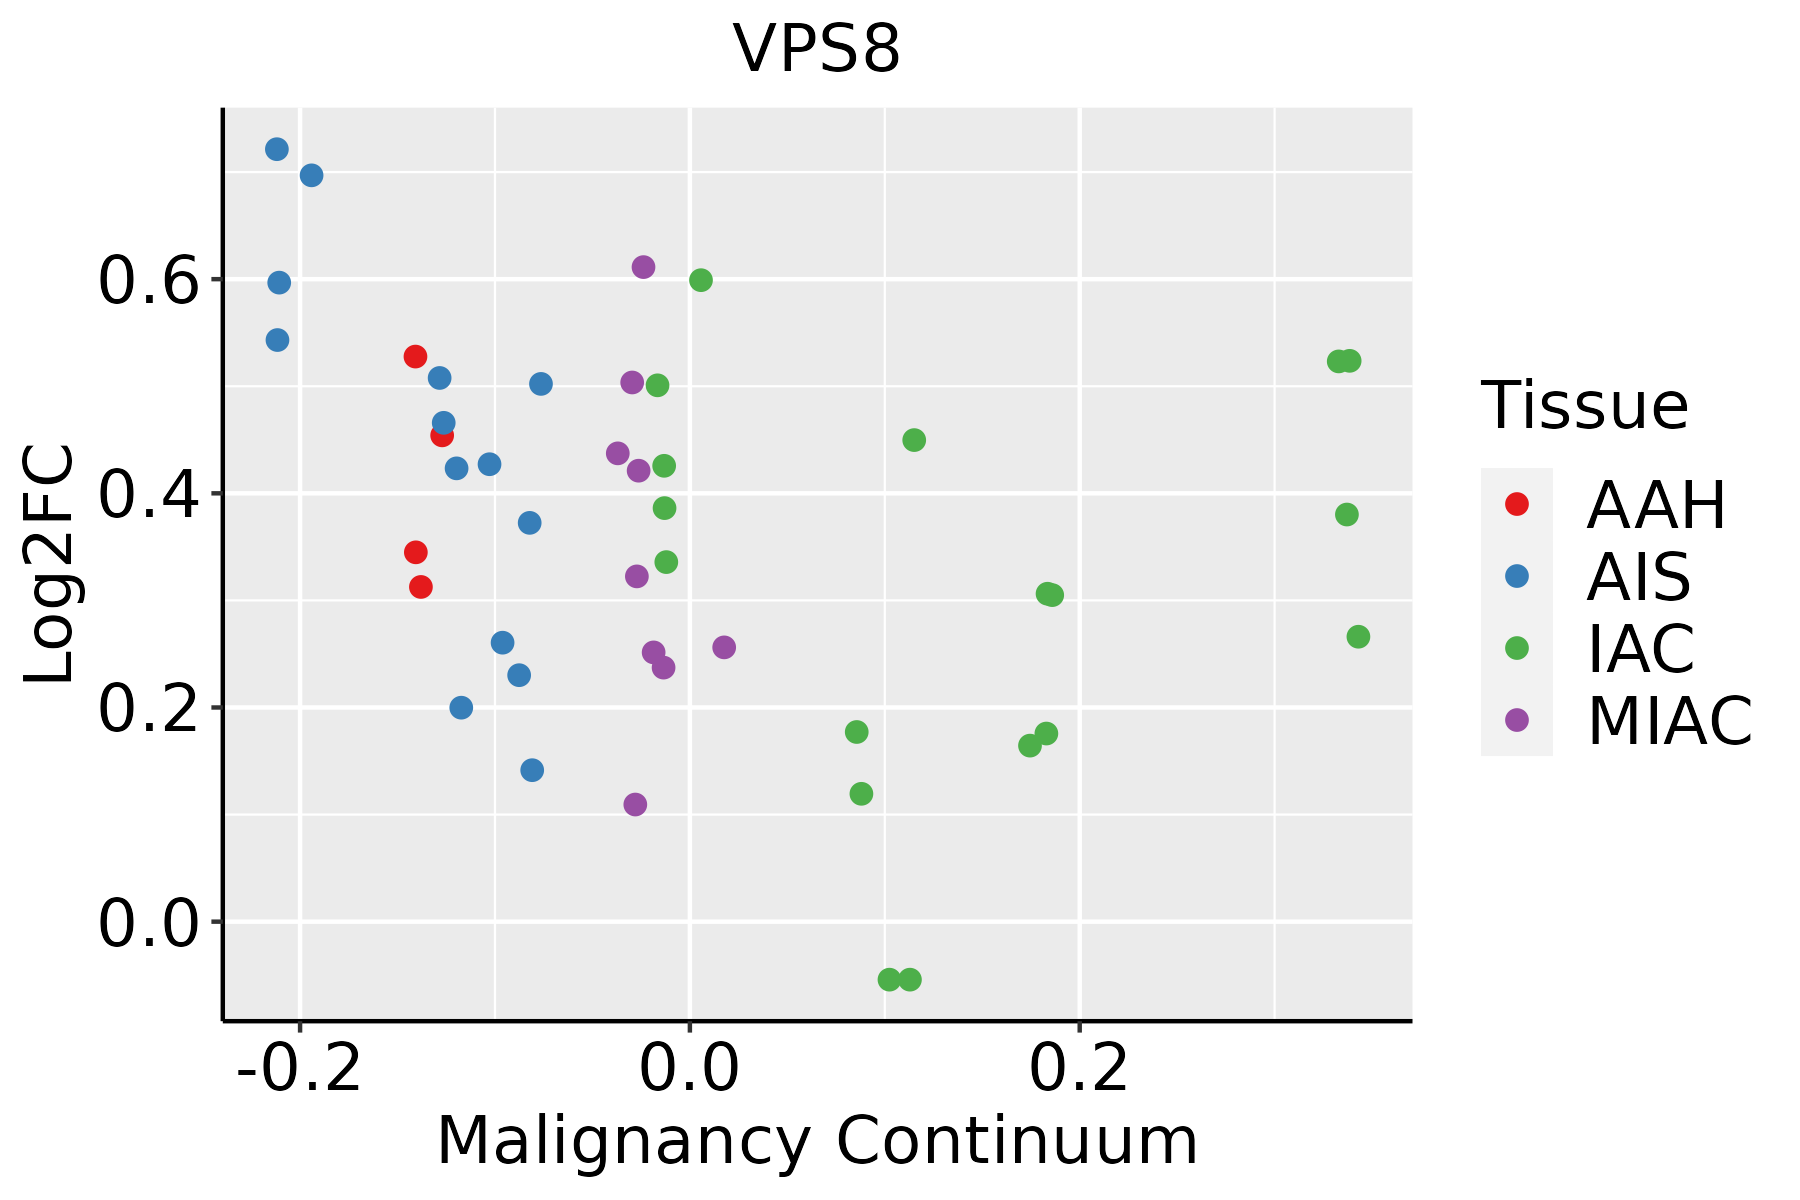 | AAH: Atypical adenomatous hyperplasia |
| AIS: Adenocarcinoma in situ | ||
| IAC: Invasive lung adenocarcinoma | ||
| MIA: Minimally invasive adenocarcinoma | ||
| Thyroid |  | ATC: Anaplastic thyroid cancer |
| HT: Hashimoto's thyroiditis | ||
| PTC: Papillary thyroid cancer |
| ∗log2FC in expression of this searched gene in stem-like cells from each diseased tissue sample relative to stem-like cells in normal samples in each tissue plotted against the malignancy continuum. Samples are colored based on if they are from different disease stage. |
Top |
Malignant transformation related pathway analysis |
| Find out the enriched GO biological processes and KEGG pathways involved in transition from healthy to precancer to cancer |
| Tissue | Disease Stage | Enriched GO biological Processes |
| Colorectum | AD |  |
| Colorectum | SER |  |
| Colorectum | MSS |  |
| Colorectum | MSI-H |  |
| Colorectum | FAP |  |
| ∗Top 15 enriched GO BP terms are showed in the bar plot of each disease state in each tissue. Each row represents a significant GO biological process which is colored according to the -log10(p.adjust). |
| Page: 1 2 3 4 5 6 7 8 9 |
| GO ID | Tissue | Disease Stage | Description | Gene Ratio | Bg Ratio | pvalue | p.adjust | Count |
| GO:00160506 | Cervix | CC | vesicle organization | 54/2311 | 300/18723 | 2.71e-03 | 1.85e-02 | 54 |
| GO:0016050 | Colorectum | AD | vesicle organization | 101/3918 | 300/18723 | 1.65e-07 | 7.17e-06 | 101 |
| GO:0048284 | Colorectum | AD | organelle fusion | 42/3918 | 141/18723 | 8.04e-03 | 4.73e-02 | 42 |
| GO:00160501 | Colorectum | SER | vesicle organization | 69/2897 | 300/18723 | 3.59e-04 | 5.61e-03 | 69 |
| GO:00160502 | Colorectum | MSS | vesicle organization | 93/3467 | 300/18723 | 1.04e-07 | 4.97e-06 | 93 |
| GO:00482841 | Colorectum | MSS | organelle fusion | 39/3467 | 141/18723 | 4.91e-03 | 3.42e-02 | 39 |
| GO:00160503 | Colorectum | FAP | vesicle organization | 74/2622 | 300/18723 | 5.16e-07 | 2.66e-05 | 74 |
| GO:00160504 | Colorectum | CRC | vesicle organization | 57/2078 | 300/18723 | 3.36e-05 | 8.57e-04 | 57 |
| GO:001605014 | Esophagus | ESCC | vesicle organization | 211/8552 | 300/18723 | 2.85e-18 | 2.87e-16 | 211 |
| GO:00482844 | Esophagus | ESCC | organelle fusion | 94/8552 | 141/18723 | 3.72e-07 | 5.16e-06 | 94 |
| GO:00901743 | Esophagus | ESCC | organelle membrane fusion | 73/8552 | 110/18723 | 9.29e-06 | 8.88e-05 | 73 |
| GO:00069063 | Esophagus | ESCC | vesicle fusion | 70/8552 | 106/18723 | 1.82e-05 | 1.60e-04 | 70 |
| GO:00610254 | Esophagus | ESCC | membrane fusion | 98/8552 | 163/18723 | 1.39e-04 | 9.41e-04 | 98 |
| GO:001605017 | Thyroid | PTC | vesicle organization | 163/5968 | 300/18723 | 4.74e-16 | 3.69e-14 | 163 |
| GO:00482846 | Thyroid | PTC | organelle fusion | 71/5968 | 141/18723 | 3.68e-06 | 4.70e-05 | 71 |
| GO:00610256 | Thyroid | PTC | membrane fusion | 77/5968 | 163/18723 | 2.86e-05 | 2.78e-04 | 77 |
| GO:00069065 | Thyroid | PTC | vesicle fusion | 54/5968 | 106/18723 | 3.39e-05 | 3.21e-04 | 54 |
| GO:00901745 | Thyroid | PTC | organelle membrane fusion | 55/5968 | 110/18723 | 5.64e-05 | 4.99e-04 | 55 |
| GO:001605023 | Thyroid | ATC | vesicle organization | 166/6293 | 300/18723 | 6.14e-15 | 3.92e-13 | 166 |
| GO:004828413 | Thyroid | ATC | organelle fusion | 71/6293 | 141/18723 | 2.83e-05 | 2.38e-04 | 71 |
| Page: 1 2 |
| Pathway ID | Tissue | Disease Stage | Description | Gene Ratio | Bg Ratio | pvalue | p.adjust | qvalue | Count |
| Page: 1 |
Top |
Cell-cell communication analysis |
| Identification of potential cell-cell interactions between two cell types and their ligand-receptor pairs for different disease states |
| Ligand | Receptor | LRpair | Pathway | Tissue | Disease Stage |
| Page: 1 |
Top |
Single-cell gene regulatory network inference analysis |
| Find out the significant the regulons (TFs) and the target genes of each regulon across cell types for different disease states |
| TF | Cell Type | Tissue | Disease Stage | Target Gene | RSS | Regulon Activity |
| ∗The dot plots of a searched regulon are shown for all cell subpopulations in each disease state of each tissue based on the regulon specific score inferred using pySCENIC and by calculating the average expression. |
| Page: 1 |
Top |
Somatic mutation of malignant transformation related genes |
| Annotation of somatic variants for genes involved in malignant transformation |
| Hugo Symbol | Variant Class | Variant Classification | dbSNP RS | HGVSc | HGVSp | HGVSp Short | SWISSPROT | BIOTYPE | SIFT | PolyPhen | Tumor Sample Barcode | Tissue | Histology | Sex | Age | Stage | Therapy Types | Drugs | Outcome |
| VPS8 | SNV | Missense_Mutation | rs752593630 | c.1643G>A | p.Arg548Gln | p.R548Q | Q8N3P4 | protein_coding | tolerated(0.16) | benign(0.036) | TCGA-A2-A0YM-01 | Breast | breast invasive carcinoma | Female | >=65 | I/II | Unknown | Unknown | SD |
| VPS8 | SNV | Missense_Mutation | novel | c.2404N>C | p.Asp802His | p.D802H | Q8N3P4 | protein_coding | deleterious(0.02) | possibly_damaging(0.735) | TCGA-AC-A23H-01 | Breast | breast invasive carcinoma | Female | >=65 | I/II | Unknown | Unknown | PD |
| VPS8 | SNV | Missense_Mutation | rs372735954 | c.58N>A | p.Glu20Lys | p.E20K | Q8N3P4 | protein_coding | tolerated_low_confidence(0.06) | benign(0.011) | TCGA-AN-A046-01 | Breast | breast invasive carcinoma | Female | >=65 | I/II | Unknown | Unknown | SD |
| VPS8 | SNV | Missense_Mutation | rs756843158 | c.2377N>A | p.Ala793Thr | p.A793T | Q8N3P4 | protein_coding | tolerated(0.05) | possibly_damaging(0.896) | TCGA-AN-A046-01 | Breast | breast invasive carcinoma | Female | >=65 | I/II | Unknown | Unknown | SD |
| VPS8 | SNV | Missense_Mutation | c.542N>T | p.Asp181Val | p.D181V | Q8N3P4 | protein_coding | deleterious(0) | possibly_damaging(0.49) | TCGA-AO-A0JD-01 | Breast | breast invasive carcinoma | Female | <65 | III/IV | Chemotherapy | cyclophosphamide | SD | |
| VPS8 | SNV | Missense_Mutation | c.1205N>G | p.Tyr402Cys | p.Y402C | Q8N3P4 | protein_coding | tolerated(0.24) | benign(0.018) | TCGA-B6-A0RE-01 | Breast | breast invasive carcinoma | Female | <65 | I/II | Unknown | Unknown | SD | |
| VPS8 | SNV | Missense_Mutation | c.196N>G | p.Pro66Ala | p.P66A | Q8N3P4 | protein_coding | deleterious(0) | probably_damaging(0.998) | TCGA-BH-A0DZ-01 | Breast | breast invasive carcinoma | Female | <65 | I/II | Chemotherapy | docetaxel | SD | |
| VPS8 | SNV | Missense_Mutation | rs773689221 | c.2612N>A | p.Arg871Gln | p.R871Q | Q8N3P4 | protein_coding | tolerated(0.12) | probably_damaging(0.92) | TCGA-BH-A1EX-01 | Breast | breast invasive carcinoma | Female | >=65 | I/II | Unknown | Unknown | PD |
| VPS8 | SNV | Missense_Mutation | c.766C>G | p.Pro256Ala | p.P256A | Q8N3P4 | protein_coding | deleterious(0.05) | probably_damaging(0.998) | TCGA-D8-A27N-01 | Breast | breast invasive carcinoma | Female | <65 | III/IV | Chemotherapy | taxol+adriamycin+cyclophosphamide+herceptin | SD | |
| VPS8 | SNV | Missense_Mutation | novel | c.476N>G | p.Ala159Gly | p.A159G | Q8N3P4 | protein_coding | deleterious(0.01) | possibly_damaging(0.835) | TCGA-PE-A5DC-01 | Breast | breast invasive carcinoma | Female | >=65 | III/IV | Unknown | Unknown | SD |
| Page: 1 2 3 4 5 6 7 8 9 10 11 12 13 14 |
Top |
Related drugs of malignant transformation related genes |
| Identification of chemicals and drugs interact with genes involved in malignant transfromation |
| (DGIdb 4.0) |
| Entrez ID | Symbol | Category | Interaction Types | Drug Claim Name | Drug Name | PMIDs |
| Page: 1 |

Copyright 2023-Present -The University of Texas Health Science Center at Houston |