
|
|||||
|
 | |
| |
| |
| |
| |
| |
|
Gene: VPS72 |
Gene summary for VPS72 |
| Gene information | Species | Human | Gene symbol | VPS72 | Gene ID | 6944 |
| Gene name | vacuolar protein sorting 72 homolog | |
| Gene Alias | CFL1 | |
| Cytomap | 1q21.3 | |
| Gene Type | protein-coding | GO ID | GO:0000122 | UniProtAcc | Q15906 |
Top |
Malignant transformation analysis |
| Identification of the aberrant gene expression in precancerous and cancerous lesions by comparing the gene expression of stem-like cells in diseased tissues with normal stem cells |
| Entrez ID | Symbol | Replicates | Species | Organ | Tissue | Adj P-value | Log2FC | Malignancy |
| 6944 | VPS72 | HTA11_1938_2000001011 | Human | Colorectum | AD | 1.49e-02 | 3.08e-01 | -0.0811 |
| 6944 | VPS72 | HTA11_347_2000001011 | Human | Colorectum | AD | 3.08e-04 | 3.22e-01 | -0.1954 |
| 6944 | VPS72 | HTA11_696_2000001011 | Human | Colorectum | AD | 2.17e-06 | 2.75e-01 | -0.1464 |
| 6944 | VPS72 | HTA11_866_2000001011 | Human | Colorectum | AD | 4.16e-03 | 2.07e-01 | -0.1001 |
| 6944 | VPS72 | HTA11_1391_2000001011 | Human | Colorectum | AD | 3.74e-03 | 3.75e-01 | -0.059 |
| 6944 | VPS72 | HTA11_866_3004761011 | Human | Colorectum | AD | 1.11e-10 | 4.96e-01 | 0.096 |
| 6944 | VPS72 | HTA11_7663_2000001011 | Human | Colorectum | SER | 3.15e-02 | 4.49e-01 | 0.0131 |
| 6944 | VPS72 | HTA11_7696_3000711011 | Human | Colorectum | AD | 3.74e-15 | 4.19e-01 | 0.0674 |
| 6944 | VPS72 | HTA11_99999970781_79442 | Human | Colorectum | MSS | 6.82e-09 | 4.35e-01 | 0.294 |
| 6944 | VPS72 | HTA11_99999965104_69814 | Human | Colorectum | MSS | 3.33e-02 | 3.72e-01 | 0.281 |
| 6944 | VPS72 | HTA11_99999971662_82457 | Human | Colorectum | MSS | 3.09e-21 | 6.70e-01 | 0.3859 |
| 6944 | VPS72 | HTA11_99999974143_84620 | Human | Colorectum | MSS | 2.41e-06 | 2.78e-01 | 0.3005 |
| 6944 | VPS72 | LZE2D | Human | Esophagus | HGIN | 1.70e-03 | 4.63e-01 | 0.0642 |
| 6944 | VPS72 | LZE2T | Human | Esophagus | ESCC | 2.40e-06 | 7.04e-01 | 0.082 |
| 6944 | VPS72 | LZE4T | Human | Esophagus | ESCC | 1.36e-17 | 3.67e-01 | 0.0811 |
| 6944 | VPS72 | LZE5T | Human | Esophagus | ESCC | 1.53e-06 | 3.42e-01 | 0.0514 |
| 6944 | VPS72 | LZE7T | Human | Esophagus | ESCC | 1.75e-20 | 9.88e-01 | 0.0667 |
| 6944 | VPS72 | LZE8T | Human | Esophagus | ESCC | 1.32e-08 | 2.44e-01 | 0.067 |
| 6944 | VPS72 | LZE20T | Human | Esophagus | ESCC | 2.13e-10 | 2.98e-01 | 0.0662 |
| 6944 | VPS72 | LZE22T | Human | Esophagus | ESCC | 1.06e-08 | 6.01e-01 | 0.068 |
| Page: 1 2 3 4 5 6 7 |
| Tissue | Expression Dynamics | Abbreviation |
| Colorectum (GSE201348) |  | FAP: Familial adenomatous polyposis |
| CRC: Colorectal cancer | ||
| Colorectum (HTA11) |  | AD: Adenomas |
| SER: Sessile serrated lesions | ||
| MSI-H: Microsatellite-high colorectal cancer | ||
| MSS: Microsatellite stable colorectal cancer | ||
| Esophagus |  | ESCC: Esophageal squamous cell carcinoma |
| HGIN: High-grade intraepithelial neoplasias | ||
| LGIN: Low-grade intraepithelial neoplasias | ||
| Liver | 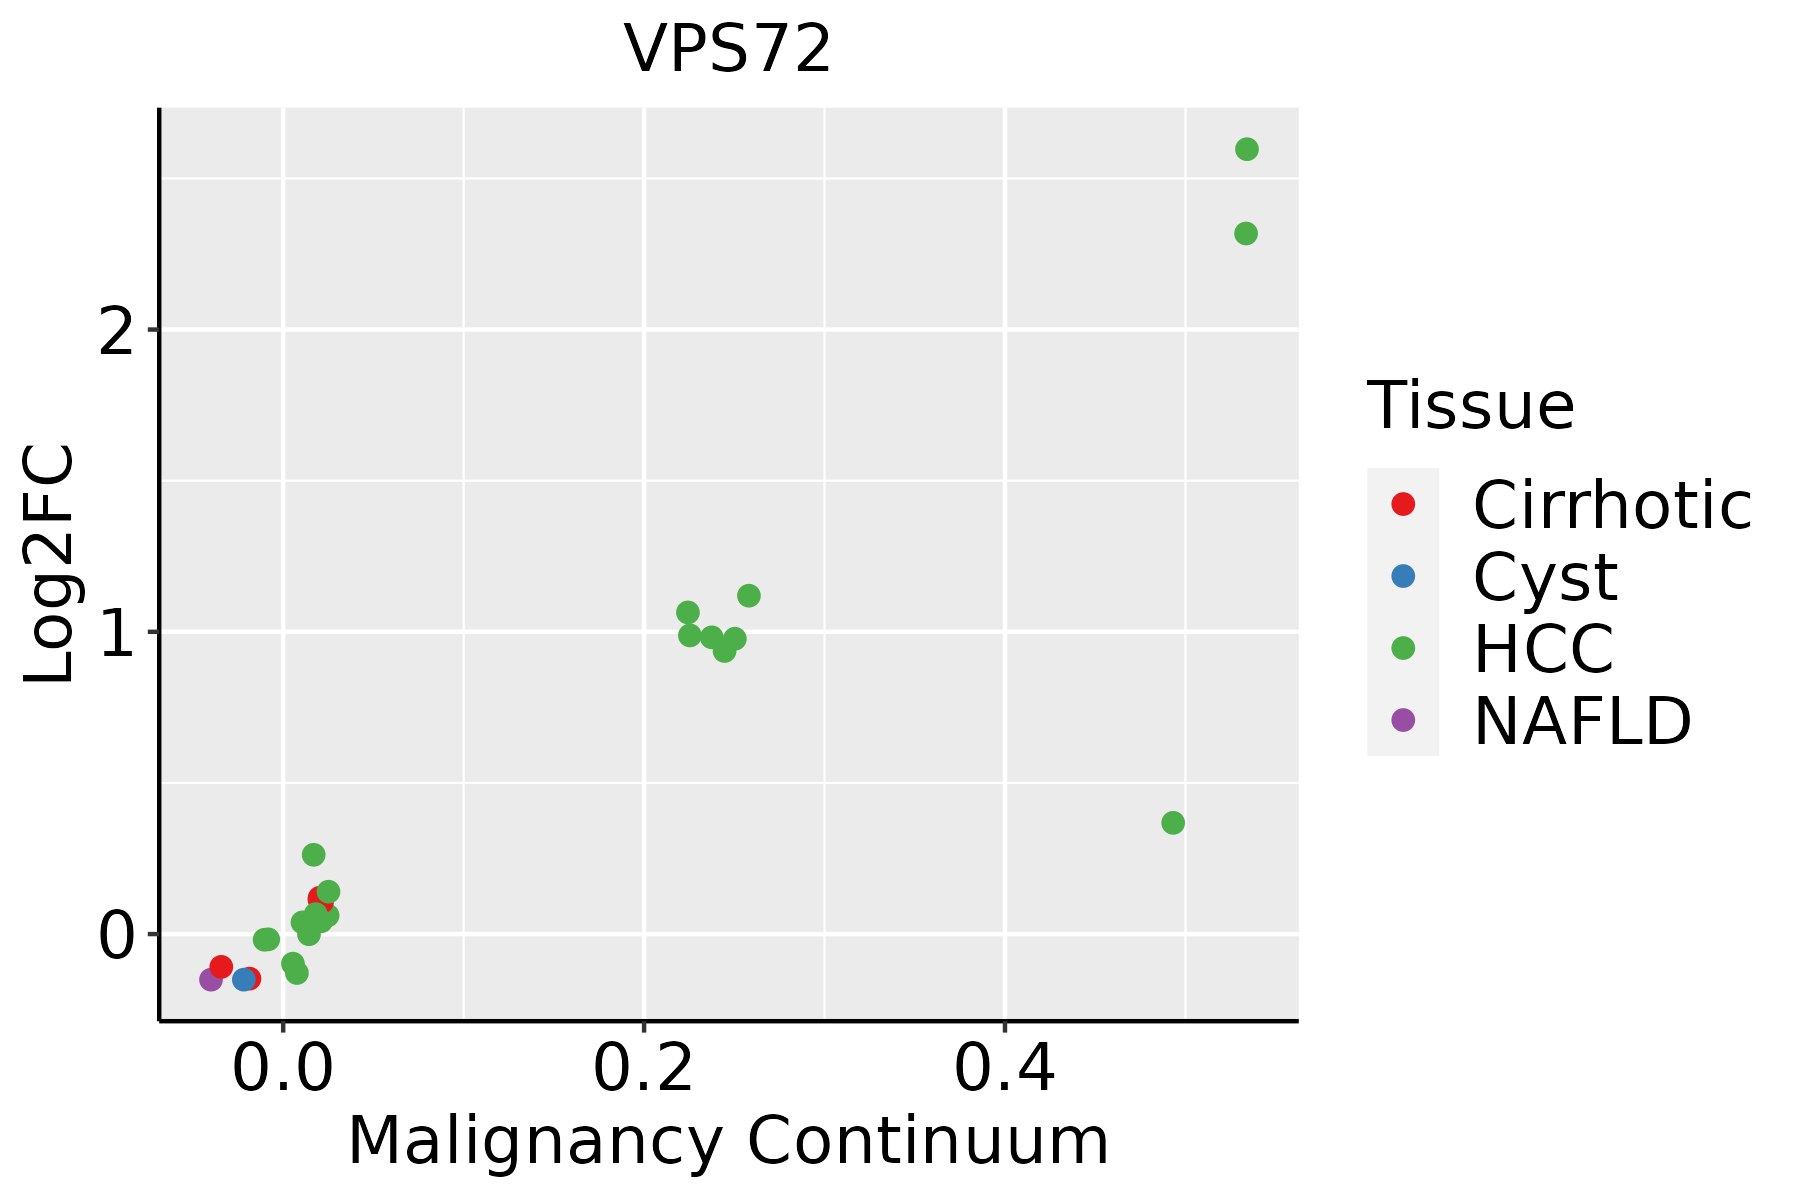 | HCC: Hepatocellular carcinoma |
| NAFLD: Non-alcoholic fatty liver disease | ||
| Oral Cavity | 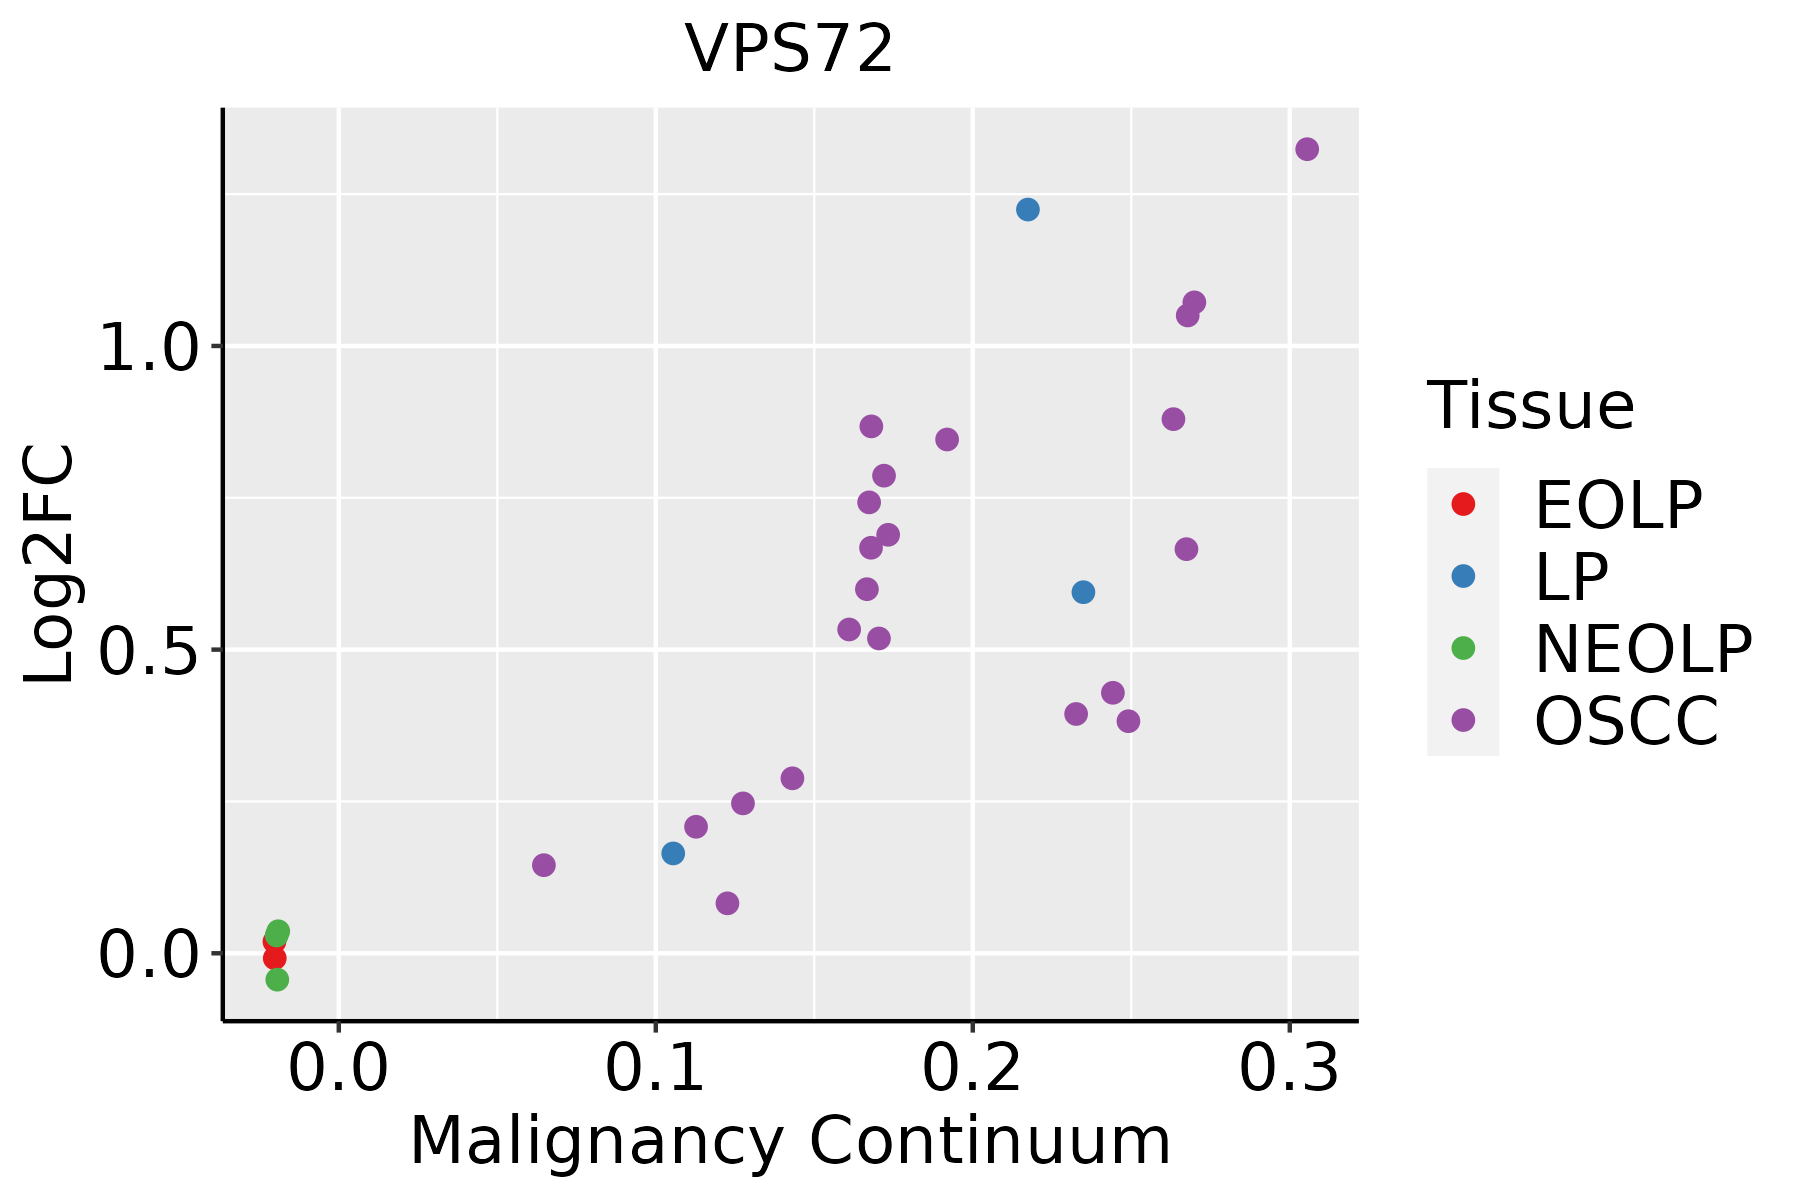 | EOLP: Erosive Oral lichen planus |
| LP: leukoplakia | ||
| NEOLP: Non-erosive oral lichen planus | ||
| OSCC: Oral squamous cell carcinoma | ||
| Skin | 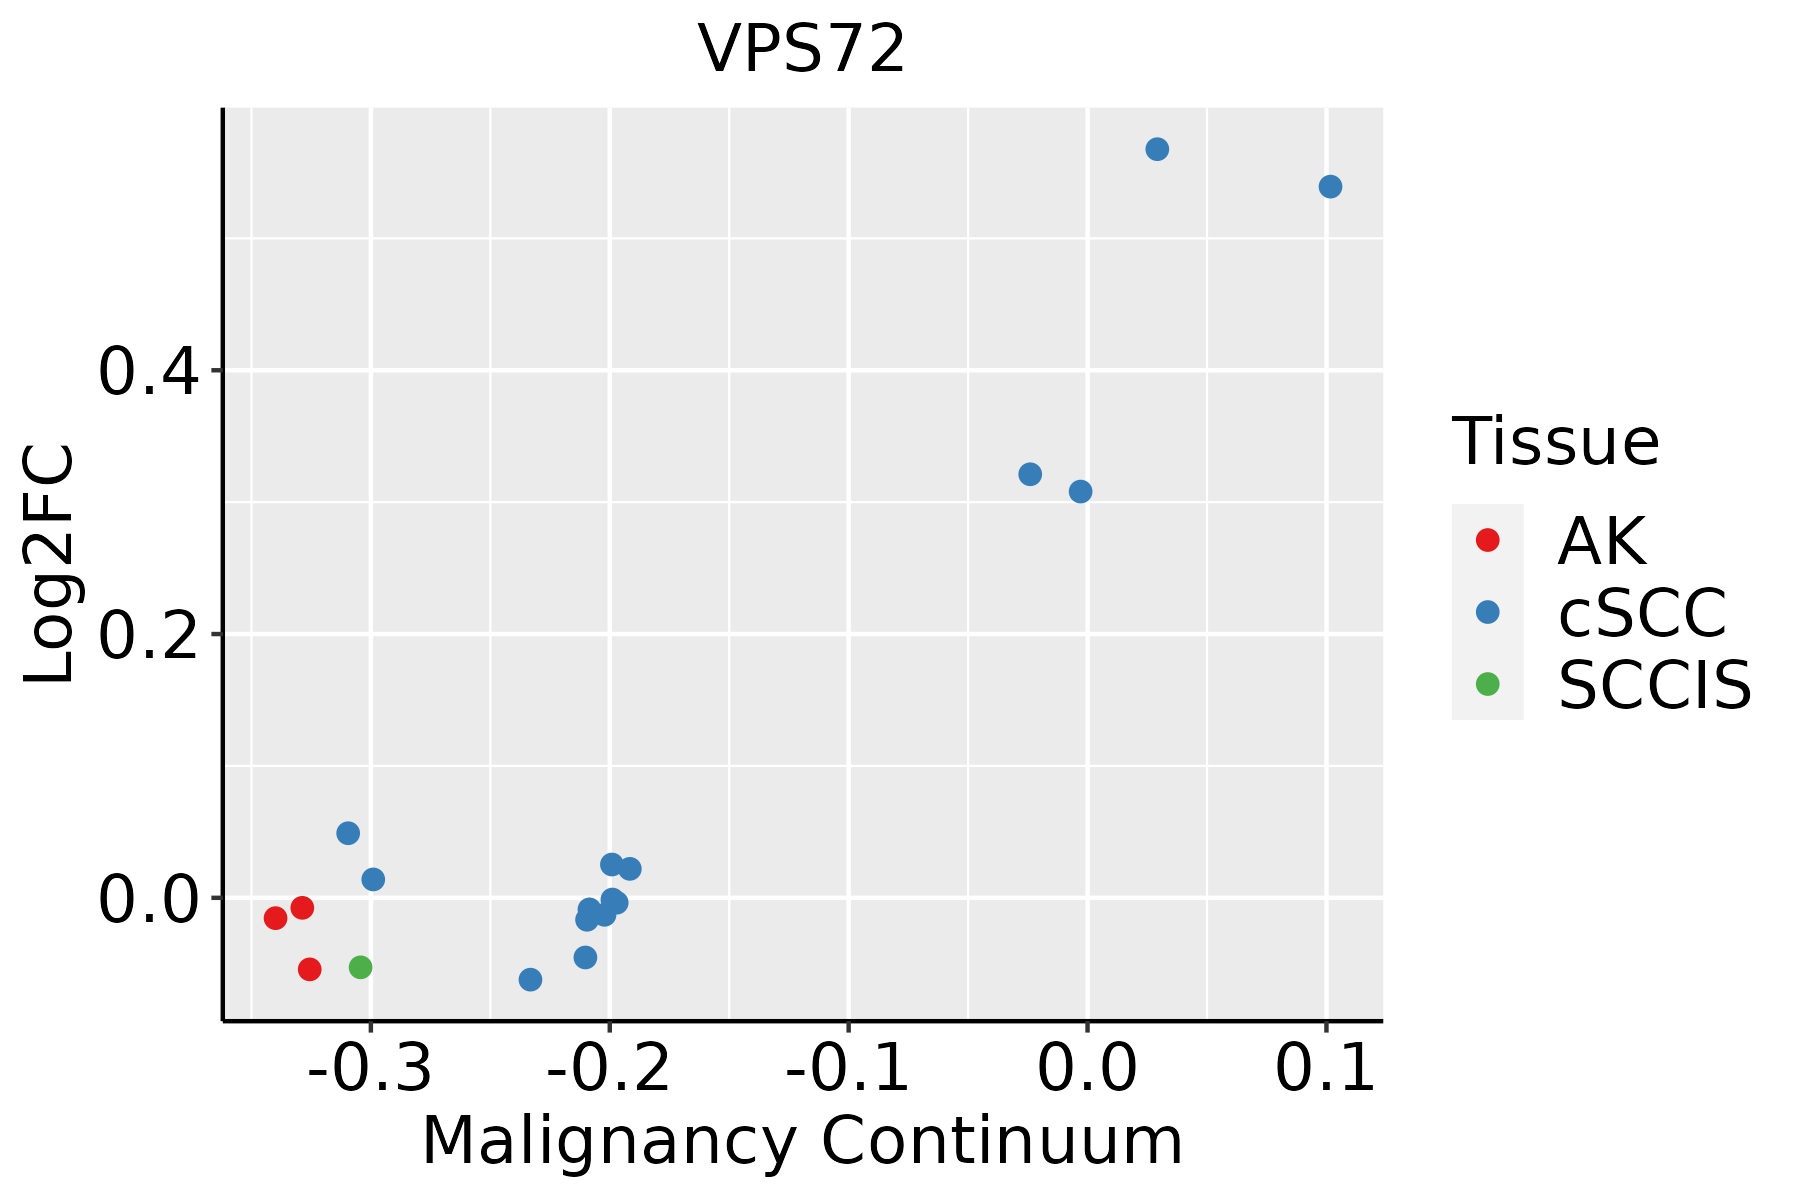 | AK: Actinic keratosis |
| cSCC: Cutaneous squamous cell carcinoma | ||
| SCCIS:squamous cell carcinoma in situ |
| ∗log2FC in expression of this searched gene in stem-like cells from each diseased tissue sample relative to stem-like cells in normal samples in each tissue plotted against the malignancy continuum. Samples are colored based on if they are from different disease stage. |
Top |
Malignant transformation related pathway analysis |
| Find out the enriched GO biological processes and KEGG pathways involved in transition from healthy to precancer to cancer |
| Tissue | Disease Stage | Enriched GO biological Processes |
| Colorectum | AD |  |
| Colorectum | SER |  |
| Colorectum | MSS |  |
| Colorectum | MSI-H |  |
| Colorectum | FAP |  |
| ∗Top 15 enriched GO BP terms are showed in the bar plot of each disease state in each tissue. Each row represents a significant GO biological process which is colored according to the -log10(p.adjust). |
| Page: 1 2 3 4 5 6 7 8 9 |
| GO ID | Tissue | Disease Stage | Description | Gene Ratio | Bg Ratio | pvalue | p.adjust | Count |
| GO:0006325 | Colorectum | AD | chromatin organization | 119/3918 | 409/18723 | 4.85e-05 | 8.33e-04 | 119 |
| GO:0006338 | Colorectum | AD | chromatin remodeling | 70/3918 | 255/18723 | 7.44e-03 | 4.53e-02 | 70 |
| GO:00063251 | Colorectum | SER | chromatin organization | 89/2897 | 409/18723 | 4.15e-04 | 6.17e-03 | 89 |
| GO:00063252 | Colorectum | MSS | chromatin organization | 107/3467 | 409/18723 | 7.22e-05 | 1.21e-03 | 107 |
| GO:000632516 | Esophagus | HGIN | chromatin organization | 92/2587 | 409/18723 | 1.05e-06 | 4.16e-05 | 92 |
| GO:00198277 | Esophagus | HGIN | stem cell population maintenance | 39/2587 | 131/18723 | 1.63e-06 | 6.14e-05 | 39 |
| GO:00987278 | Esophagus | HGIN | maintenance of cell number | 39/2587 | 134/18723 | 3.02e-06 | 1.03e-04 | 39 |
| GO:0035019 | Esophagus | HGIN | somatic stem cell population maintenance | 13/2587 | 42/18723 | 3.32e-03 | 3.12e-02 | 13 |
| GO:000632517 | Esophagus | ESCC | chromatin organization | 240/8552 | 409/18723 | 6.52e-08 | 1.14e-06 | 240 |
| GO:009872714 | Esophagus | ESCC | maintenance of cell number | 90/8552 | 134/18723 | 3.94e-07 | 5.43e-06 | 90 |
| GO:001982714 | Esophagus | ESCC | stem cell population maintenance | 88/8552 | 131/18723 | 5.23e-07 | 6.97e-06 | 88 |
| GO:0043486 | Esophagus | ESCC | histone exchange | 16/8552 | 22/18723 | 9.46e-03 | 3.28e-02 | 16 |
| GO:001982711 | Liver | Cirrhotic | stem cell population maintenance | 48/4634 | 131/18723 | 1.58e-03 | 1.03e-02 | 48 |
| GO:009872711 | Liver | Cirrhotic | maintenance of cell number | 48/4634 | 134/18723 | 2.70e-03 | 1.58e-02 | 48 |
| GO:00987272 | Liver | HCC | maintenance of cell number | 77/7958 | 134/18723 | 3.32e-04 | 2.33e-03 | 77 |
| GO:00198272 | Liver | HCC | stem cell population maintenance | 75/7958 | 131/18723 | 4.58e-04 | 3.04e-03 | 75 |
| GO:000632511 | Liver | HCC | chromatin organization | 206/7958 | 409/18723 | 7.23e-04 | 4.41e-03 | 206 |
| GO:00987277 | Oral cavity | OSCC | maintenance of cell number | 81/7305 | 134/18723 | 3.96e-07 | 5.90e-06 | 81 |
| GO:00198276 | Oral cavity | OSCC | stem cell population maintenance | 79/7305 | 131/18723 | 6.28e-07 | 8.96e-06 | 79 |
| GO:000632510 | Oral cavity | OSCC | chromatin organization | 190/7305 | 409/18723 | 1.17e-03 | 5.97e-03 | 190 |
| Page: 1 2 |
| Pathway ID | Tissue | Disease Stage | Description | Gene Ratio | Bg Ratio | pvalue | p.adjust | qvalue | Count |
| Page: 1 |
Top |
Cell-cell communication analysis |
| Identification of potential cell-cell interactions between two cell types and their ligand-receptor pairs for different disease states |
| Ligand | Receptor | LRpair | Pathway | Tissue | Disease Stage |
| Page: 1 |
Top |
Single-cell gene regulatory network inference analysis |
| Find out the significant the regulons (TFs) and the target genes of each regulon across cell types for different disease states |
| TF | Cell Type | Tissue | Disease Stage | Target Gene | RSS | Regulon Activity |
| VPS72 | CD8TEXINT | Liver | HCC | SEC61B,BTBD9,FNIP1, etc. | 9.10e-02 |  |
| VPS72 | BN | Liver | Healthy | SEC61B,BTBD9,FNIP1, etc. | 3.84e-02 |  |
| VPS72 | PLA | Oral cavity | EOLP | BTBD3,MYBL1,DAG1, etc. | 5.07e-02 |  |
| VPS72 | NK | Oral cavity | LP | BTBD3,MYBL1,DAG1, etc. | 1.33e-02 |  |
| VPS72 | ECC | Skin | ADJ | AC012447.1,BST2,RNASE1, etc. | 5.10e-02 |  |
| VPS72 | CYC | Skin | SCCIS | AC012447.1,BST2,RNASE1, etc. | 9.95e-03 |  |
| ∗The dot plots of a searched regulon are shown for all cell subpopulations in each disease state of each tissue based on the regulon specific score inferred using pySCENIC and by calculating the average expression. |
| Page: 1 |
Top |
Somatic mutation of malignant transformation related genes |
| Annotation of somatic variants for genes involved in malignant transformation |
| Hugo Symbol | Variant Class | Variant Classification | dbSNP RS | HGVSc | HGVSp | HGVSp Short | SWISSPROT | BIOTYPE | SIFT | PolyPhen | Tumor Sample Barcode | Tissue | Histology | Sex | Age | Stage | Therapy Types | Drugs | Outcome |
| VPS72 | SNV | Missense_Mutation | c.70N>A | p.Glu24Lys | p.E24K | Q15906 | protein_coding | deleterious(0.04) | probably_damaging(0.992) | TCGA-AN-A0XO-01 | Breast | breast invasive carcinoma | Female | <65 | III/IV | Unknown | Unknown | SD | |
| VPS72 | SNV | Missense_Mutation | c.920N>G | p.His307Arg | p.H307R | Q15906 | protein_coding | tolerated(0.63) | benign(0.047) | TCGA-B6-A402-01 | Breast | breast invasive carcinoma | Female | <65 | I/II | Chemotherapy | cyclophosphamide | PD | |
| VPS72 | SNV | Missense_Mutation | rs763229765 | c.991C>T | p.Arg331Cys | p.R331C | Q15906 | protein_coding | deleterious(0) | probably_damaging(0.986) | TCGA-2W-A8YY-01 | Cervix | cervical & endocervical cancer | Female | <65 | I/II | Chemotherapy | cisplatin | CR |
| VPS72 | SNV | Missense_Mutation | novel | c.614N>A | p.Arg205Gln | p.R205Q | Q15906 | protein_coding | deleterious(0.01) | probably_damaging(0.922) | TCGA-VS-A94Z-01 | Cervix | cervical & endocervical cancer | Female | <65 | I/II | Chemotherapy | cisplatin | CR |
| VPS72 | SNV | Missense_Mutation | c.400C>T | p.Arg134Cys | p.R134C | Q15906 | protein_coding | deleterious(0) | probably_damaging(0.98) | TCGA-A6-5665-01 | Colorectum | colon adenocarcinoma | Female | >=65 | I/II | Unknown | Unknown | PD | |
| VPS72 | SNV | Missense_Mutation | c.877C>T | p.Arg293Trp | p.R293W | Q15906 | protein_coding | tolerated(0.1) | possibly_damaging(0.518) | TCGA-AA-3864-01 | Colorectum | colon adenocarcinoma | Male | >=65 | I/II | Unknown | Unknown | SD | |
| VPS72 | SNV | Missense_Mutation | novel | c.185A>C | p.Asp62Ala | p.D62A | Q15906 | protein_coding | deleterious(0.01) | possibly_damaging(0.642) | TCGA-AA-A00N-01 | Colorectum | colon adenocarcinoma | Male | >=65 | I/II | Unknown | Unknown | PD |
| VPS72 | SNV | Missense_Mutation | c.682A>G | p.Lys228Glu | p.K228E | Q15906 | protein_coding | deleterious(0.02) | benign(0.217) | TCGA-AD-5900-01 | Colorectum | colon adenocarcinoma | Male | >=65 | I/II | Unknown | Unknown | SD | |
| VPS72 | SNV | Missense_Mutation | c.488G>A | p.Cys163Tyr | p.C163Y | Q15906 | protein_coding | tolerated(1) | benign(0) | TCGA-AZ-6601-01 | Colorectum | colon adenocarcinoma | Male | >=65 | I/II | Unknown | Unknown | PD | |
| VPS72 | SNV | Missense_Mutation | c.473N>A | p.Arg158Gln | p.R158Q | Q15906 | protein_coding | tolerated(0.13) | benign(0.122) | TCGA-CM-6171-01 | Colorectum | colon adenocarcinoma | Female | >=65 | I/II | Unknown | Unknown | SD |
| Page: 1 2 3 4 |
Top |
Related drugs of malignant transformation related genes |
| Identification of chemicals and drugs interact with genes involved in malignant transfromation |
| (DGIdb 4.0) |
| Entrez ID | Symbol | Category | Interaction Types | Drug Claim Name | Drug Name | PMIDs |
| Page: 1 |

Copyright 2023-Present -The University of Texas Health Science Center at Houston |