
|
|||||
|
 | |
| |
| |
| |
| |
| |
|
Gene: VPS54 |
Gene summary for VPS54 |
| Gene information | Species | Human | Gene symbol | VPS54 | Gene ID | 51542 |
| Gene name | VPS54 subunit of GARP complex | |
| Gene Alias | HCC8 | |
| Cytomap | 2p15-p14 | |
| Gene Type | protein-coding | GO ID | GO:0001894 | UniProtAcc | Q9P1Q0 |
Top |
Malignant transformation analysis |
| Identification of the aberrant gene expression in precancerous and cancerous lesions by comparing the gene expression of stem-like cells in diseased tissues with normal stem cells |
| Entrez ID | Symbol | Replicates | Species | Organ | Tissue | Adj P-value | Log2FC | Malignancy |
| 51542 | VPS54 | CCI_1 | Human | Cervix | CC | 1.49e-06 | 6.26e-01 | 0.528 |
| 51542 | VPS54 | CCI_2 | Human | Cervix | CC | 1.44e-06 | 7.94e-01 | 0.5249 |
| 51542 | VPS54 | CCI_3 | Human | Cervix | CC | 6.65e-10 | 5.92e-01 | 0.516 |
| 51542 | VPS54 | HTA11_3410_2000001011 | Human | Colorectum | AD | 1.71e-15 | -5.67e-01 | 0.0155 |
| 51542 | VPS54 | HTA11_2487_2000001011 | Human | Colorectum | SER | 3.47e-02 | -4.15e-01 | -0.1808 |
| 51542 | VPS54 | HTA11_3361_2000001011 | Human | Colorectum | AD | 1.14e-03 | -5.06e-01 | -0.1207 |
| 51542 | VPS54 | HTA11_866_2000001011 | Human | Colorectum | AD | 3.74e-05 | -3.45e-01 | -0.1001 |
| 51542 | VPS54 | HTA11_866_3004761011 | Human | Colorectum | AD | 1.86e-11 | -5.33e-01 | 0.096 |
| 51542 | VPS54 | HTA11_8622_2000001021 | Human | Colorectum | SER | 2.72e-02 | -6.33e-01 | 0.0528 |
| 51542 | VPS54 | HTA11_7696_3000711011 | Human | Colorectum | AD | 2.89e-13 | -4.59e-01 | 0.0674 |
| 51542 | VPS54 | HTA11_6818_2000001021 | Human | Colorectum | AD | 9.81e-04 | -5.29e-01 | 0.0588 |
| 51542 | VPS54 | HTA11_99999970781_79442 | Human | Colorectum | MSS | 1.41e-03 | -3.02e-01 | 0.294 |
| 51542 | VPS54 | A001-C-207 | Human | Colorectum | FAP | 1.89e-03 | -2.57e-01 | 0.1278 |
| 51542 | VPS54 | A015-C-203 | Human | Colorectum | FAP | 6.05e-27 | -3.74e-01 | -0.1294 |
| 51542 | VPS54 | A015-C-204 | Human | Colorectum | FAP | 4.76e-06 | -2.65e-01 | -0.0228 |
| 51542 | VPS54 | A014-C-040 | Human | Colorectum | FAP | 7.00e-05 | -4.17e-01 | -0.1184 |
| 51542 | VPS54 | A002-C-201 | Human | Colorectum | FAP | 1.94e-15 | -4.61e-01 | 0.0324 |
| 51542 | VPS54 | A002-C-203 | Human | Colorectum | FAP | 5.69e-05 | -2.41e-01 | 0.2786 |
| 51542 | VPS54 | A001-C-119 | Human | Colorectum | FAP | 4.95e-07 | -3.84e-01 | -0.1557 |
| 51542 | VPS54 | A001-C-108 | Human | Colorectum | FAP | 1.18e-12 | -2.13e-01 | -0.0272 |
| Page: 1 2 3 |
| Tissue | Expression Dynamics | Abbreviation |
| Cervix | 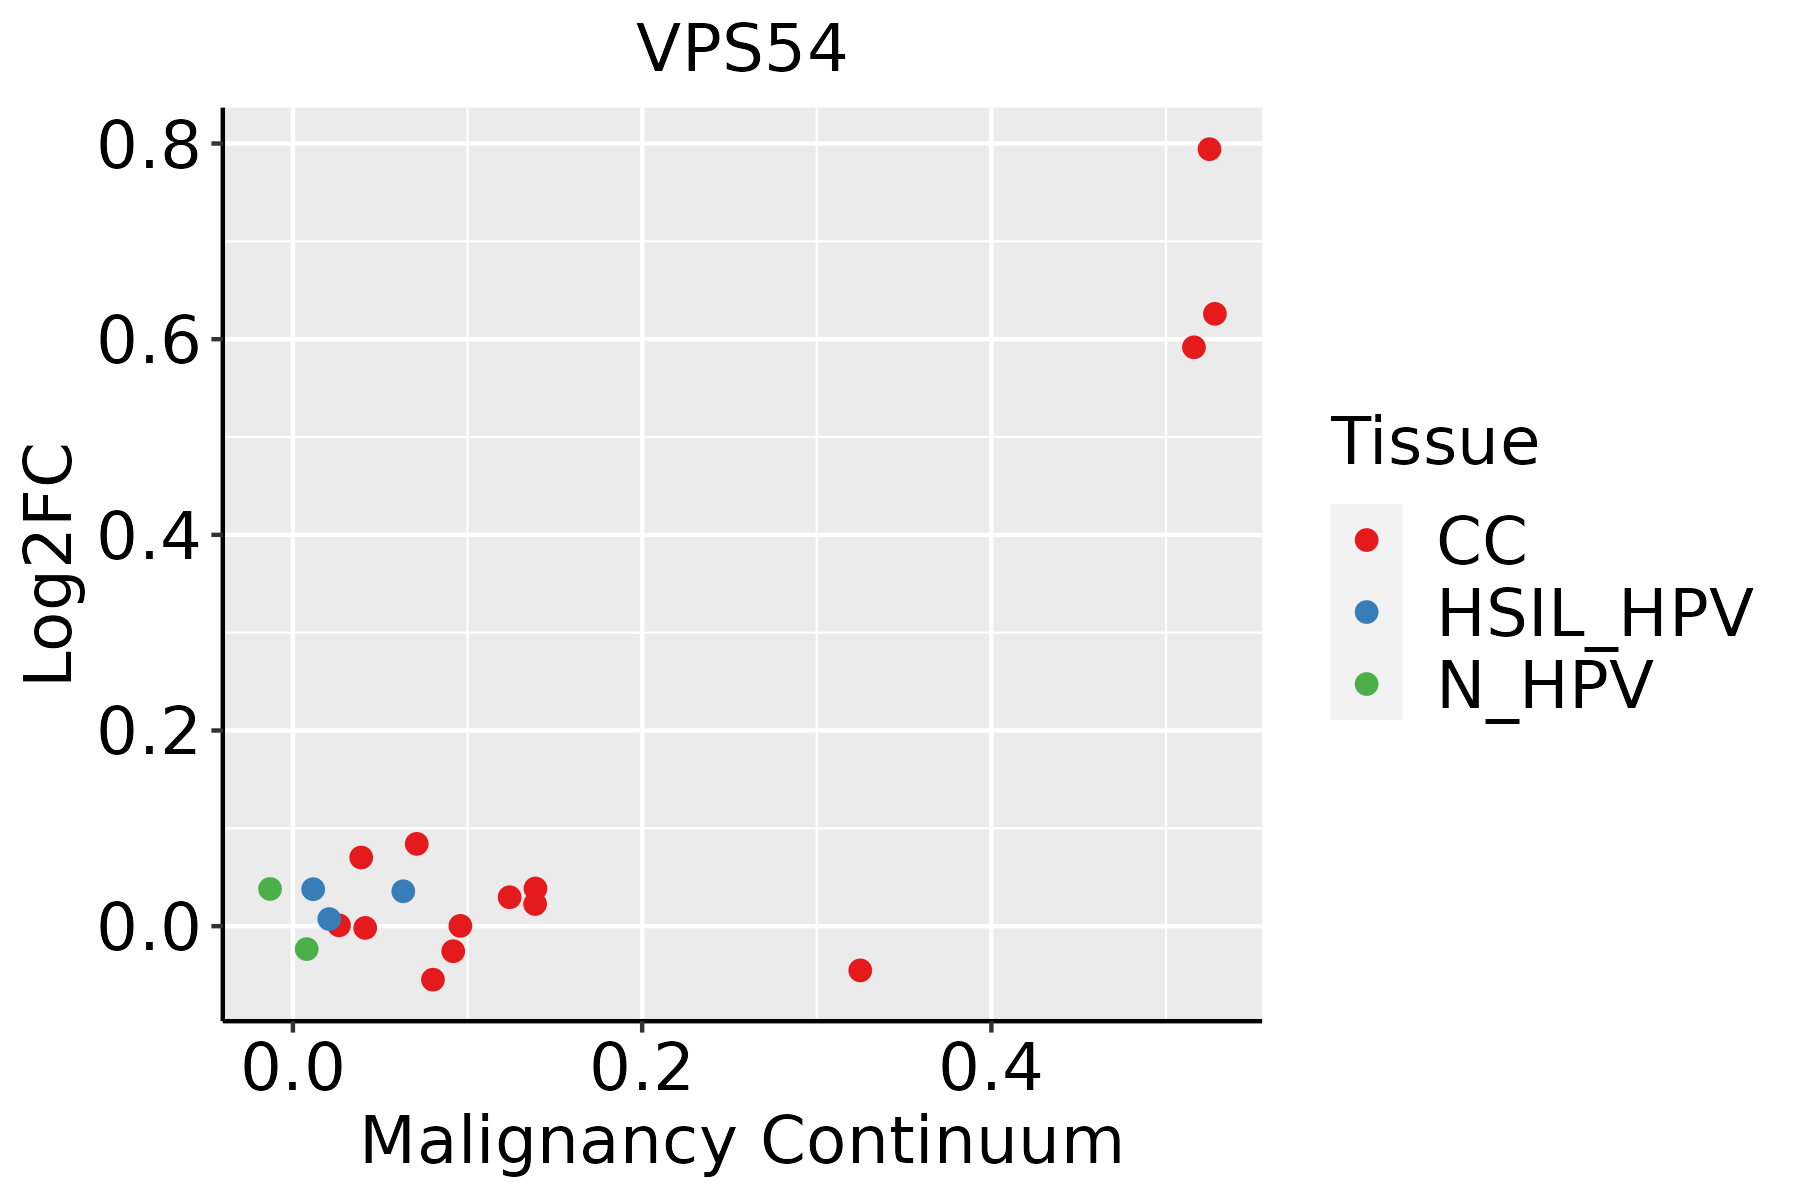 | CC: Cervix cancer |
| HSIL_HPV: HPV-infected high-grade squamous intraepithelial lesions | ||
| N_HPV: HPV-infected normal cervix | ||
| Colorectum (GSE201348) |  | FAP: Familial adenomatous polyposis |
| CRC: Colorectal cancer | ||
| Colorectum (HTA11) |  | AD: Adenomas |
| SER: Sessile serrated lesions | ||
| MSI-H: Microsatellite-high colorectal cancer | ||
| MSS: Microsatellite stable colorectal cancer |
| ∗log2FC in expression of this searched gene in stem-like cells from each diseased tissue sample relative to stem-like cells in normal samples in each tissue plotted against the malignancy continuum. Samples are colored based on if they are from different disease stage. |
Top |
Malignant transformation related pathway analysis |
| Find out the enriched GO biological processes and KEGG pathways involved in transition from healthy to precancer to cancer |
| Tissue | Disease Stage | Enriched GO biological Processes |
| Colorectum | AD |  |
| Colorectum | SER |  |
| Colorectum | MSS |  |
| Colorectum | MSI-H |  |
| Colorectum | FAP |  |
| ∗Top 15 enriched GO BP terms are showed in the bar plot of each disease state in each tissue. Each row represents a significant GO biological process which is colored according to the -log10(p.adjust). |
| Page: 1 2 3 4 5 6 7 8 9 |
| GO ID | Tissue | Disease Stage | Description | Gene Ratio | Bg Ratio | pvalue | p.adjust | Count |
| GO:004887210 | Cervix | CC | homeostasis of number of cells | 61/2311 | 272/18723 | 2.17e-06 | 6.55e-05 | 61 |
| GO:00018949 | Cervix | CC | tissue homeostasis | 57/2311 | 268/18723 | 2.43e-05 | 4.21e-04 | 57 |
| GO:00068927 | Cervix | CC | post-Golgi vesicle-mediated transport | 28/2311 | 104/18723 | 4.31e-05 | 6.61e-04 | 28 |
| GO:00602498 | Cervix | CC | anatomical structure homeostasis | 63/2311 | 314/18723 | 6.03e-05 | 8.68e-04 | 63 |
| GO:00161977 | Cervix | CC | endosomal transport | 48/2311 | 230/18723 | 1.65e-04 | 1.97e-03 | 48 |
| GO:00481938 | Cervix | CC | Golgi vesicle transport | 58/2311 | 296/18723 | 2.24e-04 | 2.54e-03 | 58 |
| GO:00070347 | Cervix | CC | vacuolar transport | 34/2311 | 157/18723 | 7.03e-04 | 6.40e-03 | 34 |
| GO:00451043 | Cervix | CC | intermediate filament cytoskeleton organization | 15/2311 | 51/18723 | 9.25e-04 | 7.84e-03 | 15 |
| GO:00451033 | Cervix | CC | intermediate filament-based process | 15/2311 | 52/18723 | 1.15e-03 | 9.39e-03 | 15 |
| GO:00164827 | Cervix | CC | cytosolic transport | 33/2311 | 168/18723 | 4.43e-03 | 2.70e-02 | 33 |
| GO:00070416 | Cervix | CC | lysosomal transport | 24/2311 | 114/18723 | 5.81e-03 | 3.33e-02 | 24 |
| GO:0048193 | Colorectum | AD | Golgi vesicle transport | 109/3918 | 296/18723 | 1.80e-10 | 1.68e-08 | 109 |
| GO:0016197 | Colorectum | AD | endosomal transport | 90/3918 | 230/18723 | 1.88e-10 | 1.73e-08 | 90 |
| GO:0016482 | Colorectum | AD | cytosolic transport | 68/3918 | 168/18723 | 6.00e-09 | 3.72e-07 | 68 |
| GO:0006892 | Colorectum | AD | post-Golgi vesicle-mediated transport | 45/3918 | 104/18723 | 2.22e-07 | 9.26e-06 | 45 |
| GO:0007034 | Colorectum | AD | vacuolar transport | 60/3918 | 157/18723 | 4.97e-07 | 1.85e-05 | 60 |
| GO:0048872 | Colorectum | AD | homeostasis of number of cells | 87/3918 | 272/18723 | 1.16e-05 | 2.61e-04 | 87 |
| GO:0042147 | Colorectum | AD | retrograde transport, endosome to Golgi | 37/3918 | 91/18723 | 1.46e-05 | 3.14e-04 | 37 |
| GO:0007041 | Colorectum | AD | lysosomal transport | 42/3918 | 114/18723 | 6.61e-05 | 1.07e-03 | 42 |
| GO:0060249 | Colorectum | AD | anatomical structure homeostasis | 94/3918 | 314/18723 | 9.37e-05 | 1.42e-03 | 94 |
| Page: 1 2 3 |
| Pathway ID | Tissue | Disease Stage | Description | Gene Ratio | Bg Ratio | pvalue | p.adjust | qvalue | Count |
| Page: 1 |
Top |
Cell-cell communication analysis |
| Identification of potential cell-cell interactions between two cell types and their ligand-receptor pairs for different disease states |
| Ligand | Receptor | LRpair | Pathway | Tissue | Disease Stage |
| Page: 1 |
Top |
Single-cell gene regulatory network inference analysis |
| Find out the significant the regulons (TFs) and the target genes of each regulon across cell types for different disease states |
| TF | Cell Type | Tissue | Disease Stage | Target Gene | RSS | Regulon Activity |
| ∗The dot plots of a searched regulon are shown for all cell subpopulations in each disease state of each tissue based on the regulon specific score inferred using pySCENIC and by calculating the average expression. |
| Page: 1 |
Top |
Somatic mutation of malignant transformation related genes |
| Annotation of somatic variants for genes involved in malignant transformation |
| Hugo Symbol | Variant Class | Variant Classification | dbSNP RS | HGVSc | HGVSp | HGVSp Short | SWISSPROT | BIOTYPE | SIFT | PolyPhen | Tumor Sample Barcode | Tissue | Histology | Sex | Age | Stage | Therapy Types | Drugs | Outcome |
| VPS54 | SNV | Missense_Mutation | novel | c.1042N>C | p.Lys348Gln | p.K348Q | Q9P1Q0 | protein_coding | deleterious(0.01) | probably_damaging(0.938) | TCGA-AN-A046-01 | Breast | breast invasive carcinoma | Female | >=65 | I/II | Unknown | Unknown | SD |
| VPS54 | SNV | Missense_Mutation | rs368681209 | c.1789N>G | p.Asn597Asp | p.N597D | Q9P1Q0 | protein_coding | tolerated(0.23) | benign(0.021) | TCGA-B6-A0WV-01 | Breast | breast invasive carcinoma | Female | >=65 | I/II | Unknown | Unknown | SD |
| VPS54 | SNV | Missense_Mutation | c.1771G>C | p.Glu591Gln | p.E591Q | Q9P1Q0 | protein_coding | deleterious(0.01) | probably_damaging(0.925) | TCGA-BH-A18P-01 | Breast | breast invasive carcinoma | Female | <65 | I/II | Unknown | Unknown | PD | |
| VPS54 | SNV | Missense_Mutation | c.2134N>G | p.Lys712Glu | p.K712E | Q9P1Q0 | protein_coding | tolerated(0.65) | benign(0.009) | TCGA-C8-A135-01 | Breast | breast invasive carcinoma | Female | <65 | I/II | Chemotherapy | 5-fluorouracil | CR | |
| VPS54 | SNV | Missense_Mutation | c.1576N>A | p.Glu526Lys | p.E526K | Q9P1Q0 | protein_coding | tolerated(0.05) | benign(0.036) | TCGA-D8-A1J8-01 | Breast | breast invasive carcinoma | Female | >=65 | I/II | Hormone Therapy | nolvadex | SD | |
| VPS54 | insertion | In_Frame_Ins | novel | c.513_514insATTGTGTTAGCTAATATA | p.Phe171_Ala172insIleValLeuAlaAsnIle | p.F171_A172insIVLANI | Q9P1Q0 | protein_coding | TCGA-AR-A0U0-01 | Breast | breast invasive carcinoma | Female | >=65 | I/II | Unknown | Unknown | SD | ||
| VPS54 | insertion | Frame_Shift_Ins | novel | c.781_782insCAGTGCCTGTCCTGGTGGAGGTGGTGGGGGATGCAGTGGACTTTGTG | p.Gln261ProfsTer21 | p.Q261Pfs*21 | Q9P1Q0 | protein_coding | TCGA-AR-A256-01 | Breast | breast invasive carcinoma | Female | <65 | I/II | Chemotherapy | doxorubicin | PD | ||
| VPS54 | SNV | Missense_Mutation | novel | c.2011T>C | p.Phe671Leu | p.F671L | Q9P1Q0 | protein_coding | deleterious(0.01) | probably_damaging(0.994) | TCGA-2W-A8YY-01 | Cervix | cervical & endocervical cancer | Female | <65 | I/II | Chemotherapy | cisplatin | CR |
| VPS54 | SNV | Missense_Mutation | novel | c.130N>A | p.Pro44Thr | p.P44T | Q9P1Q0 | protein_coding | deleterious_low_confidence(0) | probably_damaging(0.997) | TCGA-EA-A3HU-01 | Cervix | cervical & endocervical cancer | Female | <65 | I/II | Unknown | Unknown | SD |
| VPS54 | SNV | Missense_Mutation | rs781463602 | c.1595N>C | p.Val532Ala | p.V532A | Q9P1Q0 | protein_coding | tolerated(0.59) | benign(0) | TCGA-5M-AAT6-01 | Colorectum | colon adenocarcinoma | Female | <65 | III/IV | Unknown | Unknown | PD |
| Page: 1 2 3 4 5 6 7 8 9 |
Top |
Related drugs of malignant transformation related genes |
| Identification of chemicals and drugs interact with genes involved in malignant transfromation |
| (DGIdb 4.0) |
| Entrez ID | Symbol | Category | Interaction Types | Drug Claim Name | Drug Name | PMIDs |
| Page: 1 |

Copyright 2023-Present -The University of Texas Health Science Center at Houston |