
|
|||||
|
 | |
| |
| |
| |
| |
| |
|
Gene: VPS53 |
Gene summary for VPS53 |
| Gene information | Species | Human | Gene symbol | VPS53 | Gene ID | 55275 |
| Gene name | VPS53 subunit of GARP complex | |
| Gene Alias | HCCS1 | |
| Cytomap | 17p13.3 | |
| Gene Type | protein-coding | GO ID | GO:0006810 | UniProtAcc | B3KS06 |
Top |
Malignant transformation analysis |
| Identification of the aberrant gene expression in precancerous and cancerous lesions by comparing the gene expression of stem-like cells in diseased tissues with normal stem cells |
| Entrez ID | Symbol | Replicates | Species | Organ | Tissue | Adj P-value | Log2FC | Malignancy |
| 55275 | VPS53 | CCI_1 | Human | Cervix | CC | 7.73e-05 | 7.96e-01 | 0.528 |
| 55275 | VPS53 | CCI_2 | Human | Cervix | CC | 1.57e-06 | 1.00e+00 | 0.5249 |
| 55275 | VPS53 | HTA11_3410_2000001011 | Human | Colorectum | AD | 6.09e-12 | -4.51e-01 | 0.0155 |
| 55275 | VPS53 | HTA11_3361_2000001011 | Human | Colorectum | AD | 2.22e-03 | -3.33e-01 | -0.1207 |
| 55275 | VPS53 | HTA11_5212_2000001011 | Human | Colorectum | AD | 4.93e-02 | -4.37e-01 | -0.2061 |
| 55275 | VPS53 | HTA11_866_3004761011 | Human | Colorectum | AD | 3.69e-02 | -2.34e-01 | 0.096 |
| 55275 | VPS53 | HTA11_99999971662_82457 | Human | Colorectum | MSS | 7.22e-07 | -3.80e-01 | 0.3859 |
| 55275 | VPS53 | HTA11_99999973899_84307 | Human | Colorectum | MSS | 1.71e-04 | -5.11e-01 | 0.2585 |
| 55275 | VPS53 | F007 | Human | Colorectum | FAP | 7.59e-05 | -2.78e-01 | 0.1176 |
| 55275 | VPS53 | A001-C-207 | Human | Colorectum | FAP | 1.40e-06 | -1.97e-01 | 0.1278 |
| 55275 | VPS53 | A015-C-203 | Human | Colorectum | FAP | 1.92e-25 | -4.19e-01 | -0.1294 |
| 55275 | VPS53 | A015-C-204 | Human | Colorectum | FAP | 5.70e-09 | -2.45e-01 | -0.0228 |
| 55275 | VPS53 | A014-C-040 | Human | Colorectum | FAP | 1.03e-06 | -3.21e-01 | -0.1184 |
| 55275 | VPS53 | A002-C-201 | Human | Colorectum | FAP | 1.51e-14 | -2.46e-01 | 0.0324 |
| 55275 | VPS53 | A002-C-203 | Human | Colorectum | FAP | 4.36e-04 | -1.81e-02 | 0.2786 |
| 55275 | VPS53 | A001-C-119 | Human | Colorectum | FAP | 1.70e-08 | -3.68e-01 | -0.1557 |
| 55275 | VPS53 | A001-C-108 | Human | Colorectum | FAP | 9.43e-16 | -1.24e-01 | -0.0272 |
| 55275 | VPS53 | A002-C-205 | Human | Colorectum | FAP | 4.36e-26 | -1.71e-01 | -0.1236 |
| 55275 | VPS53 | A015-C-005 | Human | Colorectum | FAP | 1.17e-03 | -7.65e-02 | -0.0336 |
| 55275 | VPS53 | A015-C-006 | Human | Colorectum | FAP | 1.75e-17 | -1.76e-01 | -0.0994 |
| Page: 1 2 3 4 5 6 7 |
| Tissue | Expression Dynamics | Abbreviation |
| Cervix | 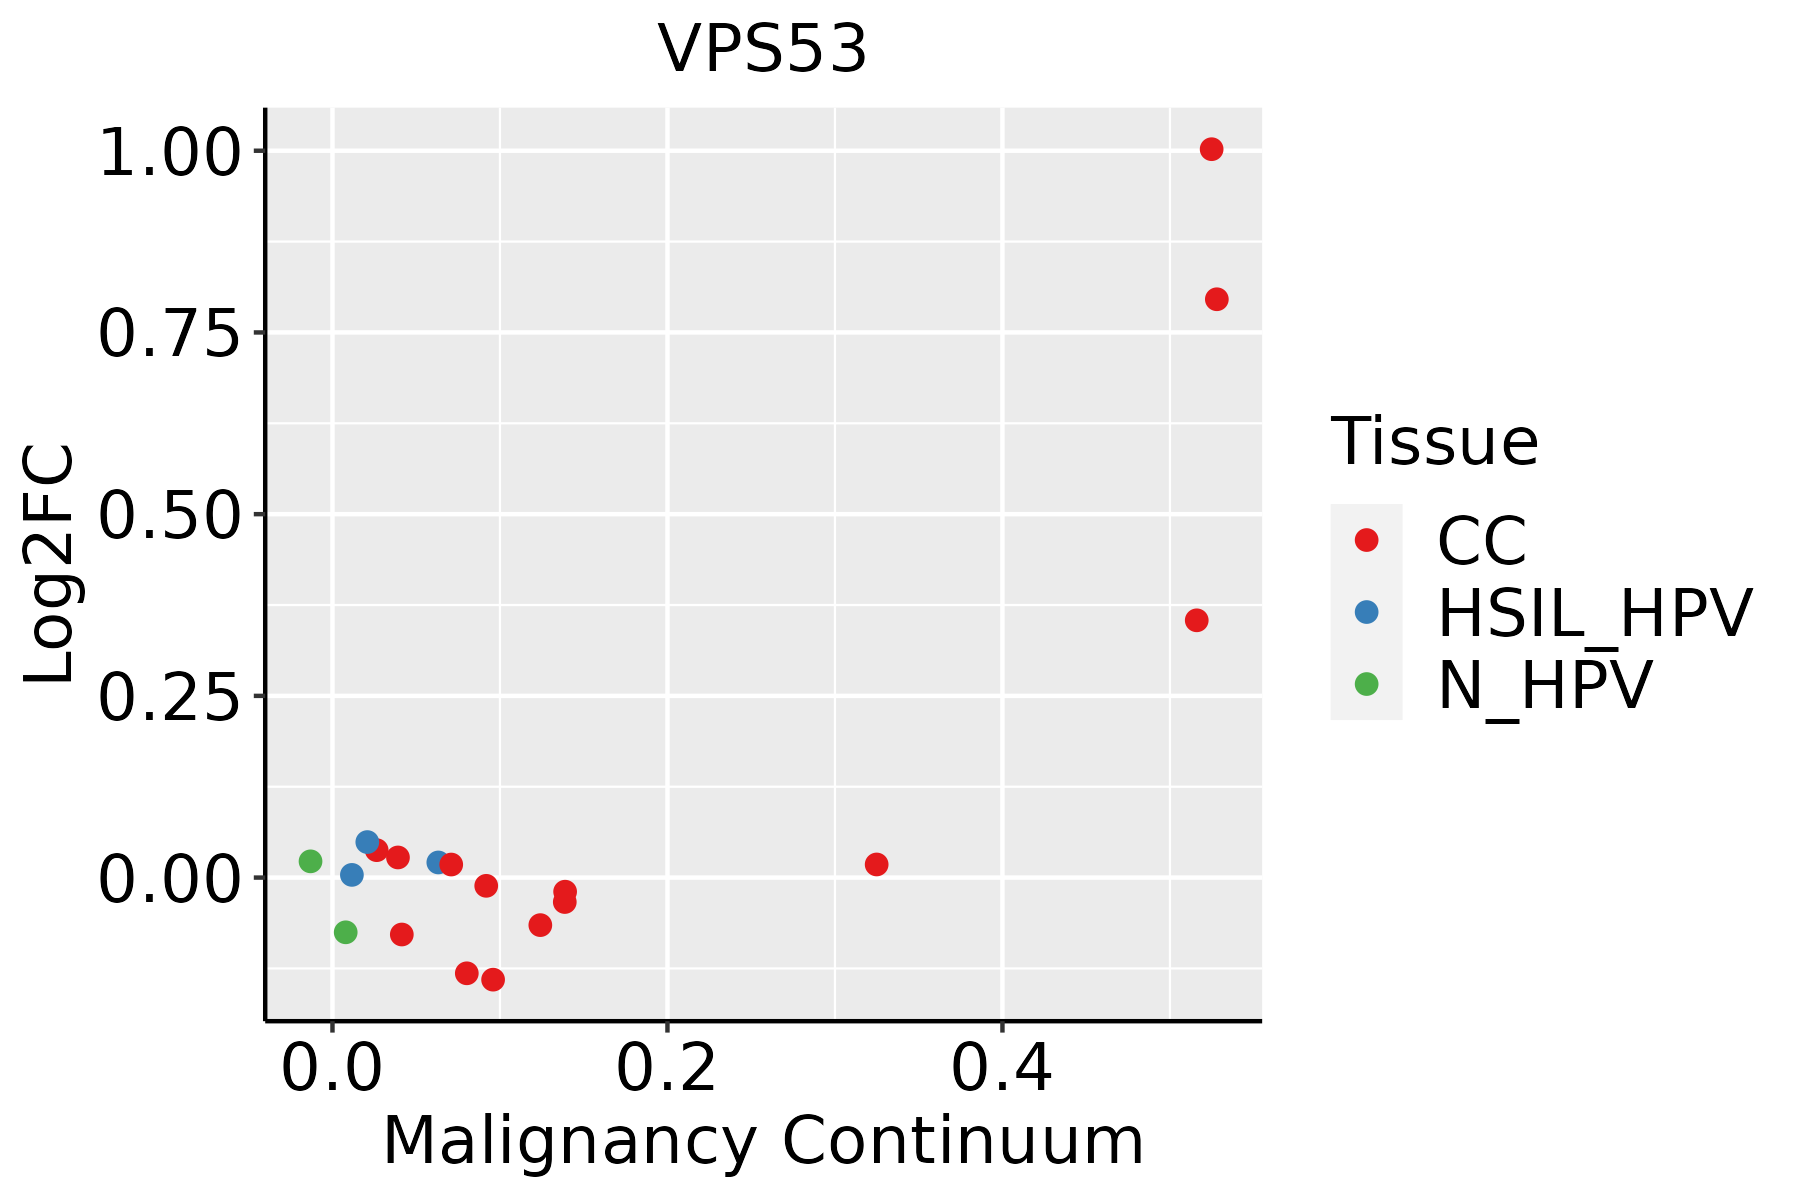 | CC: Cervix cancer |
| HSIL_HPV: HPV-infected high-grade squamous intraepithelial lesions | ||
| N_HPV: HPV-infected normal cervix | ||
| Colorectum (GSE201348) | 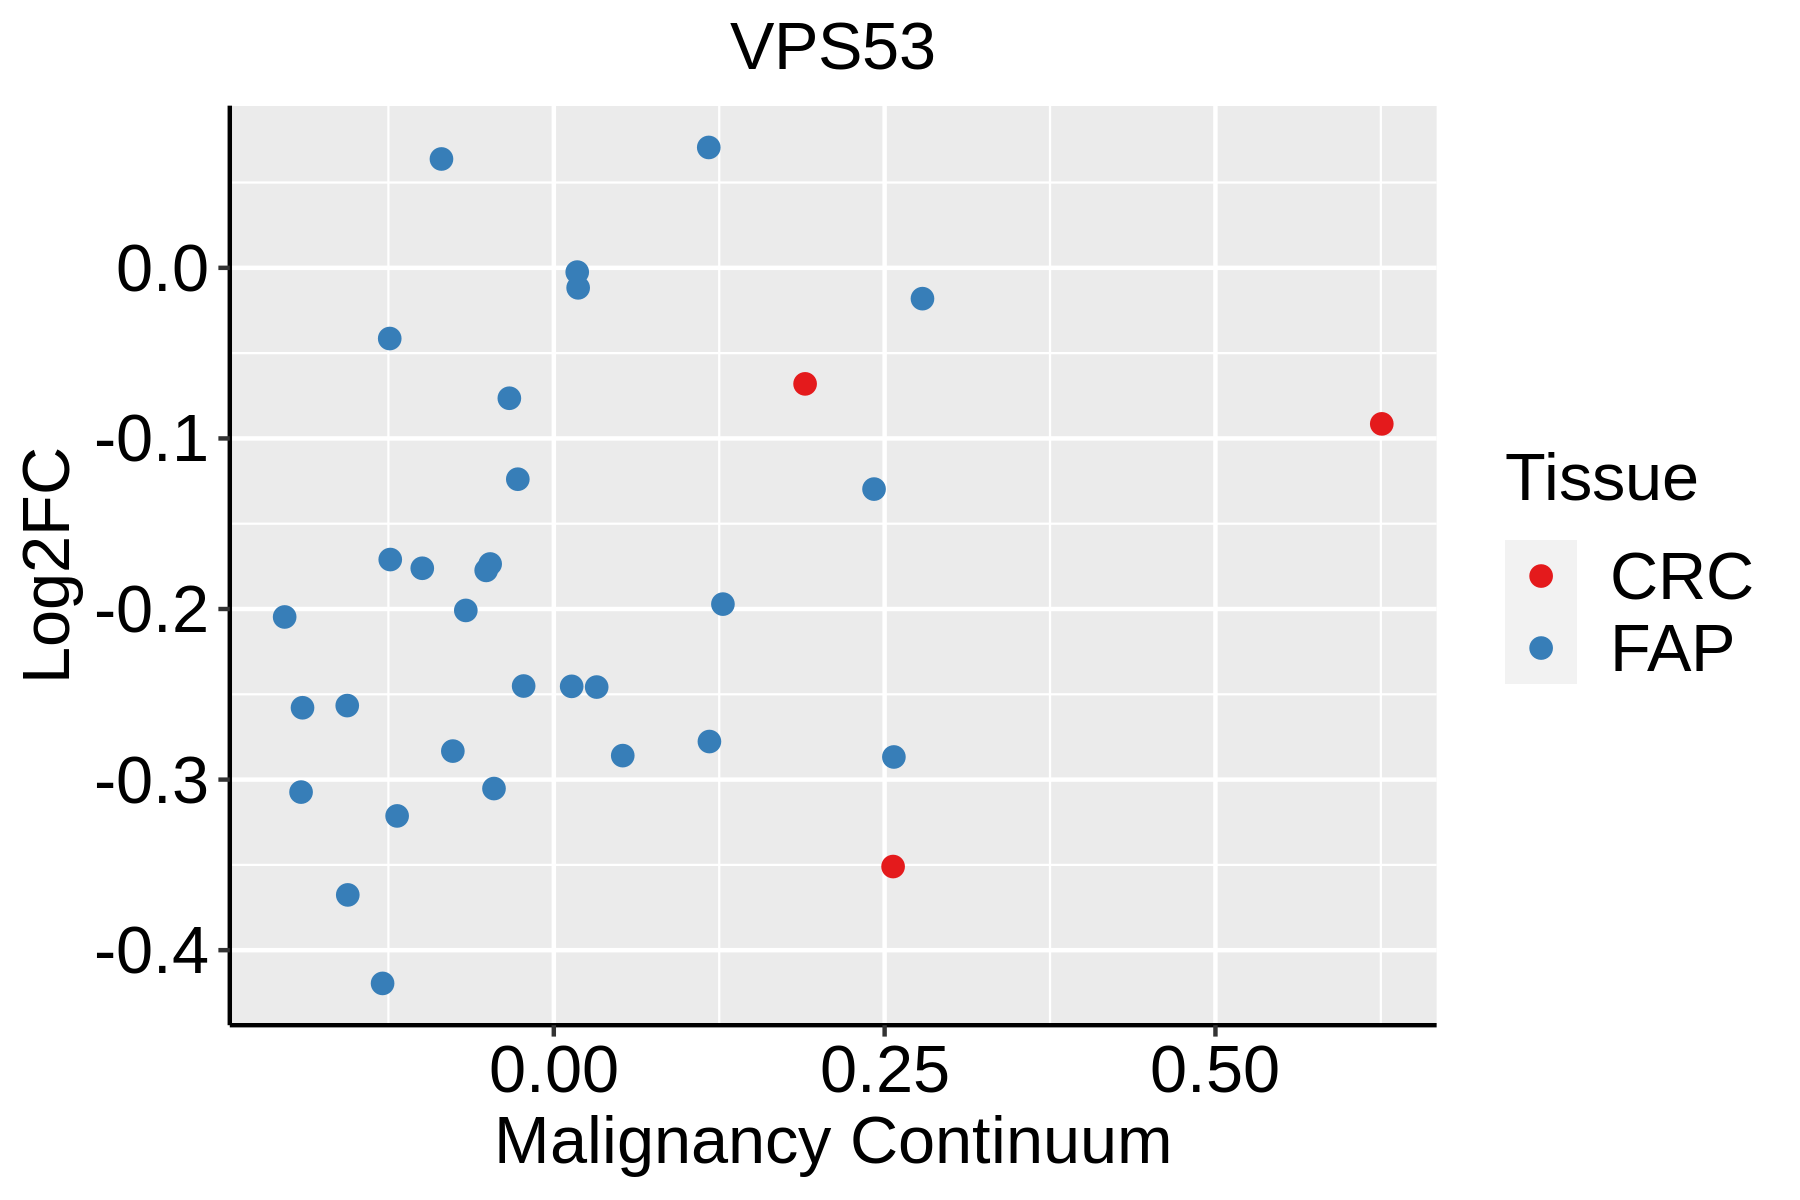 | FAP: Familial adenomatous polyposis |
| CRC: Colorectal cancer | ||
| Colorectum (HTA11) |  | AD: Adenomas |
| SER: Sessile serrated lesions | ||
| MSI-H: Microsatellite-high colorectal cancer | ||
| MSS: Microsatellite stable colorectal cancer | ||
| Esophagus | 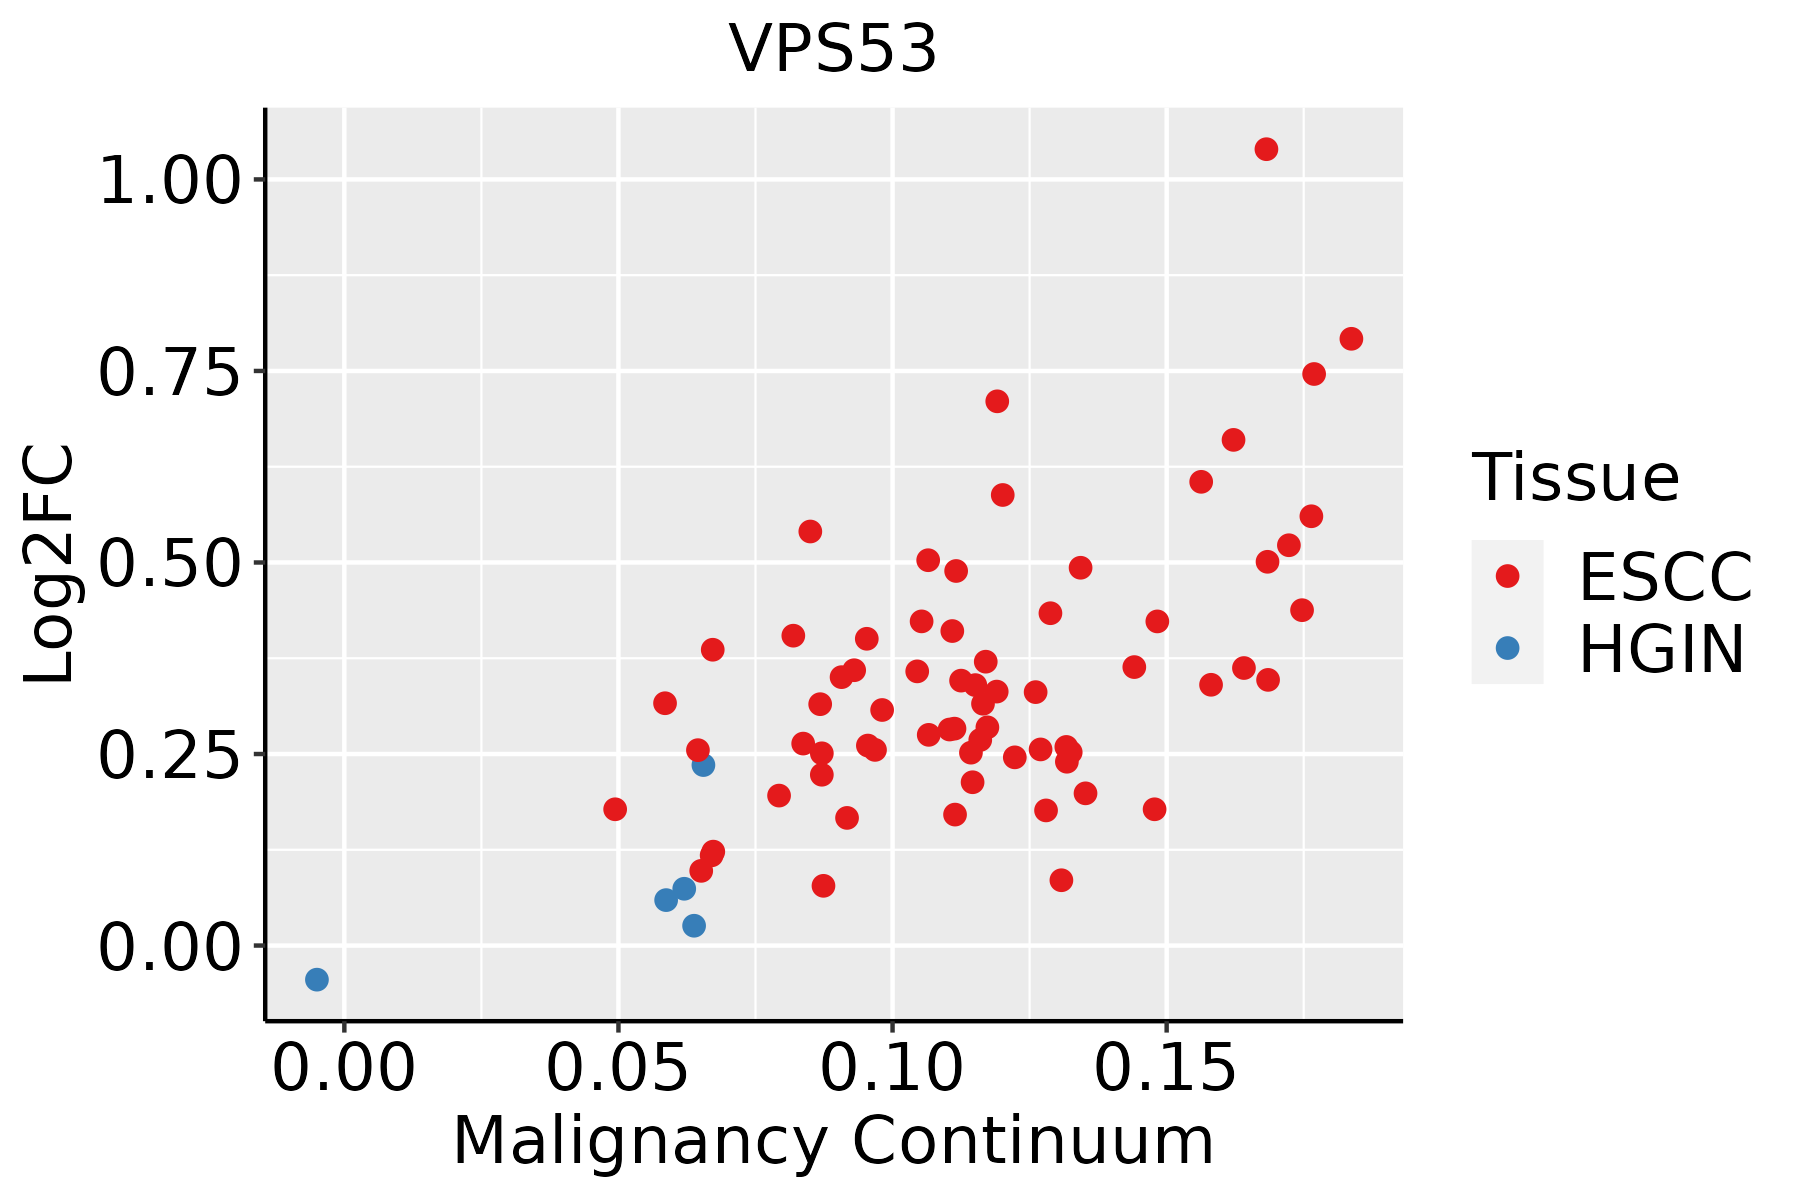 | ESCC: Esophageal squamous cell carcinoma |
| HGIN: High-grade intraepithelial neoplasias | ||
| LGIN: Low-grade intraepithelial neoplasias | ||
| Liver | 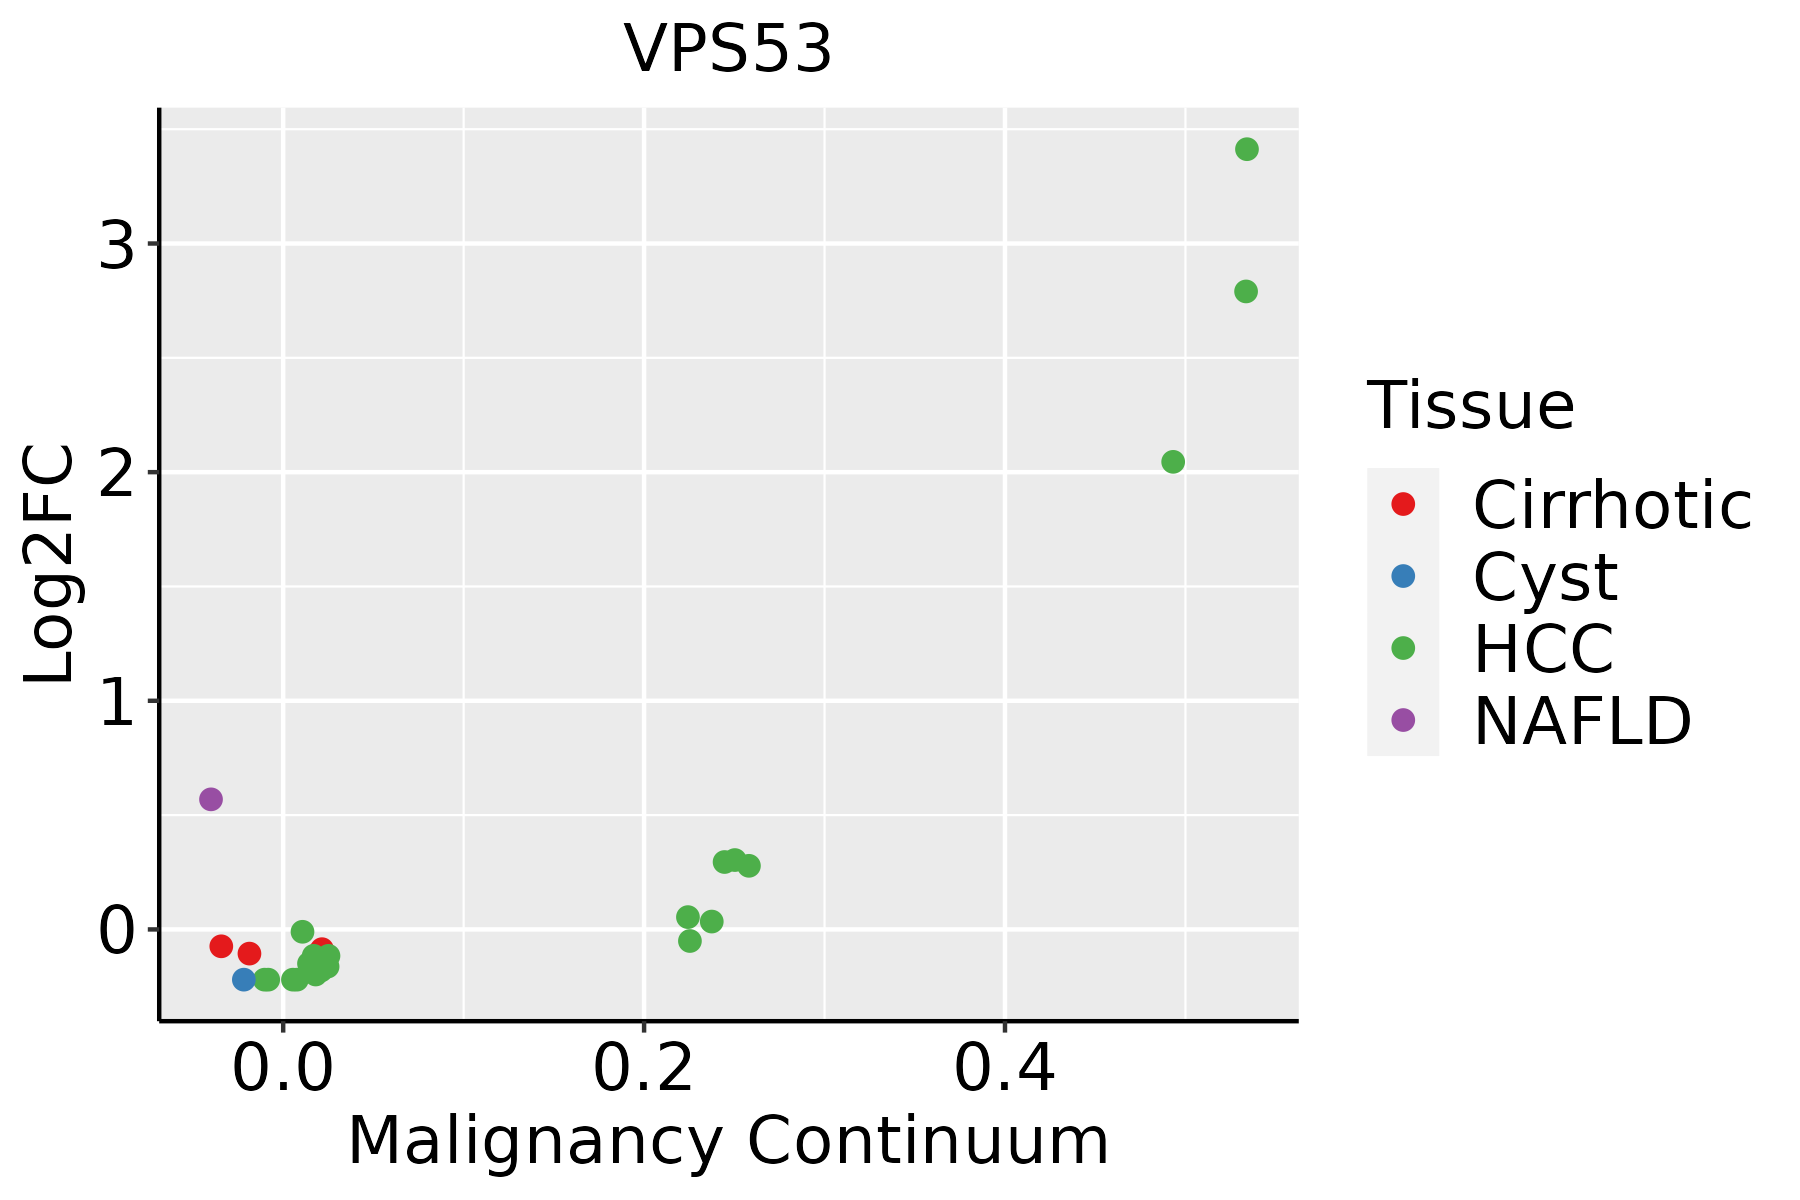 | HCC: Hepatocellular carcinoma |
| NAFLD: Non-alcoholic fatty liver disease | ||
| Lung | 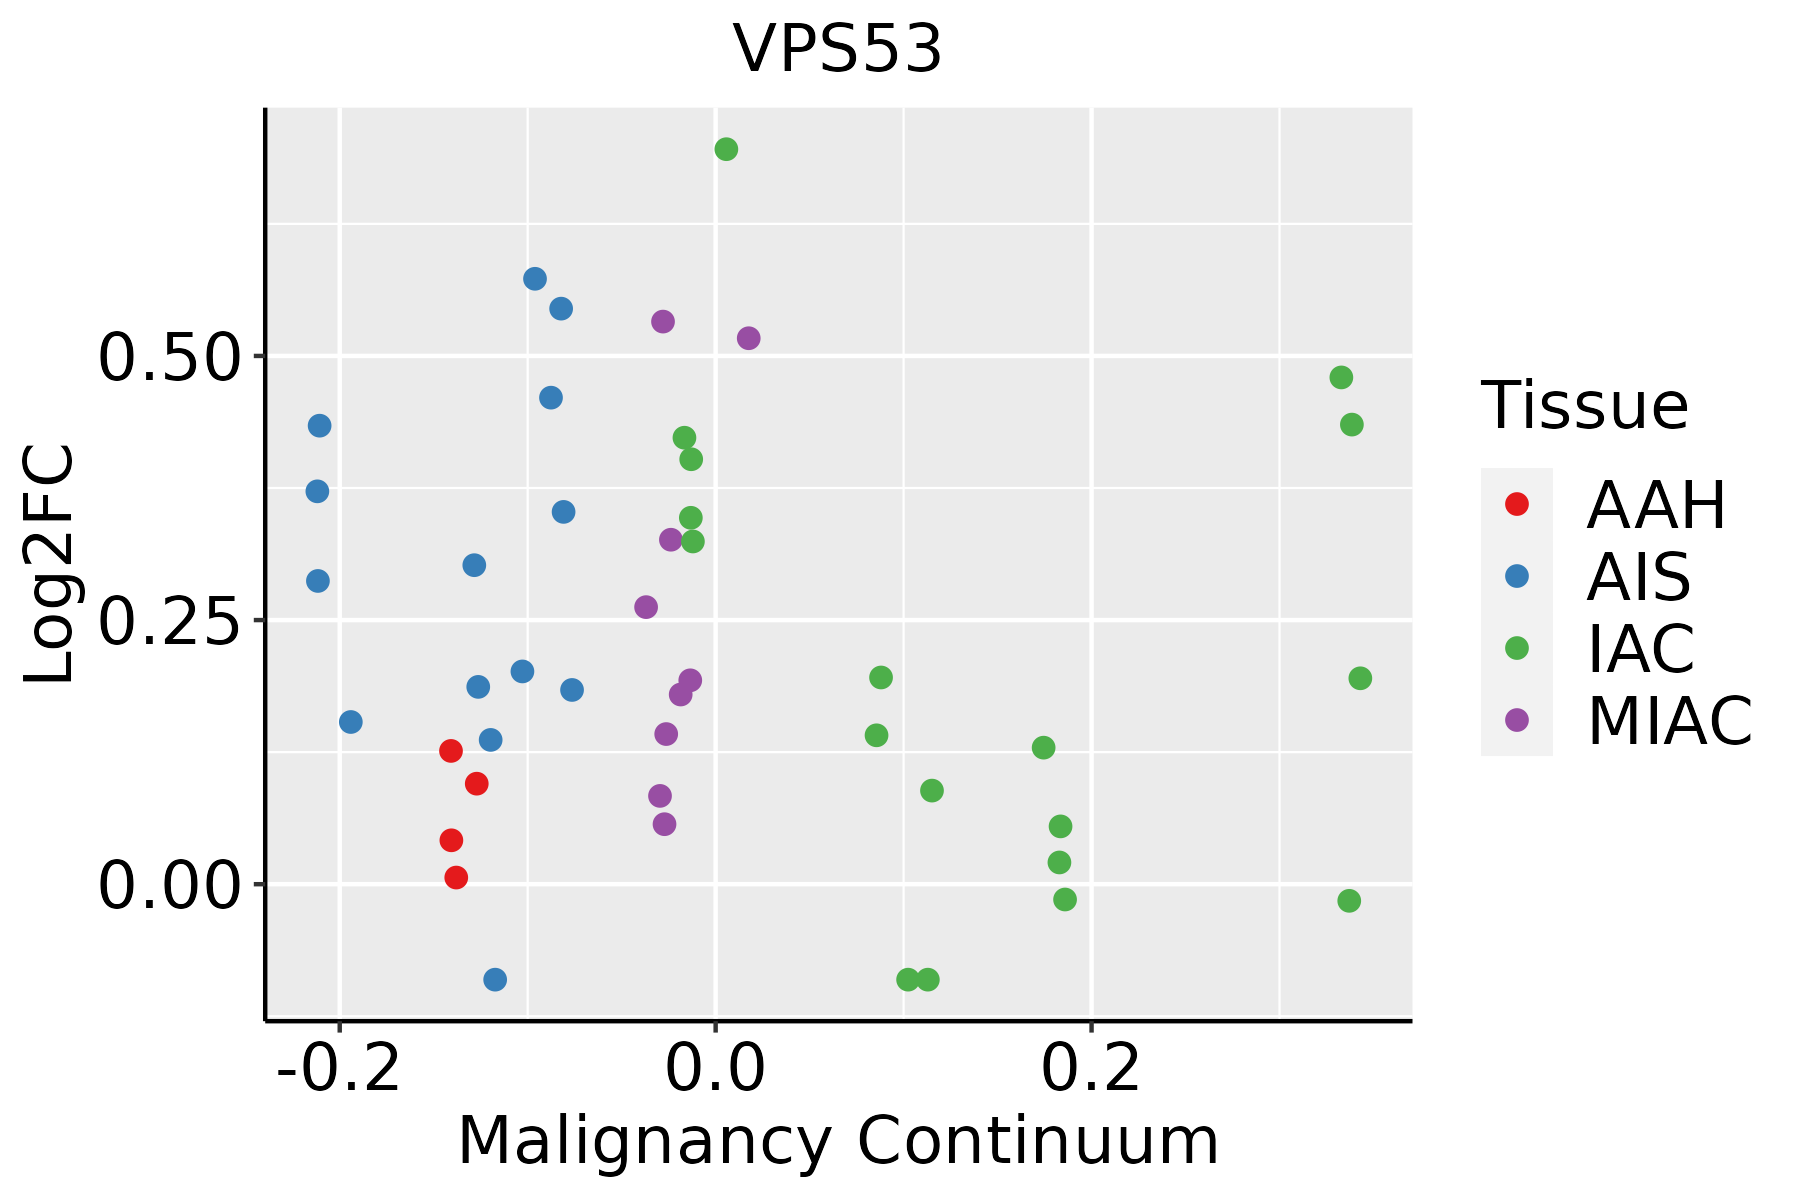 | AAH: Atypical adenomatous hyperplasia |
| AIS: Adenocarcinoma in situ | ||
| IAC: Invasive lung adenocarcinoma | ||
| MIA: Minimally invasive adenocarcinoma | ||
| Thyroid | 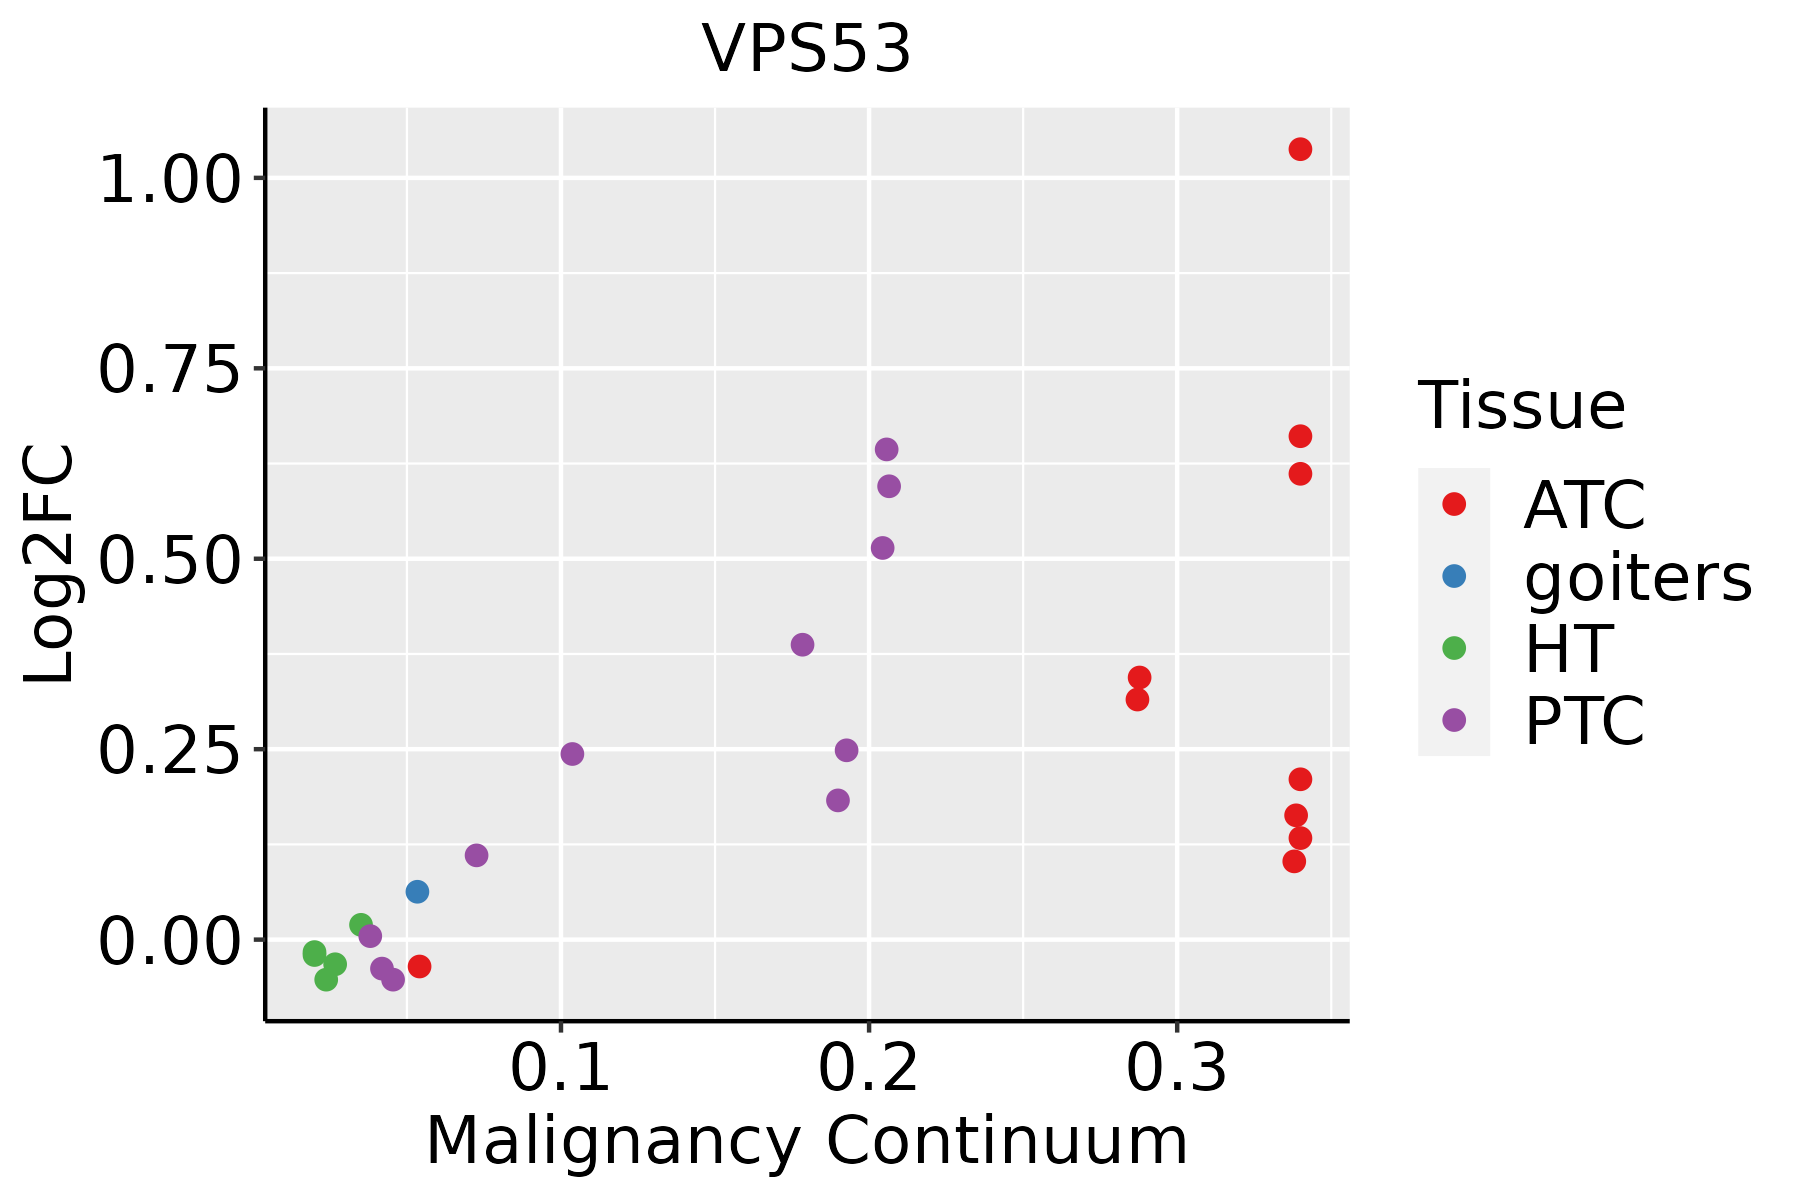 | ATC: Anaplastic thyroid cancer |
| HT: Hashimoto's thyroiditis | ||
| PTC: Papillary thyroid cancer |
| ∗log2FC in expression of this searched gene in stem-like cells from each diseased tissue sample relative to stem-like cells in normal samples in each tissue plotted against the malignancy continuum. Samples are colored based on if they are from different disease stage. |
Top |
Malignant transformation related pathway analysis |
| Find out the enriched GO biological processes and KEGG pathways involved in transition from healthy to precancer to cancer |
| Tissue | Disease Stage | Enriched GO biological Processes |
| Colorectum | AD |  |
| Colorectum | SER |  |
| Colorectum | MSS |  |
| Colorectum | MSI-H |  |
| Colorectum | FAP |  |
| ∗Top 15 enriched GO BP terms are showed in the bar plot of each disease state in each tissue. Each row represents a significant GO biological process which is colored according to the -log10(p.adjust). |
| Page: 1 2 3 4 5 6 7 8 9 |
| GO ID | Tissue | Disease Stage | Description | Gene Ratio | Bg Ratio | pvalue | p.adjust | Count |
| GO:00988767 | Cervix | CC | vesicle-mediated transport to the plasma membrane | 34/2311 | 136/18723 | 3.75e-05 | 5.91e-04 | 34 |
| GO:00161977 | Cervix | CC | endosomal transport | 48/2311 | 230/18723 | 1.65e-04 | 1.97e-03 | 48 |
| GO:00070347 | Cervix | CC | vacuolar transport | 34/2311 | 157/18723 | 7.03e-04 | 6.40e-03 | 34 |
| GO:00164827 | Cervix | CC | cytosolic transport | 33/2311 | 168/18723 | 4.43e-03 | 2.70e-02 | 33 |
| GO:00070416 | Cervix | CC | lysosomal transport | 24/2311 | 114/18723 | 5.81e-03 | 3.33e-02 | 24 |
| GO:0016197 | Colorectum | AD | endosomal transport | 90/3918 | 230/18723 | 1.88e-10 | 1.73e-08 | 90 |
| GO:0016482 | Colorectum | AD | cytosolic transport | 68/3918 | 168/18723 | 6.00e-09 | 3.72e-07 | 68 |
| GO:0098876 | Colorectum | AD | vesicle-mediated transport to the plasma membrane | 57/3918 | 136/18723 | 2.30e-08 | 1.27e-06 | 57 |
| GO:0007034 | Colorectum | AD | vacuolar transport | 60/3918 | 157/18723 | 4.97e-07 | 1.85e-05 | 60 |
| GO:0042147 | Colorectum | AD | retrograde transport, endosome to Golgi | 37/3918 | 91/18723 | 1.46e-05 | 3.14e-04 | 37 |
| GO:0007041 | Colorectum | AD | lysosomal transport | 42/3918 | 114/18723 | 6.61e-05 | 1.07e-03 | 42 |
| GO:0032456 | Colorectum | AD | endocytic recycling | 28/3918 | 73/18723 | 4.87e-04 | 5.30e-03 | 28 |
| GO:00988762 | Colorectum | MSS | vesicle-mediated transport to the plasma membrane | 54/3467 | 136/18723 | 6.20e-09 | 3.95e-07 | 54 |
| GO:00161972 | Colorectum | MSS | endosomal transport | 79/3467 | 230/18723 | 7.04e-09 | 4.39e-07 | 79 |
| GO:00164822 | Colorectum | MSS | cytosolic transport | 59/3467 | 168/18723 | 2.29e-07 | 9.79e-06 | 59 |
| GO:00070342 | Colorectum | MSS | vacuolar transport | 52/3467 | 157/18723 | 8.25e-06 | 2.07e-04 | 52 |
| GO:00421471 | Colorectum | MSS | retrograde transport, endosome to Golgi | 33/3467 | 91/18723 | 4.78e-05 | 8.71e-04 | 33 |
| GO:00324561 | Colorectum | MSS | endocytic recycling | 26/3467 | 73/18723 | 4.05e-04 | 4.99e-03 | 26 |
| GO:00070411 | Colorectum | MSS | lysosomal transport | 36/3467 | 114/18723 | 5.38e-04 | 6.04e-03 | 36 |
| GO:00988763 | Colorectum | FAP | vesicle-mediated transport to the plasma membrane | 42/2622 | 136/18723 | 3.16e-07 | 1.78e-05 | 42 |
| Page: 1 2 3 4 |
| Pathway ID | Tissue | Disease Stage | Description | Gene Ratio | Bg Ratio | pvalue | p.adjust | qvalue | Count |
| Page: 1 |
Top |
Cell-cell communication analysis |
| Identification of potential cell-cell interactions between two cell types and their ligand-receptor pairs for different disease states |
| Ligand | Receptor | LRpair | Pathway | Tissue | Disease Stage |
| Page: 1 |
Top |
Single-cell gene regulatory network inference analysis |
| Find out the significant the regulons (TFs) and the target genes of each regulon across cell types for different disease states |
| TF | Cell Type | Tissue | Disease Stage | Target Gene | RSS | Regulon Activity |
| ∗The dot plots of a searched regulon are shown for all cell subpopulations in each disease state of each tissue based on the regulon specific score inferred using pySCENIC and by calculating the average expression. |
| Page: 1 |
Top |
Somatic mutation of malignant transformation related genes |
| Annotation of somatic variants for genes involved in malignant transformation |
| Hugo Symbol | Variant Class | Variant Classification | dbSNP RS | HGVSc | HGVSp | HGVSp Short | SWISSPROT | BIOTYPE | SIFT | PolyPhen | Tumor Sample Barcode | Tissue | Histology | Sex | Age | Stage | Therapy Types | Drugs | Outcome |
| VPS53 | SNV | Missense_Mutation | c.1309N>T | p.Asp437Tyr | p.D437Y | Q5VIR6 | protein_coding | deleterious(0) | probably_damaging(0.999) | TCGA-AR-A0U3-01 | Breast | breast invasive carcinoma | Female | <65 | I/II | Chemotherapy | doxorubicin | SD | |
| VPS53 | SNV | Missense_Mutation | novel | c.1405C>A | p.Pro469Thr | p.P469T | Q5VIR6 | protein_coding | deleterious(0) | possibly_damaging(0.894) | TCGA-AR-A24O-01 | Breast | breast invasive carcinoma | Female | <65 | III/IV | Chemotherapy | cytoxan | PD |
| VPS53 | SNV | Missense_Mutation | novel | c.364N>C | p.Glu122Gln | p.E122Q | Q5VIR6 | protein_coding | deleterious(0) | probably_damaging(1) | TCGA-BH-A2L8-01 | Breast | breast invasive carcinoma | Female | <65 | I/II | Chemotherapy | cytoxan | CR |
| VPS53 | SNV | Missense_Mutation | novel | c.2404N>A | p.Glu802Lys | p.E802K | Q5VIR6 | protein_coding | tolerated(0.64) | benign(0.117) | TCGA-D8-A27V-01 | Breast | breast invasive carcinoma | Female | <65 | I/II | Hormone Therapy | tamoxiphen | SD |
| VPS53 | SNV | Missense_Mutation | c.577N>A | p.Gly193Arg | p.G193R | Q5VIR6 | protein_coding | tolerated(0.17) | possibly_damaging(0.446) | TCGA-E9-A1RH-01 | Breast | breast invasive carcinoma | Female | <65 | I/II | Chemotherapy | 5-fluorouracil | SD | |
| VPS53 | SNV | Missense_Mutation | c.1333N>A | p.Asp445Asn | p.D445N | Q5VIR6 | protein_coding | tolerated(0.14) | benign(0.167) | TCGA-E9-A226-01 | Breast | breast invasive carcinoma | Female | <65 | III/IV | Hormone Therapy | tamoxiphen | PD | |
| VPS53 | SNV | Missense_Mutation | novel | c.1860N>A | p.Met620Ile | p.M620I | Q5VIR6 | protein_coding | deleterious(0.03) | possibly_damaging(0.58) | TCGA-C5-A2LZ-01 | Cervix | cervical & endocervical cancer | Female | >=65 | III/IV | Unknown | Unknown | PD |
| VPS53 | SNV | Missense_Mutation | rs774768457 | c.7N>C | p.Glu3Gln | p.E3Q | Q5VIR6 | protein_coding | tolerated_low_confidence(0.13) | benign(0.206) | TCGA-VS-A8QH-01 | Cervix | cervical & endocervical cancer | Female | >=65 | I/II | Chemotherapy | gemcitabine | PD |
| VPS53 | SNV | Missense_Mutation | rs759207499 | c.388N>T | p.Arg130Cys | p.R130C | Q5VIR6 | protein_coding | deleterious(0.03) | probably_damaging(0.996) | TCGA-A6-6781-01 | Colorectum | colon adenocarcinoma | Male | <65 | III/IV | Chemotherapy | oxaliplatin | SD |
| VPS53 | SNV | Missense_Mutation | rs774347992 | c.2204N>A | p.Arg735Gln | p.R735Q | Q5VIR6 | protein_coding | deleterious(0.03) | benign(0.31) | TCGA-AA-3864-01 | Colorectum | colon adenocarcinoma | Male | >=65 | I/II | Unknown | Unknown | SD |
| Page: 1 2 3 4 5 6 7 |
Top |
Related drugs of malignant transformation related genes |
| Identification of chemicals and drugs interact with genes involved in malignant transfromation |
| (DGIdb 4.0) |
| Entrez ID | Symbol | Category | Interaction Types | Drug Claim Name | Drug Name | PMIDs |
| Page: 1 |

Copyright 2023-Present -The University of Texas Health Science Center at Houston |