
|
|||||
|
 | |
| |
| |
| |
| |
| |
|
Gene: VPS50 |
Gene summary for VPS50 |
| Gene information | Species | Human | Gene symbol | VPS50 | Gene ID | 55610 |
| Gene name | VPS50 subunit of EARP/GARPII complex | |
| Gene Alias | CCDC132 | |
| Cytomap | 7q21.2-q21.3 | |
| Gene Type | protein-coding | GO ID | GO:0006810 | UniProtAcc | Q96JG6 |
Top |
Malignant transformation analysis |
| Identification of the aberrant gene expression in precancerous and cancerous lesions by comparing the gene expression of stem-like cells in diseased tissues with normal stem cells |
| Entrez ID | Symbol | Replicates | Species | Organ | Tissue | Adj P-value | Log2FC | Malignancy |
| 55610 | VPS50 | CCI_1 | Human | Cervix | CC | 1.42e-06 | 6.32e-01 | 0.528 |
| 55610 | VPS50 | CCI_2 | Human | Cervix | CC | 1.33e-06 | 5.93e-01 | 0.5249 |
| 55610 | VPS50 | CCI_3 | Human | Cervix | CC | 7.97e-04 | 4.30e-01 | 0.516 |
| 55610 | VPS50 | LZE4T | Human | Esophagus | ESCC | 1.79e-04 | 1.83e-01 | 0.0811 |
| 55610 | VPS50 | LZE20T | Human | Esophagus | ESCC | 1.84e-03 | 1.56e-01 | 0.0662 |
| 55610 | VPS50 | LZE24T | Human | Esophagus | ESCC | 2.88e-08 | 2.13e-01 | 0.0596 |
| 55610 | VPS50 | P2T-E | Human | Esophagus | ESCC | 3.32e-16 | 2.55e-01 | 0.1177 |
| 55610 | VPS50 | P4T-E | Human | Esophagus | ESCC | 9.06e-05 | 1.77e-01 | 0.1323 |
| 55610 | VPS50 | P5T-E | Human | Esophagus | ESCC | 3.97e-03 | 4.37e-02 | 0.1327 |
| 55610 | VPS50 | P8T-E | Human | Esophagus | ESCC | 1.56e-10 | 1.71e-01 | 0.0889 |
| 55610 | VPS50 | P10T-E | Human | Esophagus | ESCC | 3.05e-06 | 1.42e-01 | 0.116 |
| 55610 | VPS50 | P11T-E | Human | Esophagus | ESCC | 1.52e-02 | 2.18e-01 | 0.1426 |
| 55610 | VPS50 | P12T-E | Human | Esophagus | ESCC | 3.82e-16 | 2.60e-01 | 0.1122 |
| 55610 | VPS50 | P15T-E | Human | Esophagus | ESCC | 2.44e-11 | 2.65e-01 | 0.1149 |
| 55610 | VPS50 | P16T-E | Human | Esophagus | ESCC | 7.56e-26 | 5.08e-01 | 0.1153 |
| 55610 | VPS50 | P17T-E | Human | Esophagus | ESCC | 2.49e-07 | 3.25e-01 | 0.1278 |
| 55610 | VPS50 | P20T-E | Human | Esophagus | ESCC | 3.96e-18 | 3.87e-01 | 0.1124 |
| 55610 | VPS50 | P21T-E | Human | Esophagus | ESCC | 9.85e-09 | 2.02e-01 | 0.1617 |
| 55610 | VPS50 | P22T-E | Human | Esophagus | ESCC | 4.34e-12 | 1.04e-01 | 0.1236 |
| 55610 | VPS50 | P23T-E | Human | Esophagus | ESCC | 1.49e-13 | 3.37e-01 | 0.108 |
| Page: 1 2 3 4 |
| Tissue | Expression Dynamics | Abbreviation |
| Cervix |  | CC: Cervix cancer |
| HSIL_HPV: HPV-infected high-grade squamous intraepithelial lesions | ||
| N_HPV: HPV-infected normal cervix | ||
| Esophagus | 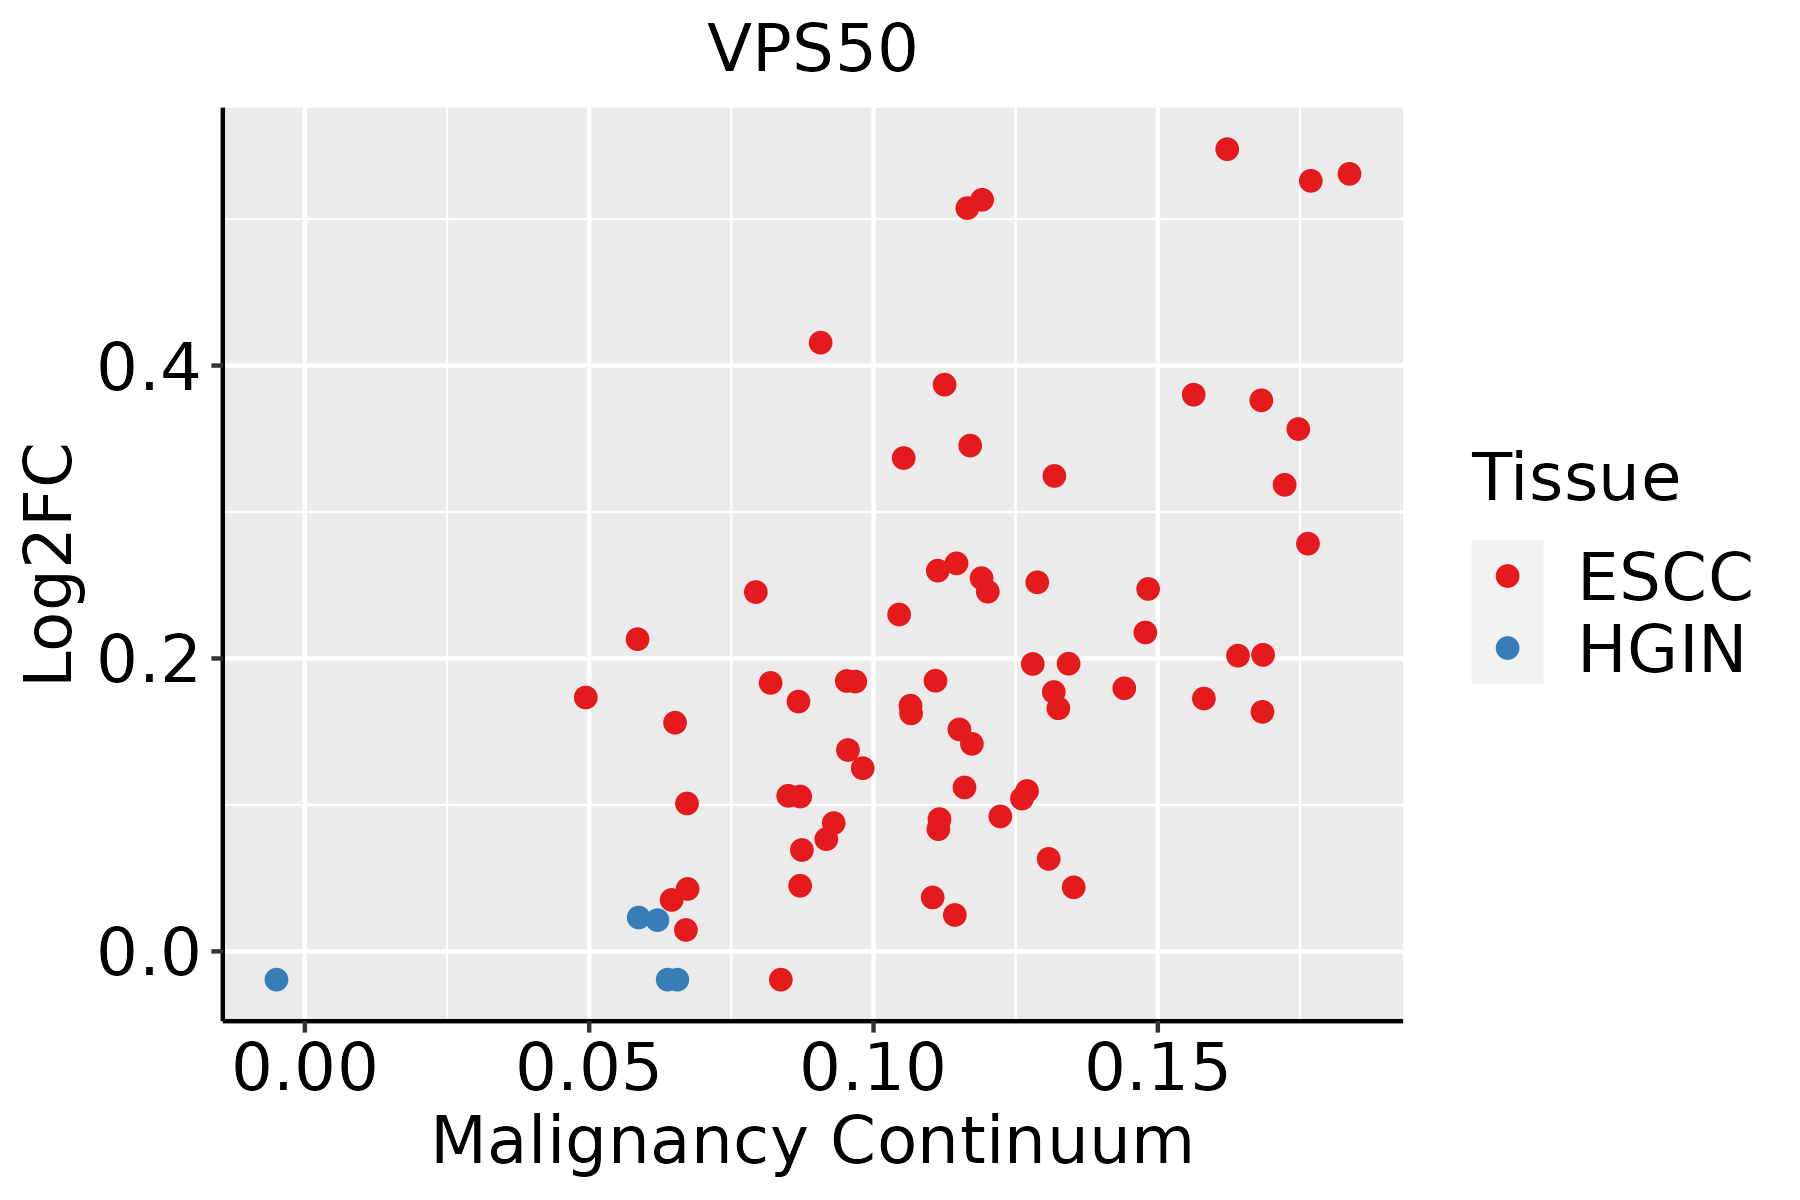 | ESCC: Esophageal squamous cell carcinoma |
| HGIN: High-grade intraepithelial neoplasias | ||
| LGIN: Low-grade intraepithelial neoplasias | ||
| Thyroid | 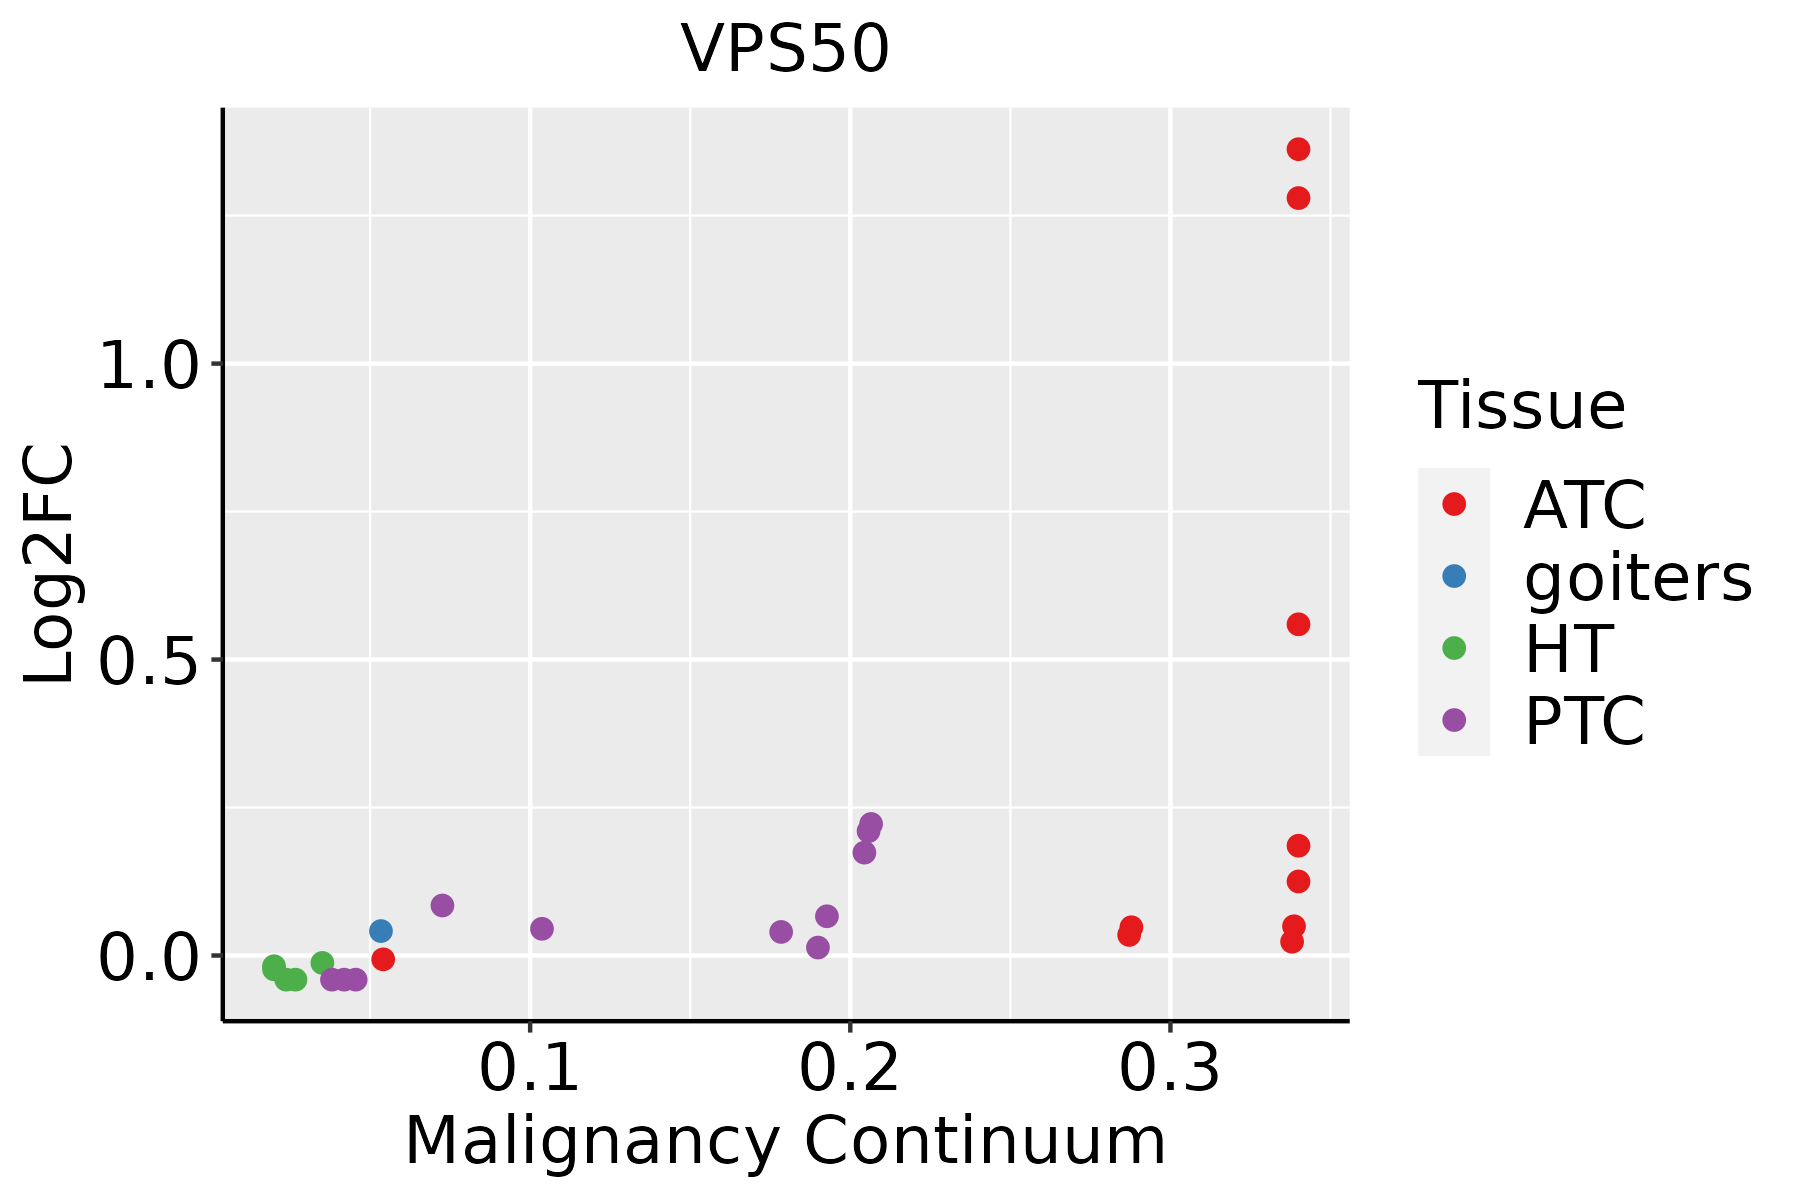 | ATC: Anaplastic thyroid cancer |
| HT: Hashimoto's thyroiditis | ||
| PTC: Papillary thyroid cancer |
| ∗log2FC in expression of this searched gene in stem-like cells from each diseased tissue sample relative to stem-like cells in normal samples in each tissue plotted against the malignancy continuum. Samples are colored based on if they are from different disease stage. |
Top |
Malignant transformation related pathway analysis |
| Find out the enriched GO biological processes and KEGG pathways involved in transition from healthy to precancer to cancer |
| Tissue | Disease Stage | Enriched GO biological Processes |
| Colorectum | AD |  |
| Colorectum | SER |  |
| Colorectum | MSS |  |
| Colorectum | MSI-H |  |
| Colorectum | FAP |  |
| ∗Top 15 enriched GO BP terms are showed in the bar plot of each disease state in each tissue. Each row represents a significant GO biological process which is colored according to the -log10(p.adjust). |
| Page: 1 2 3 4 5 6 7 8 9 |
| GO ID | Tissue | Disease Stage | Description | Gene Ratio | Bg Ratio | pvalue | p.adjust | Count |
| GO:00988767 | Cervix | CC | vesicle-mediated transport to the plasma membrane | 34/2311 | 136/18723 | 3.75e-05 | 5.91e-04 | 34 |
| GO:00161977 | Cervix | CC | endosomal transport | 48/2311 | 230/18723 | 1.65e-04 | 1.97e-03 | 48 |
| GO:001619715 | Esophagus | ESCC | endosomal transport | 168/8552 | 230/18723 | 2.28e-17 | 1.93e-15 | 168 |
| GO:009887615 | Esophagus | ESCC | vesicle-mediated transport to the plasma membrane | 99/8552 | 136/18723 | 1.13e-10 | 3.39e-09 | 99 |
| GO:00324565 | Esophagus | ESCC | endocytic recycling | 51/8552 | 73/18723 | 2.47e-05 | 2.10e-04 | 51 |
| GO:001619718 | Thyroid | PTC | endosomal transport | 128/5968 | 230/18723 | 6.26e-14 | 3.52e-12 | 128 |
| GO:009887618 | Thyroid | PTC | vesicle-mediated transport to the plasma membrane | 74/5968 | 136/18723 | 4.20e-08 | 9.08e-07 | 74 |
| GO:001619719 | Thyroid | ATC | endosomal transport | 128/6293 | 230/18723 | 4.44e-12 | 1.75e-10 | 128 |
| GO:009887619 | Thyroid | ATC | vesicle-mediated transport to the plasma membrane | 77/6293 | 136/18723 | 2.86e-08 | 5.43e-07 | 77 |
| Page: 1 |
| Pathway ID | Tissue | Disease Stage | Description | Gene Ratio | Bg Ratio | pvalue | p.adjust | qvalue | Count |
| Page: 1 |
Top |
Cell-cell communication analysis |
| Identification of potential cell-cell interactions between two cell types and their ligand-receptor pairs for different disease states |
| Ligand | Receptor | LRpair | Pathway | Tissue | Disease Stage |
| Page: 1 |
Top |
Single-cell gene regulatory network inference analysis |
| Find out the significant the regulons (TFs) and the target genes of each regulon across cell types for different disease states |
| TF | Cell Type | Tissue | Disease Stage | Target Gene | RSS | Regulon Activity |
| ∗The dot plots of a searched regulon are shown for all cell subpopulations in each disease state of each tissue based on the regulon specific score inferred using pySCENIC and by calculating the average expression. |
| Page: 1 |
Top |
Somatic mutation of malignant transformation related genes |
| Annotation of somatic variants for genes involved in malignant transformation |
| Hugo Symbol | Variant Class | Variant Classification | dbSNP RS | HGVSc | HGVSp | HGVSp Short | SWISSPROT | BIOTYPE | SIFT | PolyPhen | Tumor Sample Barcode | Tissue | Histology | Sex | Age | Stage | Therapy Types | Drugs | Outcome |
| VPS50 | SNV | Missense_Mutation | c.2321N>T | p.Ser774Ile | p.S774I | Q96JG6 | protein_coding | tolerated(0.27) | possibly_damaging(0.505) | TCGA-A8-A094-01 | Breast | breast invasive carcinoma | Female | >=65 | I/II | Unknown | Unknown | SD | |
| VPS50 | SNV | Missense_Mutation | novel | c.80A>C | p.Glu27Ala | p.E27A | Q96JG6 | protein_coding | tolerated(0.1) | probably_damaging(0.956) | TCGA-AN-A046-01 | Breast | breast invasive carcinoma | Female | >=65 | I/II | Unknown | Unknown | SD |
| VPS50 | SNV | Missense_Mutation | c.1250N>G | p.Asp417Gly | p.D417G | Q96JG6 | protein_coding | tolerated(0.31) | probably_damaging(0.984) | TCGA-EW-A1P4-01 | Breast | breast invasive carcinoma | Female | <65 | I/II | Chemotherapy | docetaxel | SD | |
| VPS50 | SNV | Missense_Mutation | novel | c.889N>A | p.Ala297Thr | p.A297T | Q96JG6 | protein_coding | deleterious(0.04) | possibly_damaging(0.836) | TCGA-EA-A5ZE-01 | Cervix | cervical & endocervical cancer | Female | <65 | I/II | Unknown | Unknown | PD |
| VPS50 | SNV | Missense_Mutation | novel | c.844N>G | p.His282Asp | p.H282D | Q96JG6 | protein_coding | deleterious(0.01) | possibly_damaging(0.87) | TCGA-JW-A5VL-01 | Cervix | cervical & endocervical cancer | Female | <65 | I/II | Unknown | Unknown | SD |
| VPS50 | SNV | Missense_Mutation | c.1220T>G | p.Phe407Cys | p.F407C | Q96JG6 | protein_coding | deleterious(0) | probably_damaging(0.99) | TCGA-AA-3492-01 | Colorectum | colon adenocarcinoma | Female | >=65 | I/II | Unknown | Unknown | SD | |
| VPS50 | SNV | Missense_Mutation | c.1137N>T | p.Lys379Asn | p.K379N | Q96JG6 | protein_coding | deleterious(0) | probably_damaging(0.987) | TCGA-AA-3663-01 | Colorectum | colon adenocarcinoma | Male | <65 | I/II | Unknown | Unknown | SD | |
| VPS50 | SNV | Missense_Mutation | c.247N>A | p.Leu83Met | p.L83M | Q96JG6 | protein_coding | tolerated(0.15) | probably_damaging(0.998) | TCGA-AA-3664-01 | Colorectum | colon adenocarcinoma | Female | >=65 | I/II | Unknown | Unknown | SD | |
| VPS50 | SNV | Missense_Mutation | c.115G>A | p.Glu39Lys | p.E39K | Q96JG6 | protein_coding | tolerated(0.14) | benign(0.003) | TCGA-AA-3956-01 | Colorectum | colon adenocarcinoma | Male | >=65 | I/II | Unknown | Unknown | SD | |
| VPS50 | SNV | Missense_Mutation | c.1350N>T | p.Lys450Asn | p.K450N | Q96JG6 | protein_coding | deleterious(0.03) | probably_damaging(0.966) | TCGA-AA-A010-01 | Colorectum | colon adenocarcinoma | Female | <65 | I/II | Chemotherapy | folinic | CR |
| Page: 1 2 3 4 5 6 7 8 9 10 11 12 13 |
Top |
Related drugs of malignant transformation related genes |
| Identification of chemicals and drugs interact with genes involved in malignant transfromation |
| (DGIdb 4.0) |
| Entrez ID | Symbol | Category | Interaction Types | Drug Claim Name | Drug Name | PMIDs |
| Page: 1 |

Copyright 2023-Present -The University of Texas Health Science Center at Houston |