
|
|||||
|
 | |
| |
| |
| |
| |
| |
|
Gene: VPS4B |
Gene summary for VPS4B |
| Gene information | Species | Human | Gene symbol | VPS4B | Gene ID | 9525 |
| Gene name | vacuolar protein sorting 4 homolog B | |
| Gene Alias | MIG1 | |
| Cytomap | 18q21.33 | |
| Gene Type | protein-coding | GO ID | GO:0000070 | UniProtAcc | A0A024R2C5 |
Top |
Malignant transformation analysis |
| Identification of the aberrant gene expression in precancerous and cancerous lesions by comparing the gene expression of stem-like cells in diseased tissues with normal stem cells |
| Entrez ID | Symbol | Replicates | Species | Organ | Tissue | Adj P-value | Log2FC | Malignancy |
| 9525 | VPS4B | HTA11_347_2000001011 | Human | Colorectum | AD | 1.05e-09 | 4.48e-01 | -0.1954 |
| 9525 | VPS4B | HTA11_411_2000001011 | Human | Colorectum | SER | 4.43e-03 | 7.85e-01 | -0.2602 |
| 9525 | VPS4B | HTA11_696_2000001011 | Human | Colorectum | AD | 7.87e-03 | 2.40e-01 | -0.1464 |
| 9525 | VPS4B | A002-C-205 | Human | Colorectum | FAP | 2.69e-02 | -4.17e-02 | -0.1236 |
| 9525 | VPS4B | A002-C-016 | Human | Colorectum | FAP | 1.43e-03 | -3.96e-02 | 0.0521 |
| 9525 | VPS4B | A002-C-116 | Human | Colorectum | FAP | 3.68e-06 | -1.84e-01 | -0.0452 |
| 9525 | VPS4B | CRC-3-11773 | Human | Colorectum | CRC | 2.53e-02 | -1.46e-01 | 0.2564 |
| 9525 | VPS4B | LZE4T | Human | Esophagus | ESCC | 5.67e-12 | 3.47e-01 | 0.0811 |
| 9525 | VPS4B | LZE7T | Human | Esophagus | ESCC | 5.35e-08 | 6.07e-01 | 0.0667 |
| 9525 | VPS4B | LZE8T | Human | Esophagus | ESCC | 3.99e-10 | 2.19e-01 | 0.067 |
| 9525 | VPS4B | LZE20T | Human | Esophagus | ESCC | 5.15e-08 | 2.78e-01 | 0.0662 |
| 9525 | VPS4B | LZE22T | Human | Esophagus | ESCC | 1.80e-03 | 4.63e-01 | 0.068 |
| 9525 | VPS4B | LZE24T | Human | Esophagus | ESCC | 1.86e-15 | 4.87e-01 | 0.0596 |
| 9525 | VPS4B | LZE21T | Human | Esophagus | ESCC | 1.49e-03 | 4.36e-01 | 0.0655 |
| 9525 | VPS4B | LZE6T | Human | Esophagus | ESCC | 3.60e-02 | 1.87e-01 | 0.0845 |
| 9525 | VPS4B | P1T-E | Human | Esophagus | ESCC | 6.39e-17 | 9.48e-01 | 0.0875 |
| 9525 | VPS4B | P2T-E | Human | Esophagus | ESCC | 1.58e-44 | 7.03e-01 | 0.1177 |
| 9525 | VPS4B | P4T-E | Human | Esophagus | ESCC | 6.44e-38 | 9.09e-01 | 0.1323 |
| 9525 | VPS4B | P5T-E | Human | Esophagus | ESCC | 2.98e-38 | 7.13e-01 | 0.1327 |
| 9525 | VPS4B | P8T-E | Human | Esophagus | ESCC | 3.61e-45 | 8.69e-01 | 0.0889 |
| Page: 1 2 3 4 5 6 7 |
| Tissue | Expression Dynamics | Abbreviation |
| Colorectum (GSE201348) |  | FAP: Familial adenomatous polyposis |
| CRC: Colorectal cancer | ||
| Colorectum (HTA11) |  | AD: Adenomas |
| SER: Sessile serrated lesions | ||
| MSI-H: Microsatellite-high colorectal cancer | ||
| MSS: Microsatellite stable colorectal cancer | ||
| Esophagus | 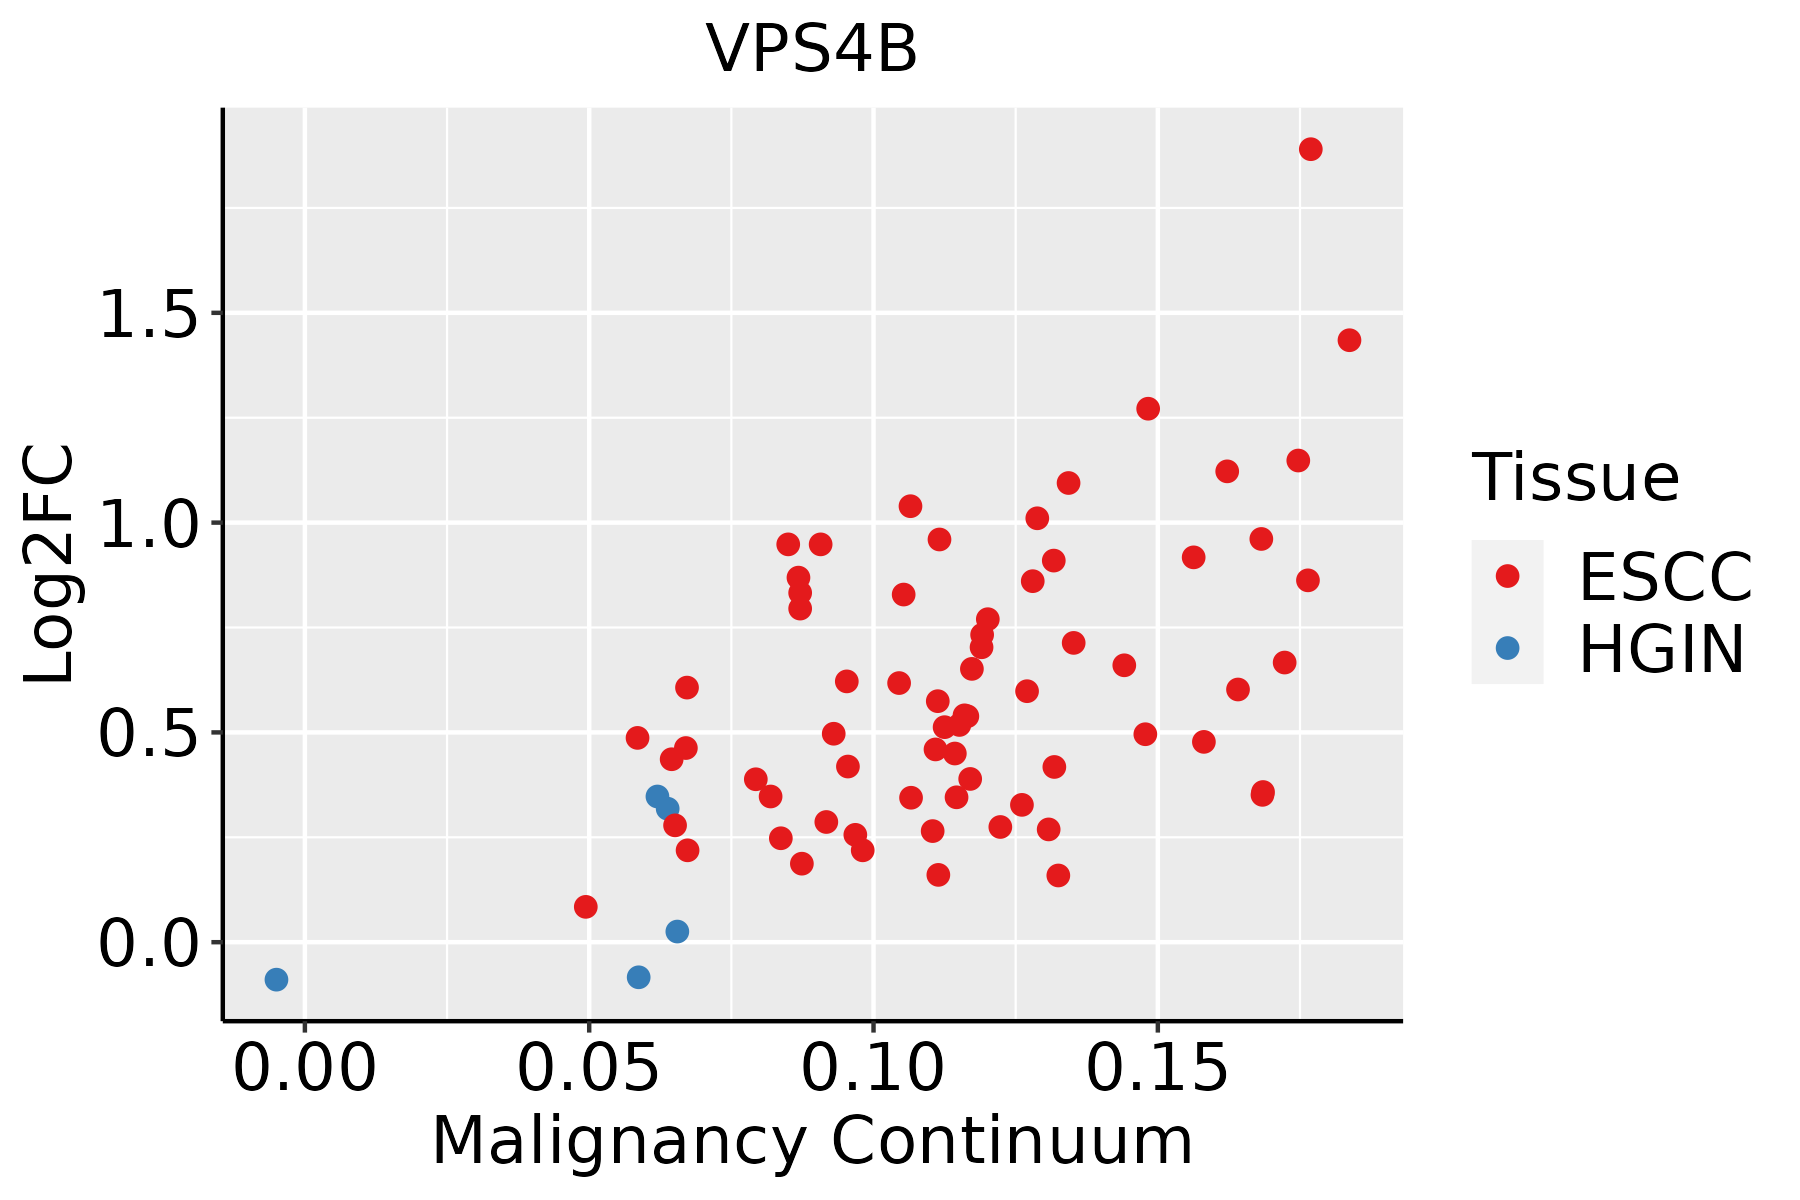 | ESCC: Esophageal squamous cell carcinoma |
| HGIN: High-grade intraepithelial neoplasias | ||
| LGIN: Low-grade intraepithelial neoplasias | ||
| Liver | 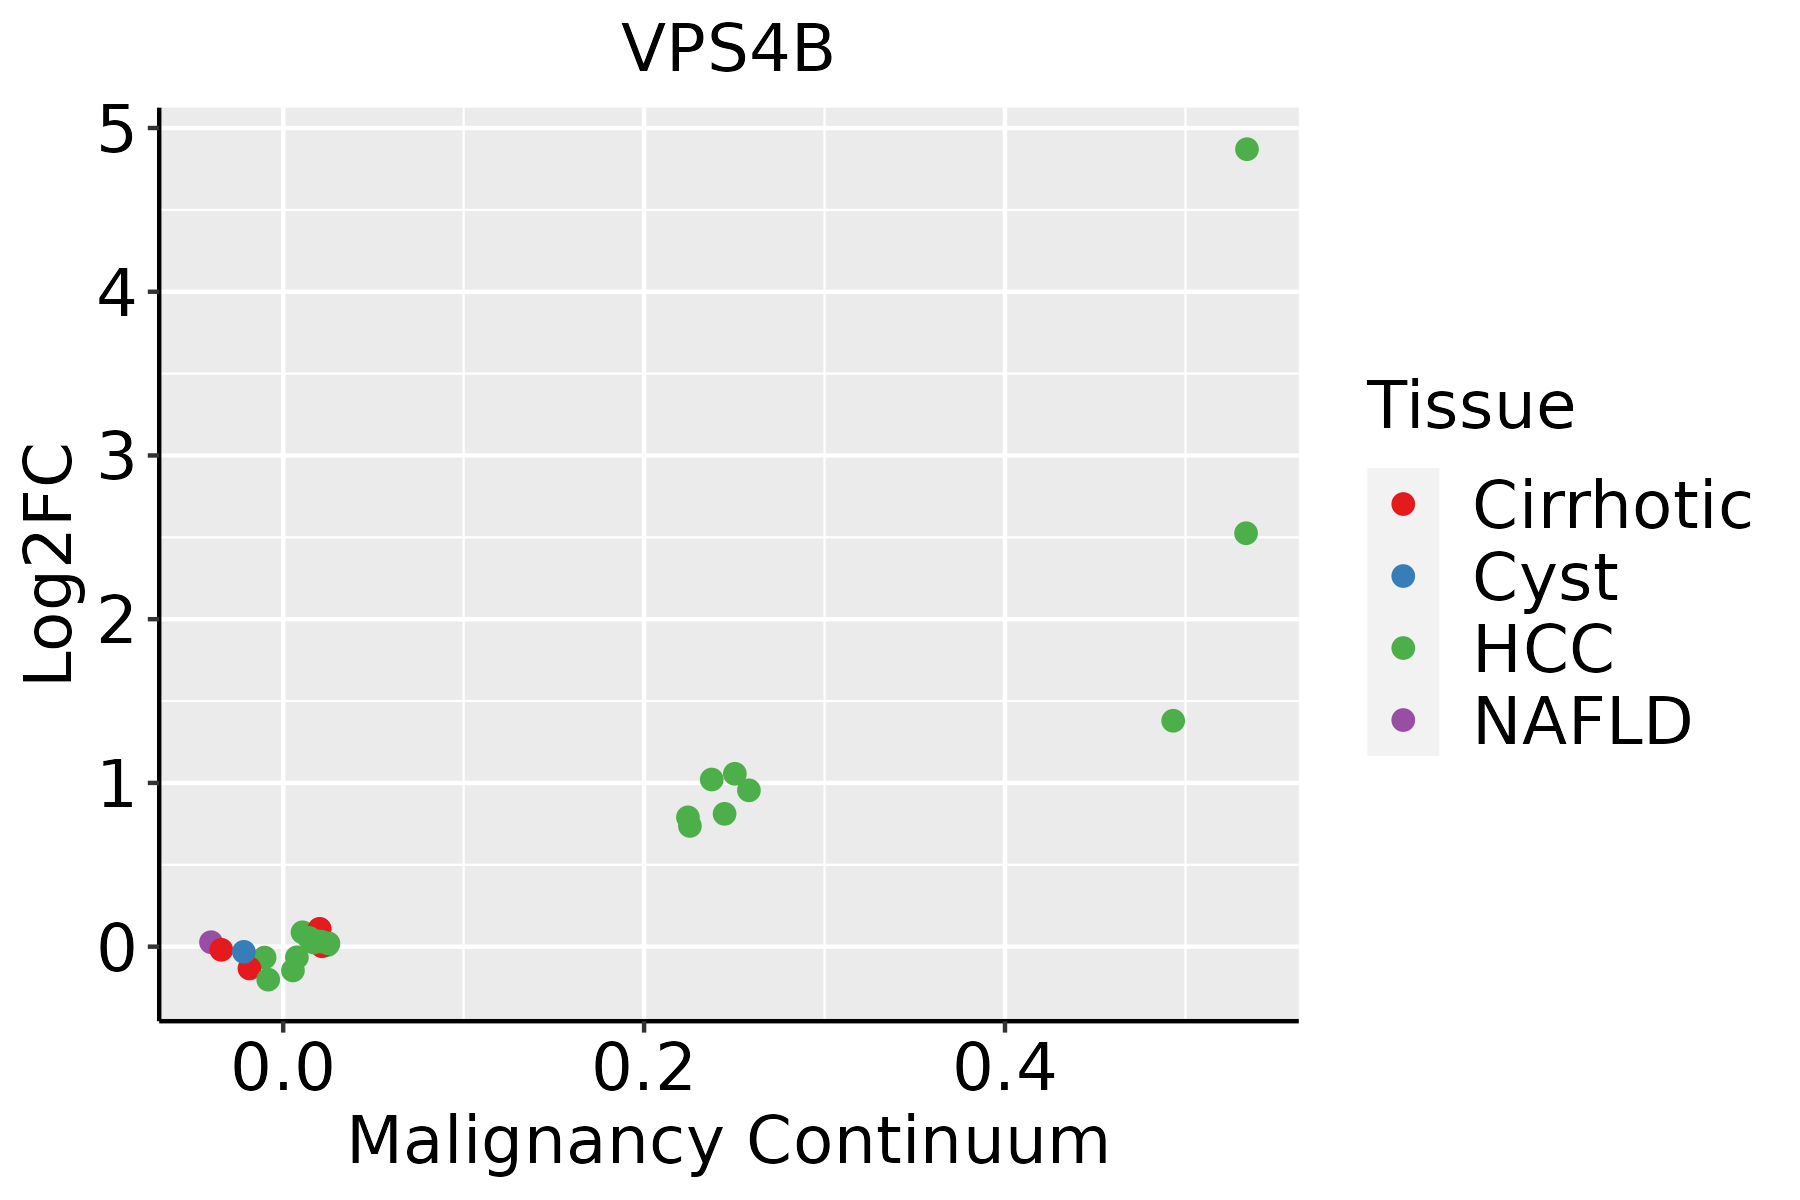 | HCC: Hepatocellular carcinoma |
| NAFLD: Non-alcoholic fatty liver disease | ||
| Oral Cavity | 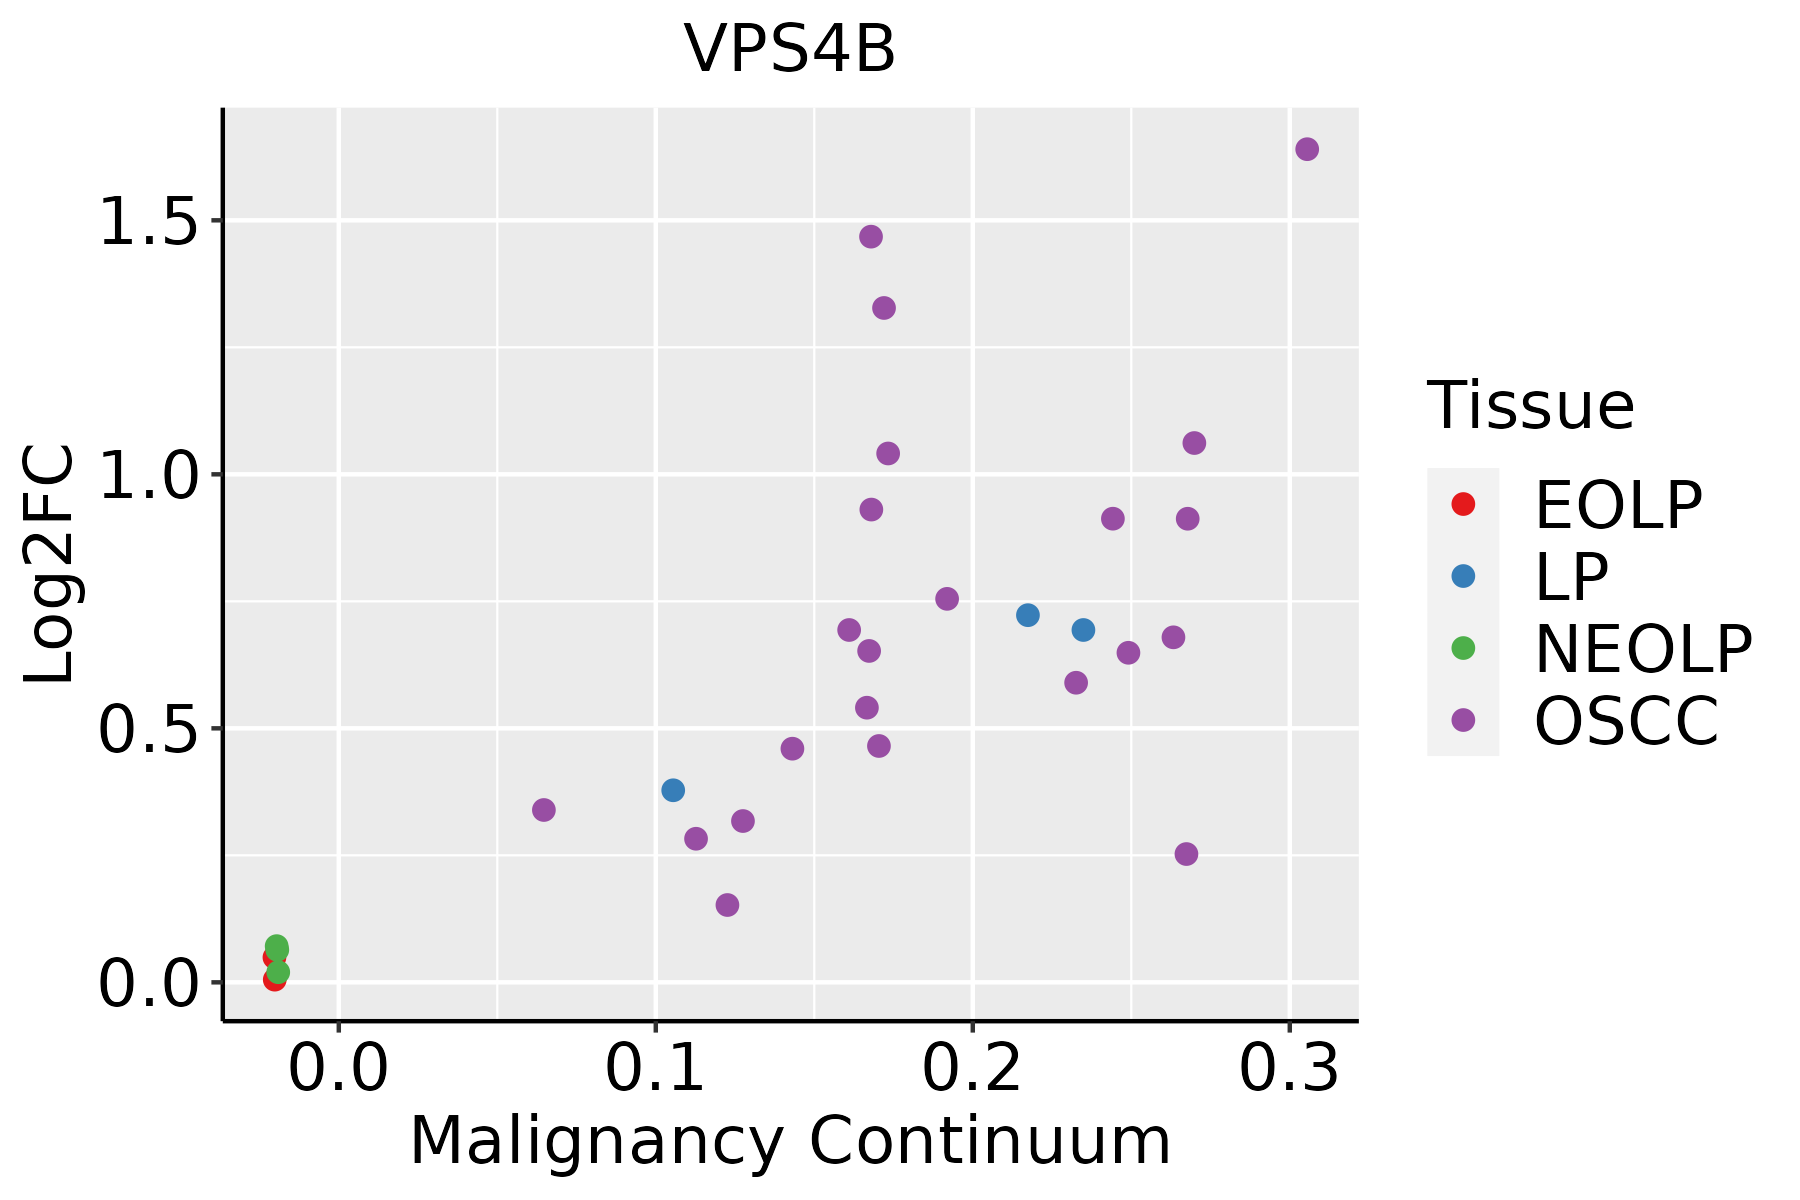 | EOLP: Erosive Oral lichen planus |
| LP: leukoplakia | ||
| NEOLP: Non-erosive oral lichen planus | ||
| OSCC: Oral squamous cell carcinoma | ||
| Prostate |  | BPH: Benign Prostatic Hyperplasia |
| Skin | 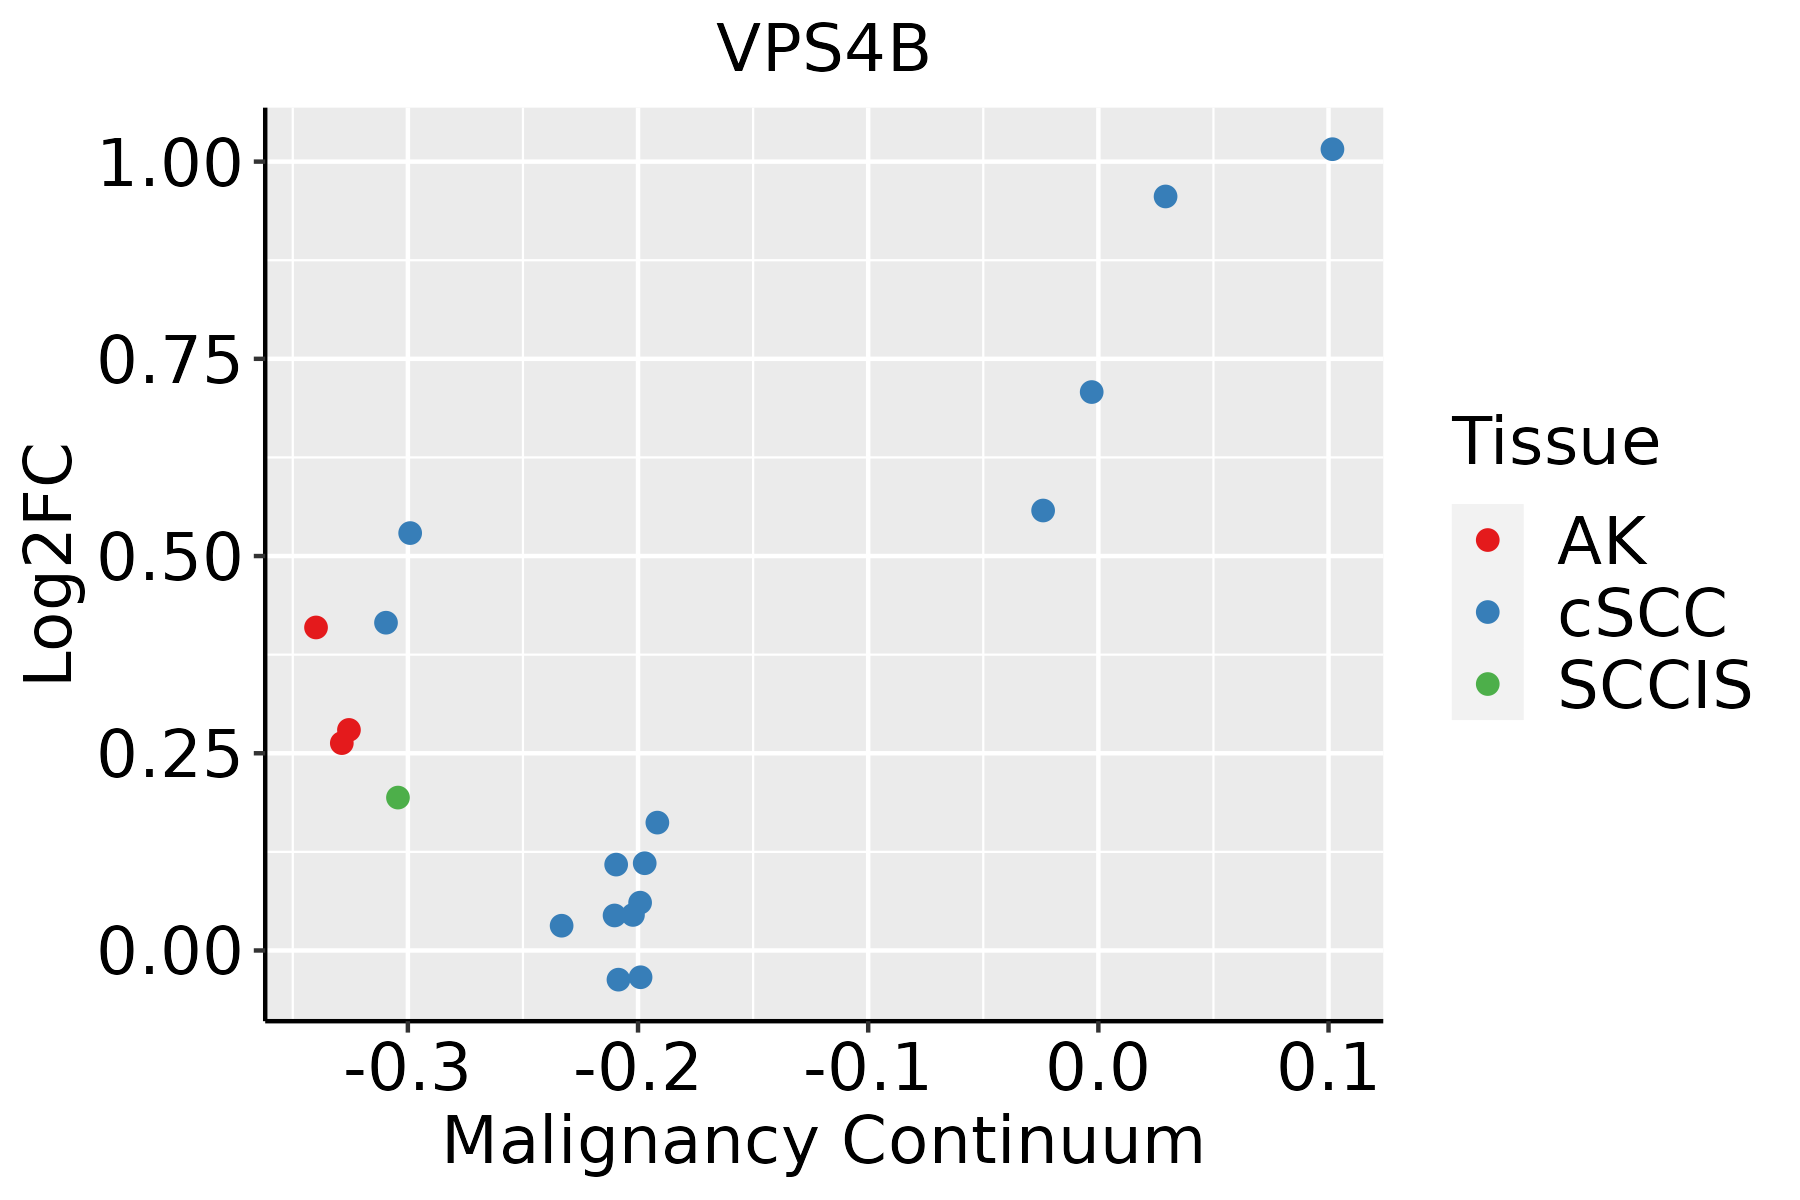 | AK: Actinic keratosis |
| cSCC: Cutaneous squamous cell carcinoma | ||
| SCCIS:squamous cell carcinoma in situ | ||
| Thyroid | 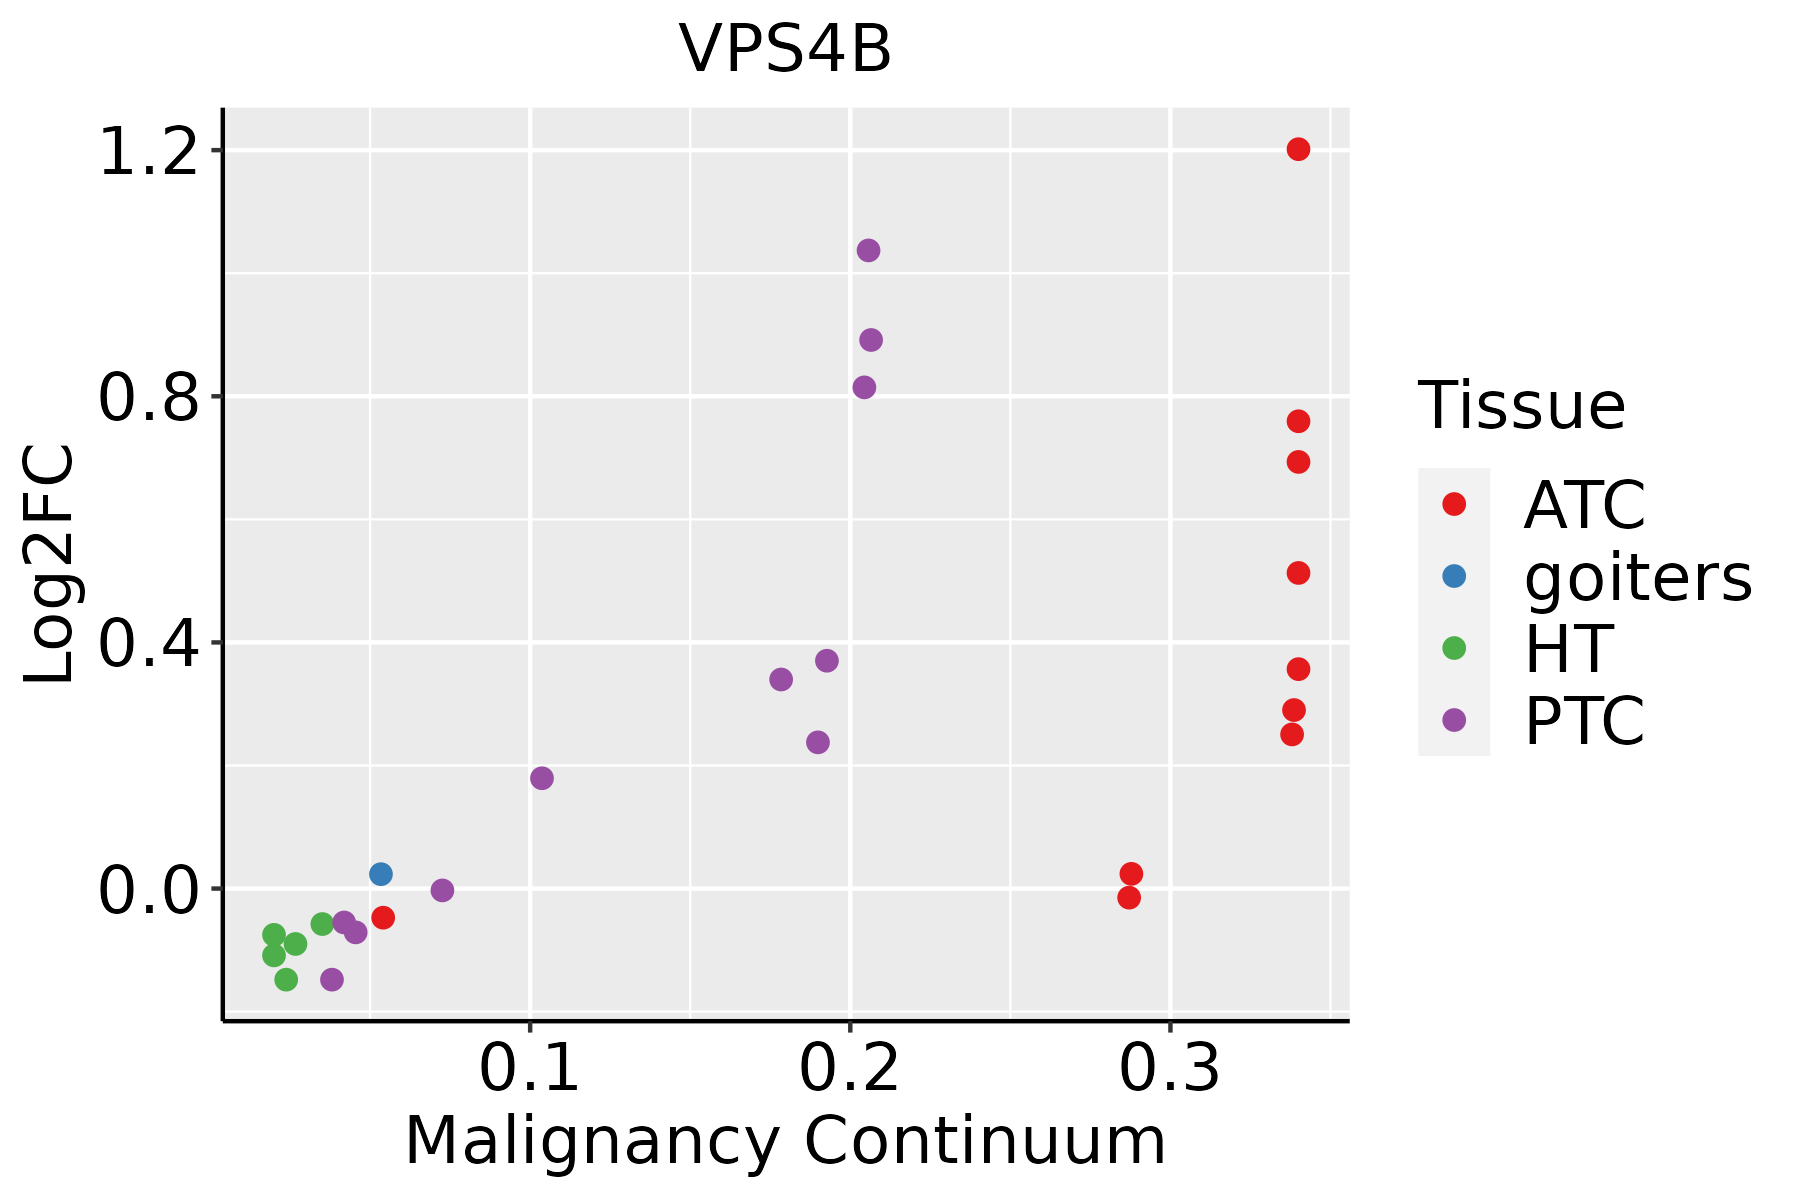 | ATC: Anaplastic thyroid cancer |
| HT: Hashimoto's thyroiditis | ||
| PTC: Papillary thyroid cancer |
| ∗log2FC in expression of this searched gene in stem-like cells from each diseased tissue sample relative to stem-like cells in normal samples in each tissue plotted against the malignancy continuum. Samples are colored based on if they are from different disease stage. |
Top |
Malignant transformation related pathway analysis |
| Find out the enriched GO biological processes and KEGG pathways involved in transition from healthy to precancer to cancer |
| Tissue | Disease Stage | Enriched GO biological Processes |
| Colorectum | AD |  |
| Colorectum | SER |  |
| Colorectum | MSS |  |
| Colorectum | MSI-H |  |
| Colorectum | FAP |  |
| ∗Top 15 enriched GO BP terms are showed in the bar plot of each disease state in each tissue. Each row represents a significant GO biological process which is colored according to the -log10(p.adjust). |
| Page: 1 2 3 4 5 6 7 8 9 |
| GO ID | Tissue | Disease Stage | Description | Gene Ratio | Bg Ratio | pvalue | p.adjust | Count |
| GO:0016032 | Colorectum | AD | viral process | 168/3918 | 415/18723 | 4.67e-20 | 3.66e-17 | 168 |
| GO:0019058 | Colorectum | AD | viral life cycle | 119/3918 | 317/18723 | 6.18e-12 | 8.23e-10 | 119 |
| GO:0051495 | Colorectum | AD | positive regulation of cytoskeleton organization | 89/3918 | 226/18723 | 1.61e-10 | 1.56e-08 | 89 |
| GO:0016197 | Colorectum | AD | endosomal transport | 90/3918 | 230/18723 | 1.88e-10 | 1.73e-08 | 90 |
| GO:0022411 | Colorectum | AD | cellular component disassembly | 147/3918 | 443/18723 | 8.53e-10 | 6.76e-08 | 147 |
| GO:0051656 | Colorectum | AD | establishment of organelle localization | 131/3918 | 390/18723 | 3.00e-09 | 2.06e-07 | 131 |
| GO:0016236 | Colorectum | AD | macroautophagy | 103/3918 | 291/18723 | 6.76e-09 | 4.15e-07 | 103 |
| GO:1990182 | Colorectum | AD | exosomal secretion | 16/3918 | 20/18723 | 2.67e-08 | 1.47e-06 | 16 |
| GO:0097734 | Colorectum | AD | extracellular exosome biogenesis | 16/3918 | 21/18723 | 9.02e-08 | 4.52e-06 | 16 |
| GO:0032984 | Colorectum | AD | protein-containing complex disassembly | 81/3918 | 224/18723 | 9.41e-08 | 4.65e-06 | 81 |
| GO:0044403 | Colorectum | AD | biological process involved in symbiotic interaction | 99/3918 | 290/18723 | 1.02e-07 | 4.93e-06 | 99 |
| GO:0016050 | Colorectum | AD | vesicle organization | 101/3918 | 300/18723 | 1.65e-07 | 7.17e-06 | 101 |
| GO:0007034 | Colorectum | AD | vacuolar transport | 60/3918 | 157/18723 | 4.97e-07 | 1.85e-05 | 60 |
| GO:0051701 | Colorectum | AD | biological process involved in interaction with host | 73/3918 | 203/18723 | 5.08e-07 | 1.88e-05 | 73 |
| GO:0140112 | Colorectum | AD | extracellular vesicle biogenesis | 16/3918 | 23/18723 | 7.04e-07 | 2.49e-05 | 16 |
| GO:1903541 | Colorectum | AD | regulation of exosomal secretion | 13/3918 | 17/18723 | 1.46e-06 | 4.58e-05 | 13 |
| GO:0052126 | Colorectum | AD | movement in host environment | 63/3918 | 175/18723 | 2.85e-06 | 8.11e-05 | 63 |
| GO:1903543 | Colorectum | AD | positive regulation of exosomal secretion | 11/3918 | 15/18723 | 1.95e-05 | 4.01e-04 | 11 |
| GO:0036257 | Colorectum | AD | multivesicular body organization | 17/3918 | 31/18723 | 3.45e-05 | 6.29e-04 | 17 |
| GO:0000910 | Colorectum | AD | cytokinesis | 59/3918 | 173/18723 | 3.74e-05 | 6.75e-04 | 59 |
| Page: 1 2 3 4 5 6 7 8 9 10 11 12 13 14 15 16 17 18 19 20 21 22 23 24 25 26 27 28 29 30 31 32 33 34 35 36 37 38 39 40 41 42 43 44 45 46 47 |
| Pathway ID | Tissue | Disease Stage | Description | Gene Ratio | Bg Ratio | pvalue | p.adjust | qvalue | Count |
| hsa04144 | Colorectum | AD | Endocytosis | 111/2092 | 251/8465 | 5.95e-12 | 1.42e-10 | 9.08e-11 | 111 |
| hsa041441 | Colorectum | AD | Endocytosis | 111/2092 | 251/8465 | 5.95e-12 | 1.42e-10 | 9.08e-11 | 111 |
| hsa041442 | Colorectum | SER | Endocytosis | 81/1580 | 251/8465 | 1.14e-07 | 2.36e-06 | 1.71e-06 | 81 |
| hsa04217 | Colorectum | SER | Necroptosis | 47/1580 | 159/8465 | 5.21e-04 | 4.44e-03 | 3.22e-03 | 47 |
| hsa041443 | Colorectum | SER | Endocytosis | 81/1580 | 251/8465 | 1.14e-07 | 2.36e-06 | 1.71e-06 | 81 |
| hsa042171 | Colorectum | SER | Necroptosis | 47/1580 | 159/8465 | 5.21e-04 | 4.44e-03 | 3.22e-03 | 47 |
| hsa041446 | Colorectum | FAP | Endocytosis | 78/1404 | 251/8465 | 6.20e-09 | 2.96e-07 | 1.80e-07 | 78 |
| hsa041447 | Colorectum | FAP | Endocytosis | 78/1404 | 251/8465 | 6.20e-09 | 2.96e-07 | 1.80e-07 | 78 |
| hsa04144210 | Esophagus | ESCC | Endocytosis | 186/4205 | 251/8465 | 9.74e-16 | 4.66e-14 | 2.39e-14 | 186 |
| hsa032509 | Esophagus | ESCC | Viral life cycle - HIV-1 | 54/4205 | 63/8465 | 2.01e-09 | 2.17e-08 | 1.11e-08 | 54 |
| hsa0414437 | Esophagus | ESCC | Endocytosis | 186/4205 | 251/8465 | 9.74e-16 | 4.66e-14 | 2.39e-14 | 186 |
| hsa0325014 | Esophagus | ESCC | Viral life cycle - HIV-1 | 54/4205 | 63/8465 | 2.01e-09 | 2.17e-08 | 1.11e-08 | 54 |
| hsa0414412 | Liver | Cirrhotic | Endocytosis | 119/2530 | 251/8465 | 2.33e-09 | 4.56e-08 | 2.81e-08 | 119 |
| hsa0414413 | Liver | Cirrhotic | Endocytosis | 119/2530 | 251/8465 | 2.33e-09 | 4.56e-08 | 2.81e-08 | 119 |
| hsa0414422 | Liver | HCC | Endocytosis | 178/4020 | 251/8465 | 2.03e-14 | 5.22e-13 | 2.91e-13 | 178 |
| hsa032502 | Liver | HCC | Viral life cycle - HIV-1 | 46/4020 | 63/8465 | 3.25e-05 | 1.88e-04 | 1.04e-04 | 46 |
| hsa0414432 | Liver | HCC | Endocytosis | 178/4020 | 251/8465 | 2.03e-14 | 5.22e-13 | 2.91e-13 | 178 |
| hsa0325011 | Liver | HCC | Viral life cycle - HIV-1 | 46/4020 | 63/8465 | 3.25e-05 | 1.88e-04 | 1.04e-04 | 46 |
| hsa0414427 | Oral cavity | OSCC | Endocytosis | 174/3704 | 251/8465 | 9.42e-17 | 4.51e-15 | 2.29e-15 | 174 |
| hsa032508 | Oral cavity | OSCC | Viral life cycle - HIV-1 | 45/3704 | 63/8465 | 7.62e-06 | 3.59e-05 | 1.83e-05 | 45 |
| Page: 1 2 |
Top |
Cell-cell communication analysis |
| Identification of potential cell-cell interactions between two cell types and their ligand-receptor pairs for different disease states |
| Ligand | Receptor | LRpair | Pathway | Tissue | Disease Stage |
| Page: 1 |
Top |
Single-cell gene regulatory network inference analysis |
| Find out the significant the regulons (TFs) and the target genes of each regulon across cell types for different disease states |
| TF | Cell Type | Tissue | Disease Stage | Target Gene | RSS | Regulon Activity |
| ∗The dot plots of a searched regulon are shown for all cell subpopulations in each disease state of each tissue based on the regulon specific score inferred using pySCENIC and by calculating the average expression. |
| Page: 1 |
Top |
Somatic mutation of malignant transformation related genes |
| Annotation of somatic variants for genes involved in malignant transformation |
| Hugo Symbol | Variant Class | Variant Classification | dbSNP RS | HGVSc | HGVSp | HGVSp Short | SWISSPROT | BIOTYPE | SIFT | PolyPhen | Tumor Sample Barcode | Tissue | Histology | Sex | Age | Stage | Therapy Types | Drugs | Outcome |
| VPS4B | SNV | Missense_Mutation | rs142699030 | c.406G>A | p.Val136Ile | p.V136I | O75351 | protein_coding | tolerated(0.23) | benign(0.06) | TCGA-A2-A0T7-01 | Breast | breast invasive carcinoma | Female | <65 | I/II | Chemotherapy | adriamycin | SD |
| VPS4B | SNV | Missense_Mutation | c.1070N>C | p.Gln357Pro | p.Q357P | O75351 | protein_coding | deleterious(0.01) | probably_damaging(0.999) | TCGA-A2-A0YJ-01 | Breast | breast invasive carcinoma | Female | <65 | III/IV | Chemotherapy | cytoxan | PD | |
| VPS4B | SNV | Missense_Mutation | c.409N>C | p.Ala137Pro | p.A137P | O75351 | protein_coding | deleterious(0) | probably_damaging(0.967) | TCGA-A8-A07R-01 | Breast | breast invasive carcinoma | Female | >=65 | III/IV | Ancillary | zoledronic | SD | |
| VPS4B | SNV | Missense_Mutation | rs771753062 | c.82N>A | p.Glu28Lys | p.E28K | O75351 | protein_coding | tolerated(0.1) | benign(0.038) | TCGA-AN-A046-01 | Breast | breast invasive carcinoma | Female | >=65 | I/II | Unknown | Unknown | SD |
| VPS4B | SNV | Missense_Mutation | c.878A>C | p.Glu293Ala | p.E293A | O75351 | protein_coding | deleterious(0) | probably_damaging(1) | TCGA-BH-A0BL-01 | Breast | breast invasive carcinoma | Female | <65 | I/II | Chemotherapy | adriamycin | CR | |
| VPS4B | SNV | Missense_Mutation | rs753852708 | c.755N>A | p.Arg252His | p.R252H | O75351 | protein_coding | deleterious(0) | probably_damaging(1) | TCGA-BH-A0BQ-01 | Breast | breast invasive carcinoma | Female | <65 | I/II | Unknown | Unknown | PD |
| VPS4B | SNV | Missense_Mutation | c.1293N>T | p.Leu431Phe | p.L431F | O75351 | protein_coding | deleterious(0.03) | benign(0.186) | TCGA-C5-A2LX-01 | Cervix | cervical & endocervical cancer | Female | <65 | I/II | Chemotherapy | cisplatin | SD | |
| VPS4B | insertion | Nonsense_Mutation | novel | c.223_224insGAC | p.Tyr75delinsTer | p.Y75delins* | O75351 | protein_coding | TCGA-DS-A1OB-01 | Cervix | cervical & endocervical cancer | Female | <65 | I/II | Chemotherapy | carboplatin | PD | ||
| VPS4B | insertion | Nonsense_Mutation | novel | c.222_223insCCATAGTTTGC | p.Tyr75ProfsTer2 | p.Y75Pfs*2 | O75351 | protein_coding | TCGA-DS-A1OB-01 | Cervix | cervical & endocervical cancer | Female | <65 | I/II | Chemotherapy | carboplatin | PD | ||
| VPS4B | SNV | Missense_Mutation | c.128A>G | p.His43Arg | p.H43R | O75351 | protein_coding | tolerated(0.35) | possibly_damaging(0.782) | TCGA-A6-6780-01 | Colorectum | colon adenocarcinoma | Male | >=65 | I/II | Unknown | Unknown | SD |
| Page: 1 2 3 4 5 |
Top |
Related drugs of malignant transformation related genes |
| Identification of chemicals and drugs interact with genes involved in malignant transfromation |
| (DGIdb 4.0) |
| Entrez ID | Symbol | Category | Interaction Types | Drug Claim Name | Drug Name | PMIDs |
| Page: 1 |

Copyright 2023-Present -The University of Texas Health Science Center at Houston |