
|
|||||
|
 | |
| |
| |
| |
| |
| |
|
Gene: VPS41 |
Gene summary for VPS41 |
| Gene information | Species | Human | Gene symbol | VPS41 | Gene ID | 27072 |
| Gene name | VPS41 subunit of HOPS complex | |
| Gene Alias | HVPS41 | |
| Cytomap | 7p14.1 | |
| Gene Type | protein-coding | GO ID | GO:0006605 | UniProtAcc | P49754 |
Top |
Malignant transformation analysis |
| Identification of the aberrant gene expression in precancerous and cancerous lesions by comparing the gene expression of stem-like cells in diseased tissues with normal stem cells |
| Entrez ID | Symbol | Replicates | Species | Organ | Tissue | Adj P-value | Log2FC | Malignancy |
| 27072 | VPS41 | LZE4T | Human | Esophagus | ESCC | 1.00e-11 | 4.13e-01 | 0.0811 |
| 27072 | VPS41 | LZE7T | Human | Esophagus | ESCC | 2.41e-08 | 4.37e-01 | 0.0667 |
| 27072 | VPS41 | LZE8T | Human | Esophagus | ESCC | 8.87e-03 | 1.64e-01 | 0.067 |
| 27072 | VPS41 | LZE20T | Human | Esophagus | ESCC | 1.08e-02 | 9.53e-02 | 0.0662 |
| 27072 | VPS41 | LZE22T | Human | Esophagus | ESCC | 5.58e-03 | 4.21e-01 | 0.068 |
| 27072 | VPS41 | LZE24T | Human | Esophagus | ESCC | 3.61e-10 | 3.16e-01 | 0.0596 |
| 27072 | VPS41 | P1T-E | Human | Esophagus | ESCC | 6.92e-06 | 3.29e-01 | 0.0875 |
| 27072 | VPS41 | P2T-E | Human | Esophagus | ESCC | 5.75e-23 | 4.00e-01 | 0.1177 |
| 27072 | VPS41 | P4T-E | Human | Esophagus | ESCC | 1.08e-18 | 3.79e-01 | 0.1323 |
| 27072 | VPS41 | P5T-E | Human | Esophagus | ESCC | 2.19e-05 | 7.72e-02 | 0.1327 |
| 27072 | VPS41 | P8T-E | Human | Esophagus | ESCC | 7.34e-18 | 3.36e-01 | 0.0889 |
| 27072 | VPS41 | P9T-E | Human | Esophagus | ESCC | 2.19e-12 | 1.71e-01 | 0.1131 |
| 27072 | VPS41 | P10T-E | Human | Esophagus | ESCC | 6.80e-20 | 3.08e-01 | 0.116 |
| 27072 | VPS41 | P11T-E | Human | Esophagus | ESCC | 2.01e-10 | 4.33e-01 | 0.1426 |
| 27072 | VPS41 | P12T-E | Human | Esophagus | ESCC | 3.84e-18 | 3.20e-01 | 0.1122 |
| 27072 | VPS41 | P15T-E | Human | Esophagus | ESCC | 7.18e-24 | 4.66e-01 | 0.1149 |
| 27072 | VPS41 | P16T-E | Human | Esophagus | ESCC | 1.64e-25 | 4.79e-01 | 0.1153 |
| 27072 | VPS41 | P17T-E | Human | Esophagus | ESCC | 6.84e-05 | 2.75e-01 | 0.1278 |
| 27072 | VPS41 | P19T-E | Human | Esophagus | ESCC | 1.05e-03 | 3.36e-01 | 0.1662 |
| 27072 | VPS41 | P20T-E | Human | Esophagus | ESCC | 1.91e-20 | 3.84e-01 | 0.1124 |
| Page: 1 2 3 4 5 6 |
| Tissue | Expression Dynamics | Abbreviation |
| Esophagus |  | ESCC: Esophageal squamous cell carcinoma |
| HGIN: High-grade intraepithelial neoplasias | ||
| LGIN: Low-grade intraepithelial neoplasias | ||
| Liver |  | HCC: Hepatocellular carcinoma |
| NAFLD: Non-alcoholic fatty liver disease | ||
| Lung |  | AAH: Atypical adenomatous hyperplasia |
| AIS: Adenocarcinoma in situ | ||
| IAC: Invasive lung adenocarcinoma | ||
| MIA: Minimally invasive adenocarcinoma | ||
| Oral Cavity | 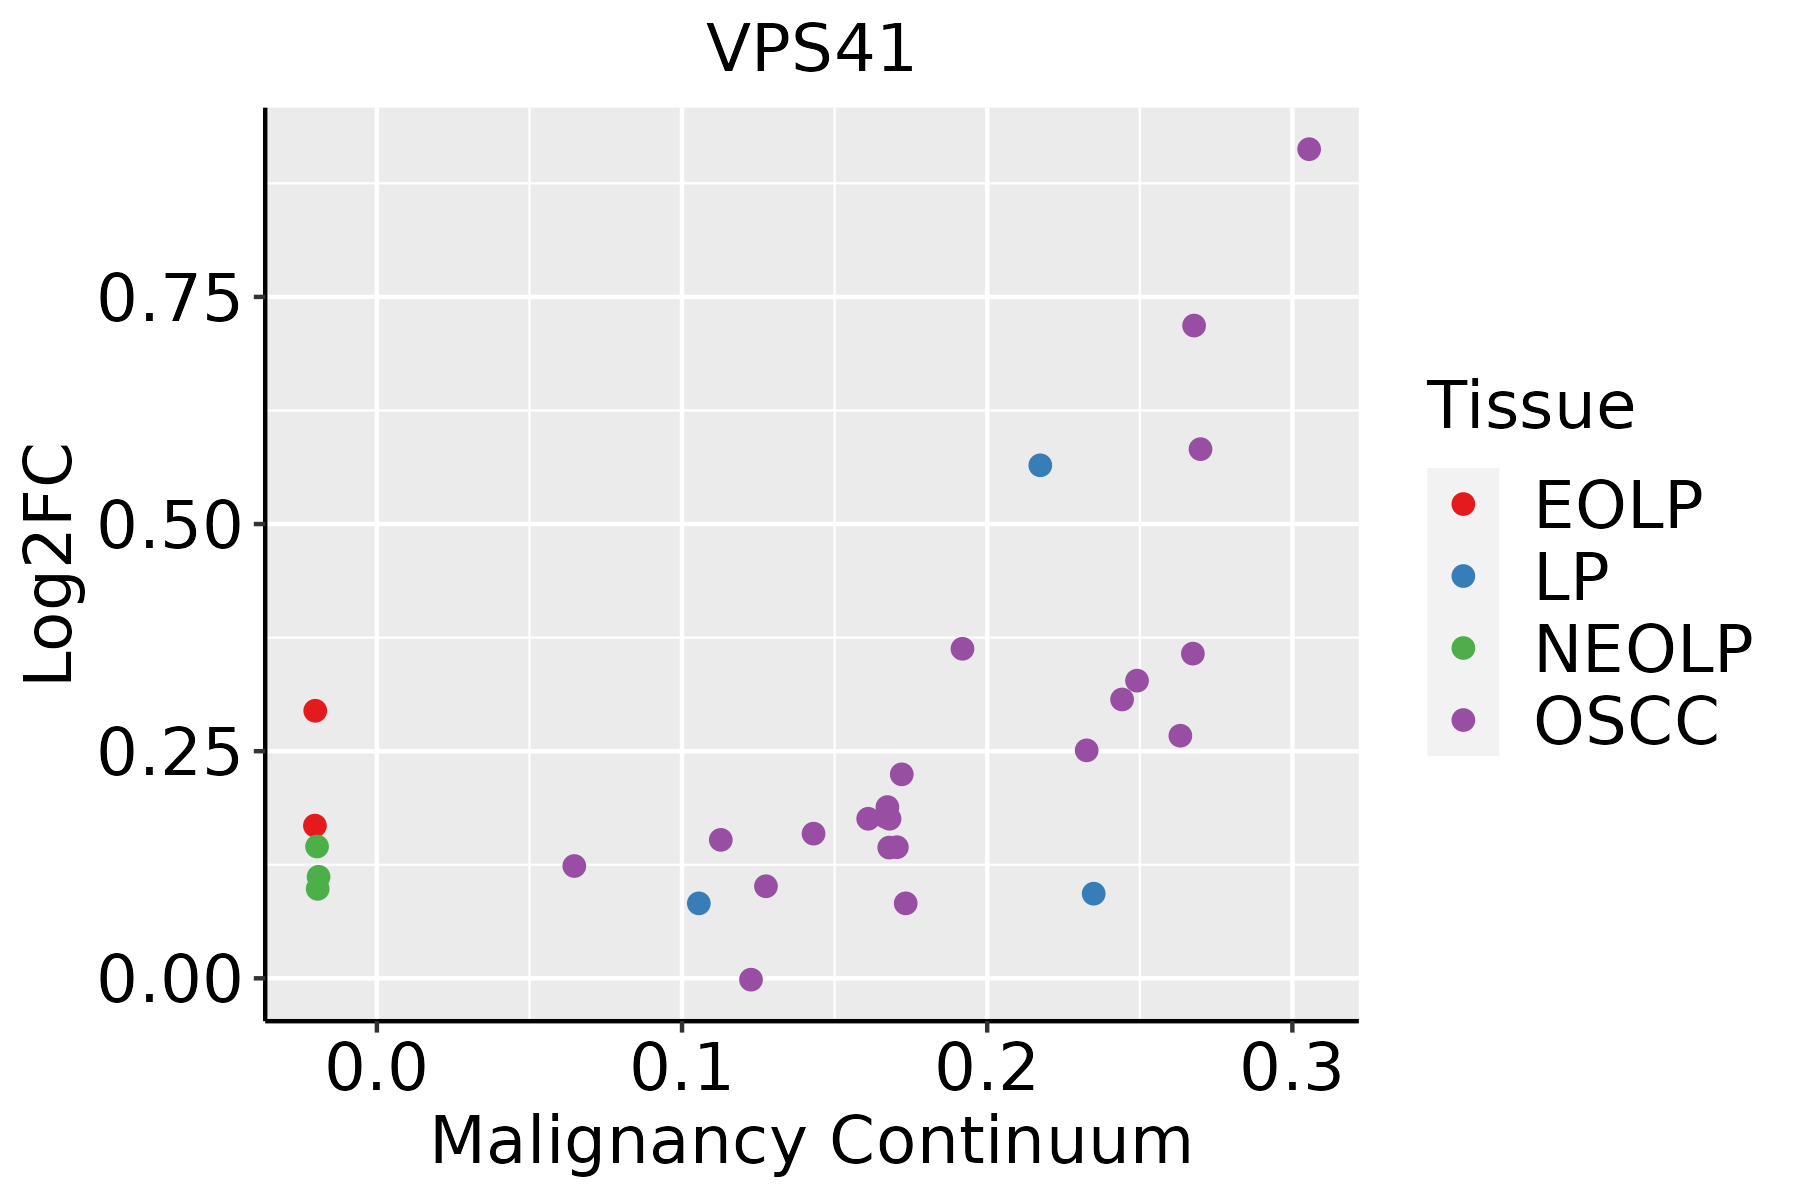 | EOLP: Erosive Oral lichen planus |
| LP: leukoplakia | ||
| NEOLP: Non-erosive oral lichen planus | ||
| OSCC: Oral squamous cell carcinoma | ||
| Prostate | 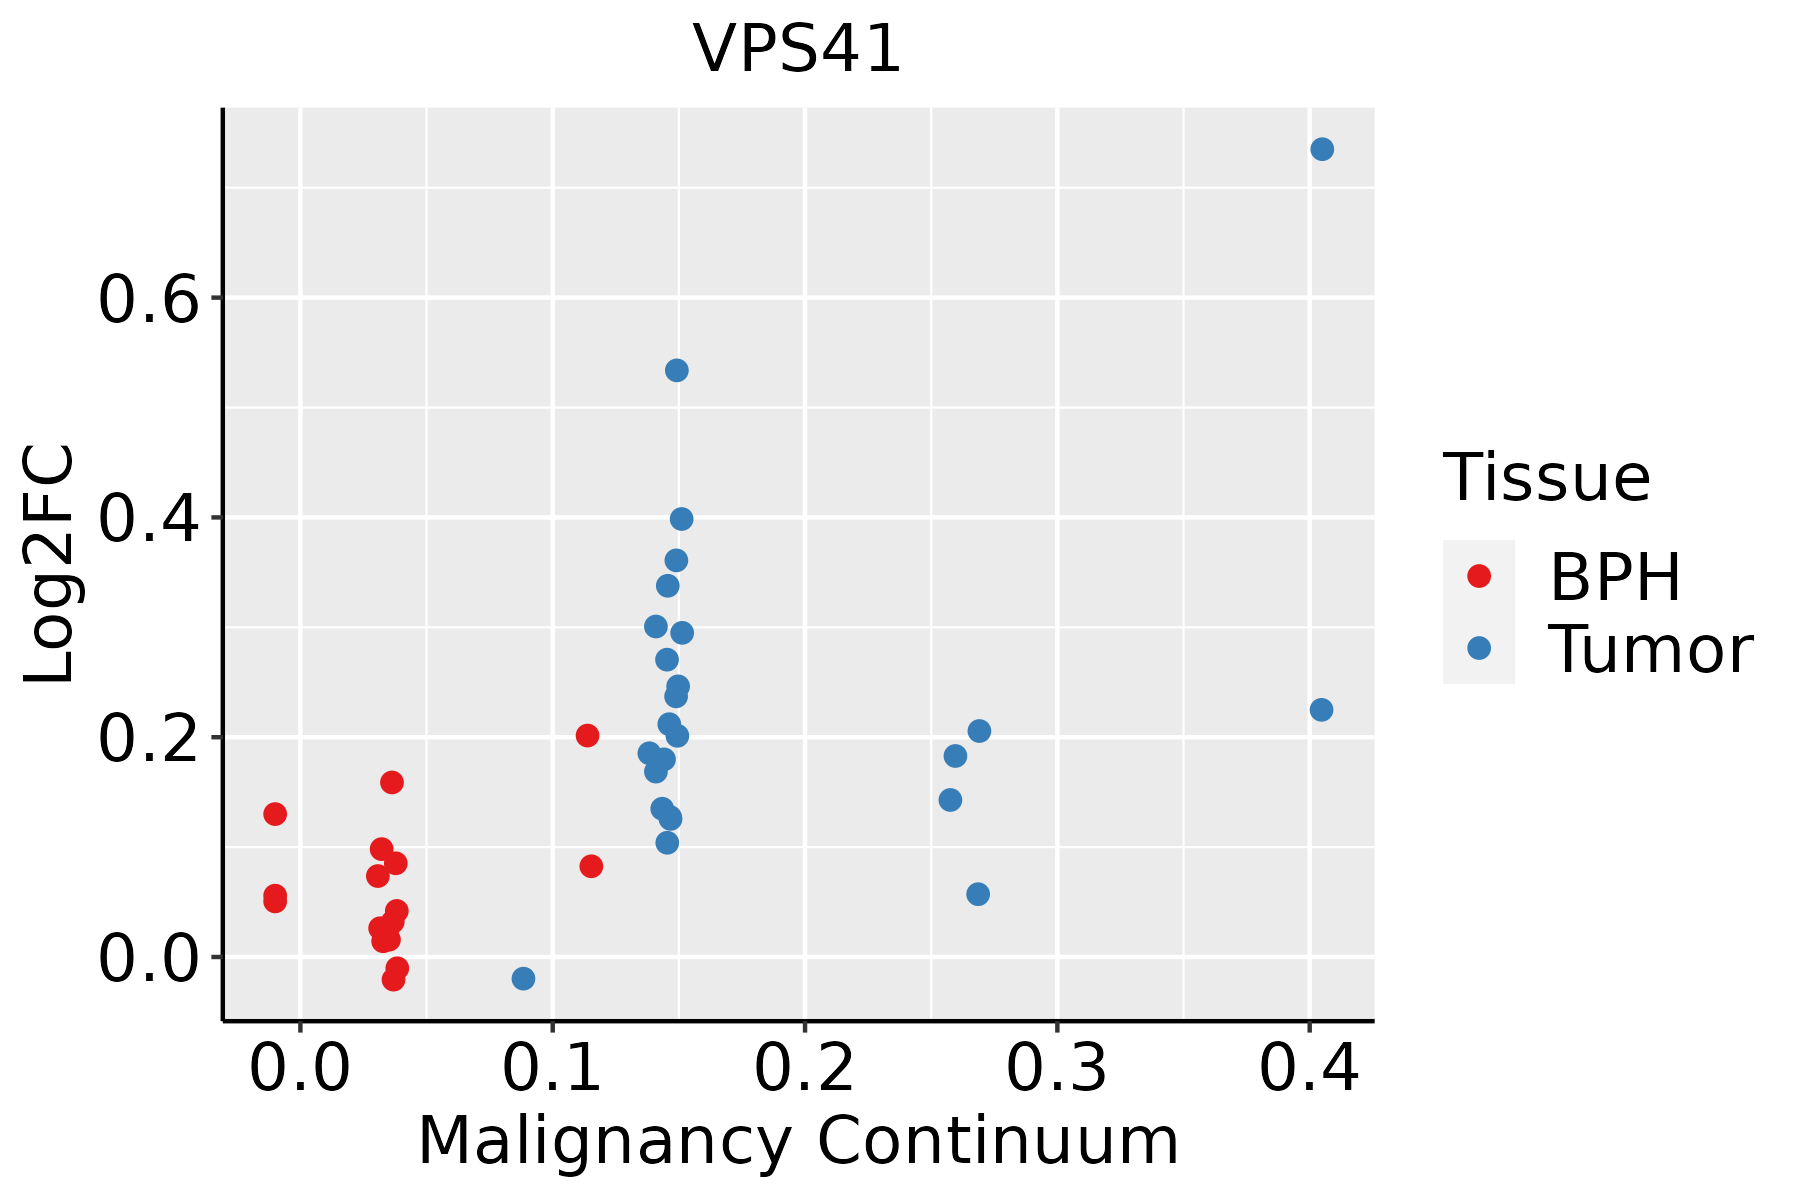 | BPH: Benign Prostatic Hyperplasia |
| Thyroid |  | ATC: Anaplastic thyroid cancer |
| HT: Hashimoto's thyroiditis | ||
| PTC: Papillary thyroid cancer |
| ∗log2FC in expression of this searched gene in stem-like cells from each diseased tissue sample relative to stem-like cells in normal samples in each tissue plotted against the malignancy continuum. Samples are colored based on if they are from different disease stage. |
Top |
Malignant transformation related pathway analysis |
| Find out the enriched GO biological processes and KEGG pathways involved in transition from healthy to precancer to cancer |
| Tissue | Disease Stage | Enriched GO biological Processes |
| Colorectum | AD |  |
| Colorectum | SER |  |
| Colorectum | MSS |  |
| Colorectum | MSI-H |  |
| Colorectum | FAP |  |
| ∗Top 15 enriched GO BP terms are showed in the bar plot of each disease state in each tissue. Each row represents a significant GO biological process which is colored according to the -log10(p.adjust). |
| Page: 1 2 3 4 5 6 7 8 9 |
| GO ID | Tissue | Disease Stage | Description | Gene Ratio | Bg Ratio | pvalue | p.adjust | Count |
| GO:0072594110 | Esophagus | ESCC | establishment of protein localization to organelle | 311/8552 | 422/18723 | 3.02e-32 | 2.13e-29 | 311 |
| GO:001623617 | Esophagus | ESCC | macroautophagy | 216/8552 | 291/18723 | 1.94e-23 | 4.57e-21 | 216 |
| GO:0006605111 | Esophagus | ESCC | protein targeting | 229/8552 | 314/18723 | 4.93e-23 | 1.01e-20 | 229 |
| GO:001605014 | Esophagus | ESCC | vesicle organization | 211/8552 | 300/18723 | 2.85e-18 | 2.87e-16 | 211 |
| GO:0071496111 | Esophagus | ESCC | cellular response to external stimulus | 215/8552 | 320/18723 | 4.29e-15 | 2.43e-13 | 215 |
| GO:000703417 | Esophagus | ESCC | vacuolar transport | 119/8552 | 157/18723 | 1.16e-14 | 6.30e-13 | 119 |
| GO:0031668111 | Esophagus | ESCC | cellular response to extracellular stimulus | 168/8552 | 246/18723 | 4.93e-13 | 2.23e-11 | 168 |
| GO:0031669110 | Esophagus | ESCC | cellular response to nutrient levels | 148/8552 | 215/18723 | 4.58e-12 | 1.76e-10 | 148 |
| GO:0031667111 | Esophagus | ESCC | response to nutrient levels | 289/8552 | 474/18723 | 9.25e-12 | 3.47e-10 | 289 |
| GO:0009267110 | Esophagus | ESCC | cellular response to starvation | 110/8552 | 156/18723 | 2.63e-10 | 7.37e-09 | 110 |
| GO:004259419 | Esophagus | ESCC | response to starvation | 133/8552 | 197/18723 | 4.31e-10 | 1.14e-08 | 133 |
| GO:00070419 | Esophagus | ESCC | lysosomal transport | 83/8552 | 114/18723 | 3.52e-09 | 7.41e-08 | 83 |
| GO:00726659 | Esophagus | ESCC | protein localization to vacuole | 52/8552 | 67/18723 | 9.14e-08 | 1.52e-06 | 52 |
| GO:00482844 | Esophagus | ESCC | organelle fusion | 94/8552 | 141/18723 | 3.72e-07 | 5.16e-06 | 94 |
| GO:00066238 | Esophagus | ESCC | protein targeting to vacuole | 31/8552 | 37/18723 | 1.95e-06 | 2.26e-05 | 31 |
| GO:00901743 | Esophagus | ESCC | organelle membrane fusion | 73/8552 | 110/18723 | 9.29e-06 | 8.88e-05 | 73 |
| GO:00069063 | Esophagus | ESCC | vesicle fusion | 70/8552 | 106/18723 | 1.82e-05 | 1.60e-04 | 70 |
| GO:00726668 | Esophagus | ESCC | establishment of protein localization to vacuole | 37/8552 | 49/18723 | 2.05e-05 | 1.78e-04 | 37 |
| GO:00083333 | Esophagus | ESCC | endosome to lysosome transport | 40/8552 | 55/18723 | 4.27e-05 | 3.42e-04 | 40 |
| GO:00610254 | Esophagus | ESCC | membrane fusion | 98/8552 | 163/18723 | 1.39e-04 | 9.41e-04 | 98 |
| Page: 1 2 3 4 5 6 7 8 9 10 |
| Pathway ID | Tissue | Disease Stage | Description | Gene Ratio | Bg Ratio | pvalue | p.adjust | qvalue | Count |
| hsa05132211 | Esophagus | ESCC | Salmonella infection | 191/4205 | 249/8465 | 6.51e-19 | 5.45e-17 | 2.79e-17 | 191 |
| hsa05132310 | Esophagus | ESCC | Salmonella infection | 191/4205 | 249/8465 | 6.51e-19 | 5.45e-17 | 2.79e-17 | 191 |
| hsa0513214 | Liver | NAFLD | Salmonella infection | 55/1043 | 249/8465 | 8.48e-06 | 3.09e-04 | 2.49e-04 | 55 |
| hsa0513215 | Liver | NAFLD | Salmonella infection | 55/1043 | 249/8465 | 8.48e-06 | 3.09e-04 | 2.49e-04 | 55 |
| hsa0513222 | Liver | Cirrhotic | Salmonella infection | 121/2530 | 249/8465 | 2.47e-10 | 5.13e-09 | 3.16e-09 | 121 |
| hsa0513232 | Liver | Cirrhotic | Salmonella infection | 121/2530 | 249/8465 | 2.47e-10 | 5.13e-09 | 3.16e-09 | 121 |
| hsa0513242 | Liver | HCC | Salmonella infection | 178/4020 | 249/8465 | 5.90e-15 | 1.98e-13 | 1.10e-13 | 178 |
| hsa0513252 | Liver | HCC | Salmonella infection | 178/4020 | 249/8465 | 5.90e-15 | 1.98e-13 | 1.10e-13 | 178 |
| hsa0513216 | Lung | IAC | Salmonella infection | 52/1053 | 249/8465 | 9.46e-05 | 1.28e-03 | 8.50e-04 | 52 |
| hsa0513217 | Lung | IAC | Salmonella infection | 52/1053 | 249/8465 | 9.46e-05 | 1.28e-03 | 8.50e-04 | 52 |
| hsa0513223 | Lung | AIS | Salmonella infection | 50/961 | 249/8465 | 3.47e-05 | 5.62e-04 | 3.59e-04 | 50 |
| hsa0513233 | Lung | AIS | Salmonella infection | 50/961 | 249/8465 | 3.47e-05 | 5.62e-04 | 3.59e-04 | 50 |
| hsa0513230 | Oral cavity | OSCC | Salmonella infection | 174/3704 | 249/8465 | 2.67e-17 | 1.49e-15 | 7.58e-16 | 174 |
| hsa05132114 | Oral cavity | OSCC | Salmonella infection | 174/3704 | 249/8465 | 2.67e-17 | 1.49e-15 | 7.58e-16 | 174 |
| hsa0513245 | Oral cavity | EOLP | Salmonella infection | 78/1218 | 249/8465 | 3.66e-12 | 2.37e-10 | 1.40e-10 | 78 |
| hsa0513255 | Oral cavity | EOLP | Salmonella infection | 78/1218 | 249/8465 | 3.66e-12 | 2.37e-10 | 1.40e-10 | 78 |
| hsa0513229 | Prostate | Tumor | Salmonella infection | 98/1791 | 249/8465 | 2.55e-11 | 5.28e-10 | 3.27e-10 | 98 |
| hsa0513237 | Prostate | Tumor | Salmonella infection | 98/1791 | 249/8465 | 2.55e-11 | 5.28e-10 | 3.27e-10 | 98 |
| Page: 1 |
Top |
Cell-cell communication analysis |
| Identification of potential cell-cell interactions between two cell types and their ligand-receptor pairs for different disease states |
| Ligand | Receptor | LRpair | Pathway | Tissue | Disease Stage |
| Page: 1 |
Top |
Single-cell gene regulatory network inference analysis |
| Find out the significant the regulons (TFs) and the target genes of each regulon across cell types for different disease states |
| TF | Cell Type | Tissue | Disease Stage | Target Gene | RSS | Regulon Activity |
| ∗The dot plots of a searched regulon are shown for all cell subpopulations in each disease state of each tissue based on the regulon specific score inferred using pySCENIC and by calculating the average expression. |
| Page: 1 |
Top |
Somatic mutation of malignant transformation related genes |
| Annotation of somatic variants for genes involved in malignant transformation |
| Hugo Symbol | Variant Class | Variant Classification | dbSNP RS | HGVSc | HGVSp | HGVSp Short | SWISSPROT | BIOTYPE | SIFT | PolyPhen | Tumor Sample Barcode | Tissue | Histology | Sex | Age | Stage | Therapy Types | Drugs | Outcome |
| VPS41 | SNV | Missense_Mutation | novel | c.1264C>A | p.Leu422Ile | p.L422I | P49754 | protein_coding | deleterious(0.01) | probably_damaging(0.991) | TCGA-AN-A046-01 | Breast | breast invasive carcinoma | Female | >=65 | I/II | Unknown | Unknown | SD |
| VPS41 | SNV | Missense_Mutation | novel | c.1835N>G | p.Tyr612Cys | p.Y612C | P49754 | protein_coding | deleterious(0) | possibly_damaging(0.733) | TCGA-AN-A0AK-01 | Breast | breast invasive carcinoma | Female | >=65 | I/II | Unknown | Unknown | SD |
| VPS41 | SNV | Missense_Mutation | c.1566N>C | p.Lys522Asn | p.K522N | P49754 | protein_coding | tolerated(0.12) | benign(0.022) | TCGA-B6-A0RV-01 | Breast | breast invasive carcinoma | Female | <65 | III/IV | Unknown | Unknown | SD | |
| VPS41 | SNV | Missense_Mutation | c.2281N>G | p.Lys761Glu | p.K761E | P49754 | protein_coding | deleterious(0.01) | possibly_damaging(0.907) | TCGA-C8-A12X-01 | Breast | breast invasive carcinoma | Female | <65 | I/II | Unknown | Unknown | SD | |
| VPS41 | SNV | Missense_Mutation | c.1189N>T | p.Ile397Phe | p.I397F | P49754 | protein_coding | deleterious(0) | possibly_damaging(0.879) | TCGA-C8-A132-01 | Breast | breast invasive carcinoma | Female | <65 | I/II | Unknown | Unknown | SD | |
| VPS41 | SNV | Missense_Mutation | rs755139889 | c.73G>A | p.Glu25Lys | p.E25K | P49754 | protein_coding | deleterious(0.01) | probably_damaging(0.935) | TCGA-E2-A56Z-01 | Breast | breast invasive carcinoma | Female | >=65 | I/II | Hormone Therapy | arimidex | SD |
| VPS41 | insertion | Frame_Shift_Ins | novel | c.575_576insTAAAA | p.Ile194ArgfsTer20 | p.I194Rfs*20 | P49754 | protein_coding | TCGA-AR-A0TU-01 | Breast | breast invasive carcinoma | Female | <65 | I/II | Unspecific | Doxorubicin | SD | ||
| VPS41 | deletion | Frame_Shift_Del | novel | c.1866delN | p.Glu622AspfsTer32 | p.E622Dfs*32 | P49754 | protein_coding | TCGA-D8-A27V-01 | Breast | breast invasive carcinoma | Female | <65 | I/II | Hormone Therapy | tamoxiphen | SD | ||
| VPS41 | deletion | Frame_Shift_Del | novel | c.1274delN | p.Asn425MetfsTer32 | p.N425Mfs*32 | P49754 | protein_coding | TCGA-EW-A2FV-01 | Breast | breast invasive carcinoma | Female | <65 | III/IV | Chemotherapy | docetaxel | SD | ||
| VPS41 | SNV | Missense_Mutation | novel | c.1483N>A | p.Gln495Lys | p.Q495K | P49754 | protein_coding | tolerated(0.15) | benign(0.201) | TCGA-C5-A8XJ-01 | Cervix | cervical & endocervical cancer | Female | >=65 | I/II | Chemotherapy | cisplatin | SD |
| Page: 1 2 3 4 5 6 7 8 9 10 11 |
Top |
Related drugs of malignant transformation related genes |
| Identification of chemicals and drugs interact with genes involved in malignant transfromation |
| (DGIdb 4.0) |
| Entrez ID | Symbol | Category | Interaction Types | Drug Claim Name | Drug Name | PMIDs |
| Page: 1 |

Copyright 2023-Present -The University of Texas Health Science Center at Houston |