
|
|||||
|
 | |
| |
| |
| |
| |
| |
|
Gene: VPS37B |
Gene summary for VPS37B |
| Gene information | Species | Human | Gene symbol | VPS37B | Gene ID | 79720 |
| Gene name | VPS37B subunit of ESCRT-I | |
| Gene Alias | VPS37B | |
| Cytomap | 12q24.31 | |
| Gene Type | protein-coding | GO ID | GO:0006508 | UniProtAcc | A0A024RBU0 |
Top |
Malignant transformation analysis |
| Identification of the aberrant gene expression in precancerous and cancerous lesions by comparing the gene expression of stem-like cells in diseased tissues with normal stem cells |
| Entrez ID | Symbol | Replicates | Species | Organ | Tissue | Adj P-value | Log2FC | Malignancy |
| 79720 | VPS37B | CCI_1 | Human | Cervix | CC | 1.52e-02 | 7.09e-01 | 0.528 |
| 79720 | VPS37B | CCI_3 | Human | Cervix | CC | 2.56e-02 | 4.54e-01 | 0.516 |
| 79720 | VPS37B | HTA11_3410_2000001011 | Human | Colorectum | AD | 4.90e-17 | -5.63e-01 | 0.0155 |
| 79720 | VPS37B | HTA11_2487_2000001011 | Human | Colorectum | SER | 2.12e-07 | -5.28e-01 | -0.1808 |
| 79720 | VPS37B | HTA11_1938_2000001011 | Human | Colorectum | AD | 1.27e-04 | -5.05e-01 | -0.0811 |
| 79720 | VPS37B | HTA11_78_2000001011 | Human | Colorectum | AD | 4.88e-04 | -4.01e-01 | -0.1088 |
| 79720 | VPS37B | HTA11_347_2000001011 | Human | Colorectum | AD | 5.00e-06 | -3.41e-01 | -0.1954 |
| 79720 | VPS37B | HTA11_3361_2000001011 | Human | Colorectum | AD | 5.50e-05 | -5.08e-01 | -0.1207 |
| 79720 | VPS37B | HTA11_83_2000001011 | Human | Colorectum | SER | 8.90e-04 | -5.16e-01 | -0.1526 |
| 79720 | VPS37B | HTA11_696_2000001011 | Human | Colorectum | AD | 1.72e-13 | -4.96e-01 | -0.1464 |
| 79720 | VPS37B | HTA11_866_2000001011 | Human | Colorectum | AD | 5.32e-09 | -4.97e-01 | -0.1001 |
| 79720 | VPS37B | HTA11_1391_2000001011 | Human | Colorectum | AD | 3.97e-08 | -4.70e-01 | -0.059 |
| 79720 | VPS37B | HTA11_546_2000001011 | Human | Colorectum | AD | 3.30e-04 | -5.54e-01 | -0.0842 |
| 79720 | VPS37B | HTA11_866_3004761011 | Human | Colorectum | AD | 5.61e-17 | -5.81e-01 | 0.096 |
| 79720 | VPS37B | HTA11_4255_2000001011 | Human | Colorectum | SER | 5.34e-03 | -6.07e-01 | 0.0446 |
| 79720 | VPS37B | HTA11_8622_2000001021 | Human | Colorectum | SER | 3.34e-03 | -5.83e-01 | 0.0528 |
| 79720 | VPS37B | HTA11_10711_2000001011 | Human | Colorectum | AD | 2.92e-08 | -5.54e-01 | 0.0338 |
| 79720 | VPS37B | HTA11_7696_3000711011 | Human | Colorectum | AD | 4.28e-17 | -5.62e-01 | 0.0674 |
| 79720 | VPS37B | HTA11_6818_2000001011 | Human | Colorectum | AD | 4.43e-02 | -5.23e-01 | 0.0112 |
| 79720 | VPS37B | HTA11_6818_2000001021 | Human | Colorectum | AD | 1.58e-07 | -5.79e-01 | 0.0588 |
| Page: 1 2 3 4 5 6 7 8 9 |
| Tissue | Expression Dynamics | Abbreviation |
| Cervix | 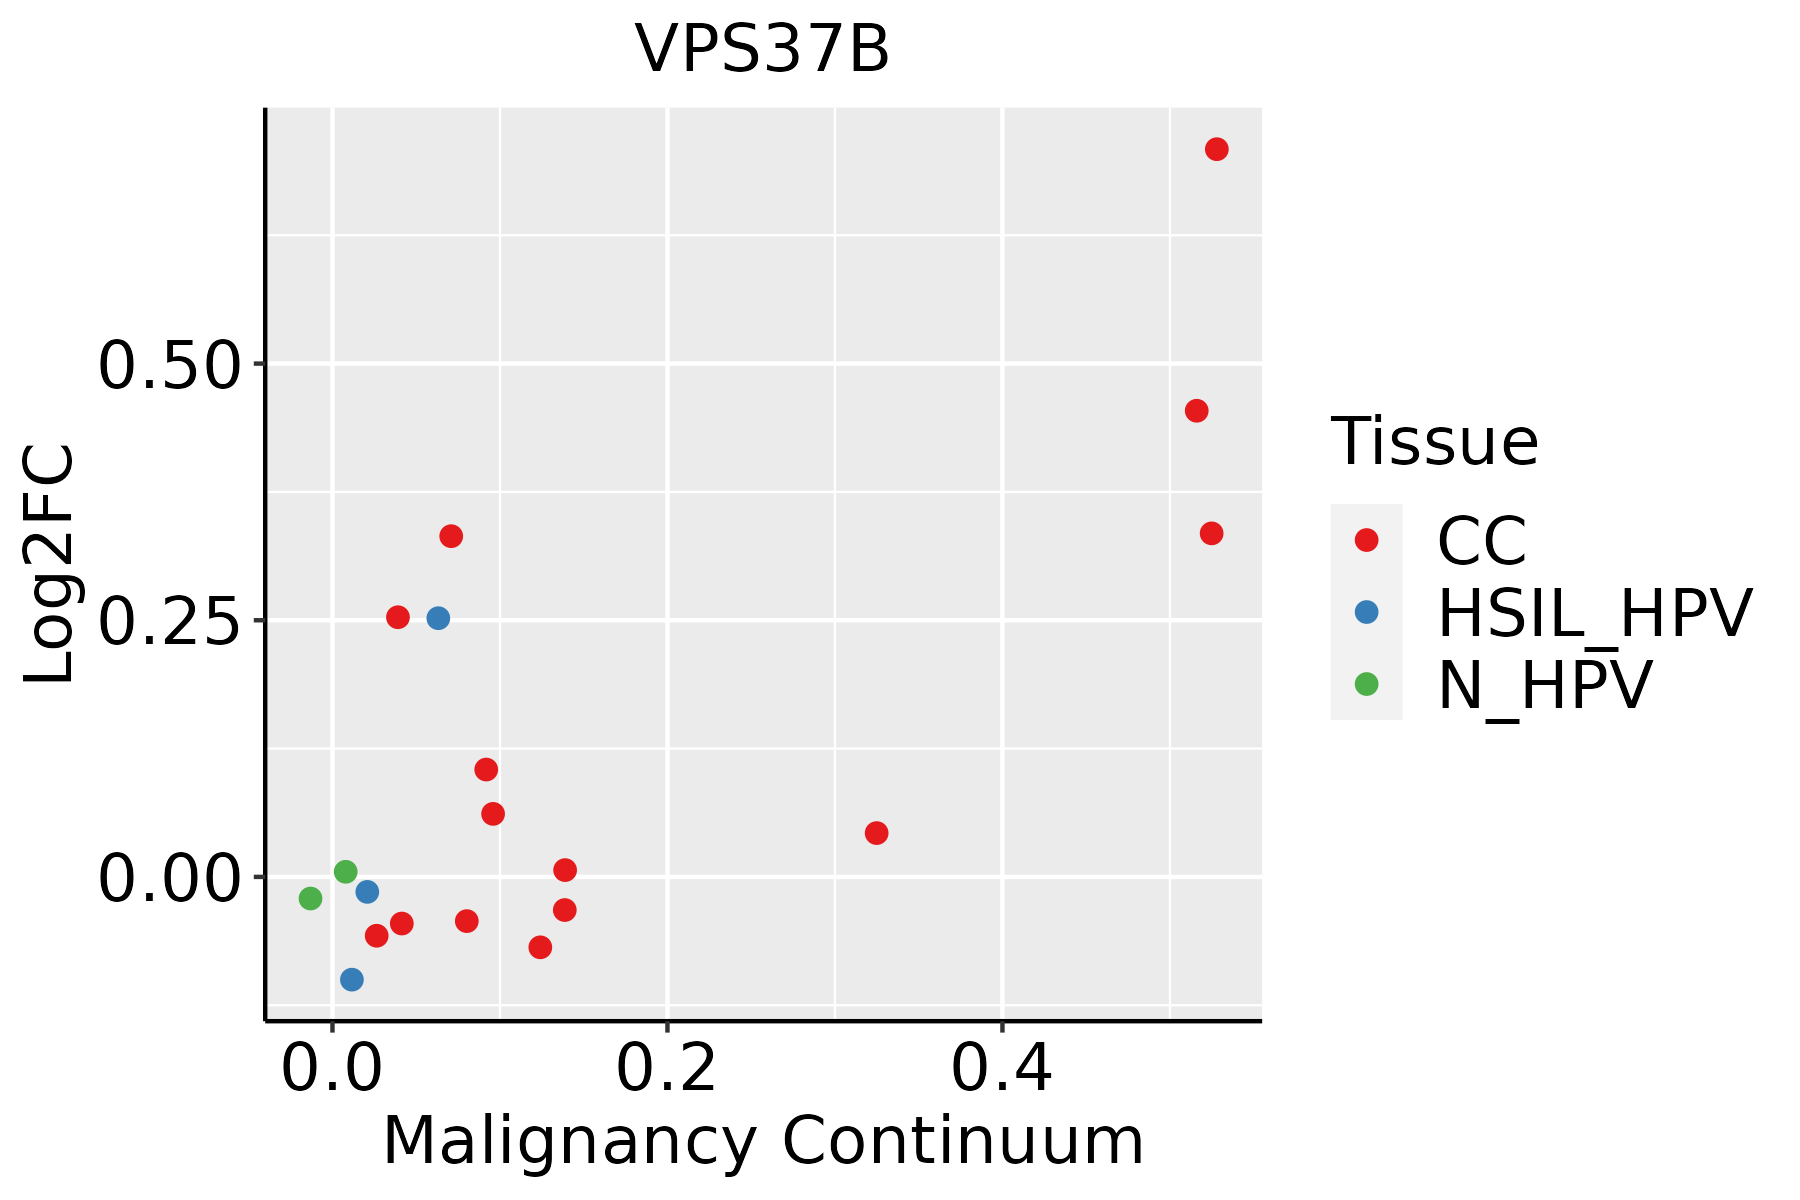 | CC: Cervix cancer |
| HSIL_HPV: HPV-infected high-grade squamous intraepithelial lesions | ||
| N_HPV: HPV-infected normal cervix | ||
| Colorectum (GSE201348) |  | FAP: Familial adenomatous polyposis |
| CRC: Colorectal cancer | ||
| Colorectum (HTA11) | 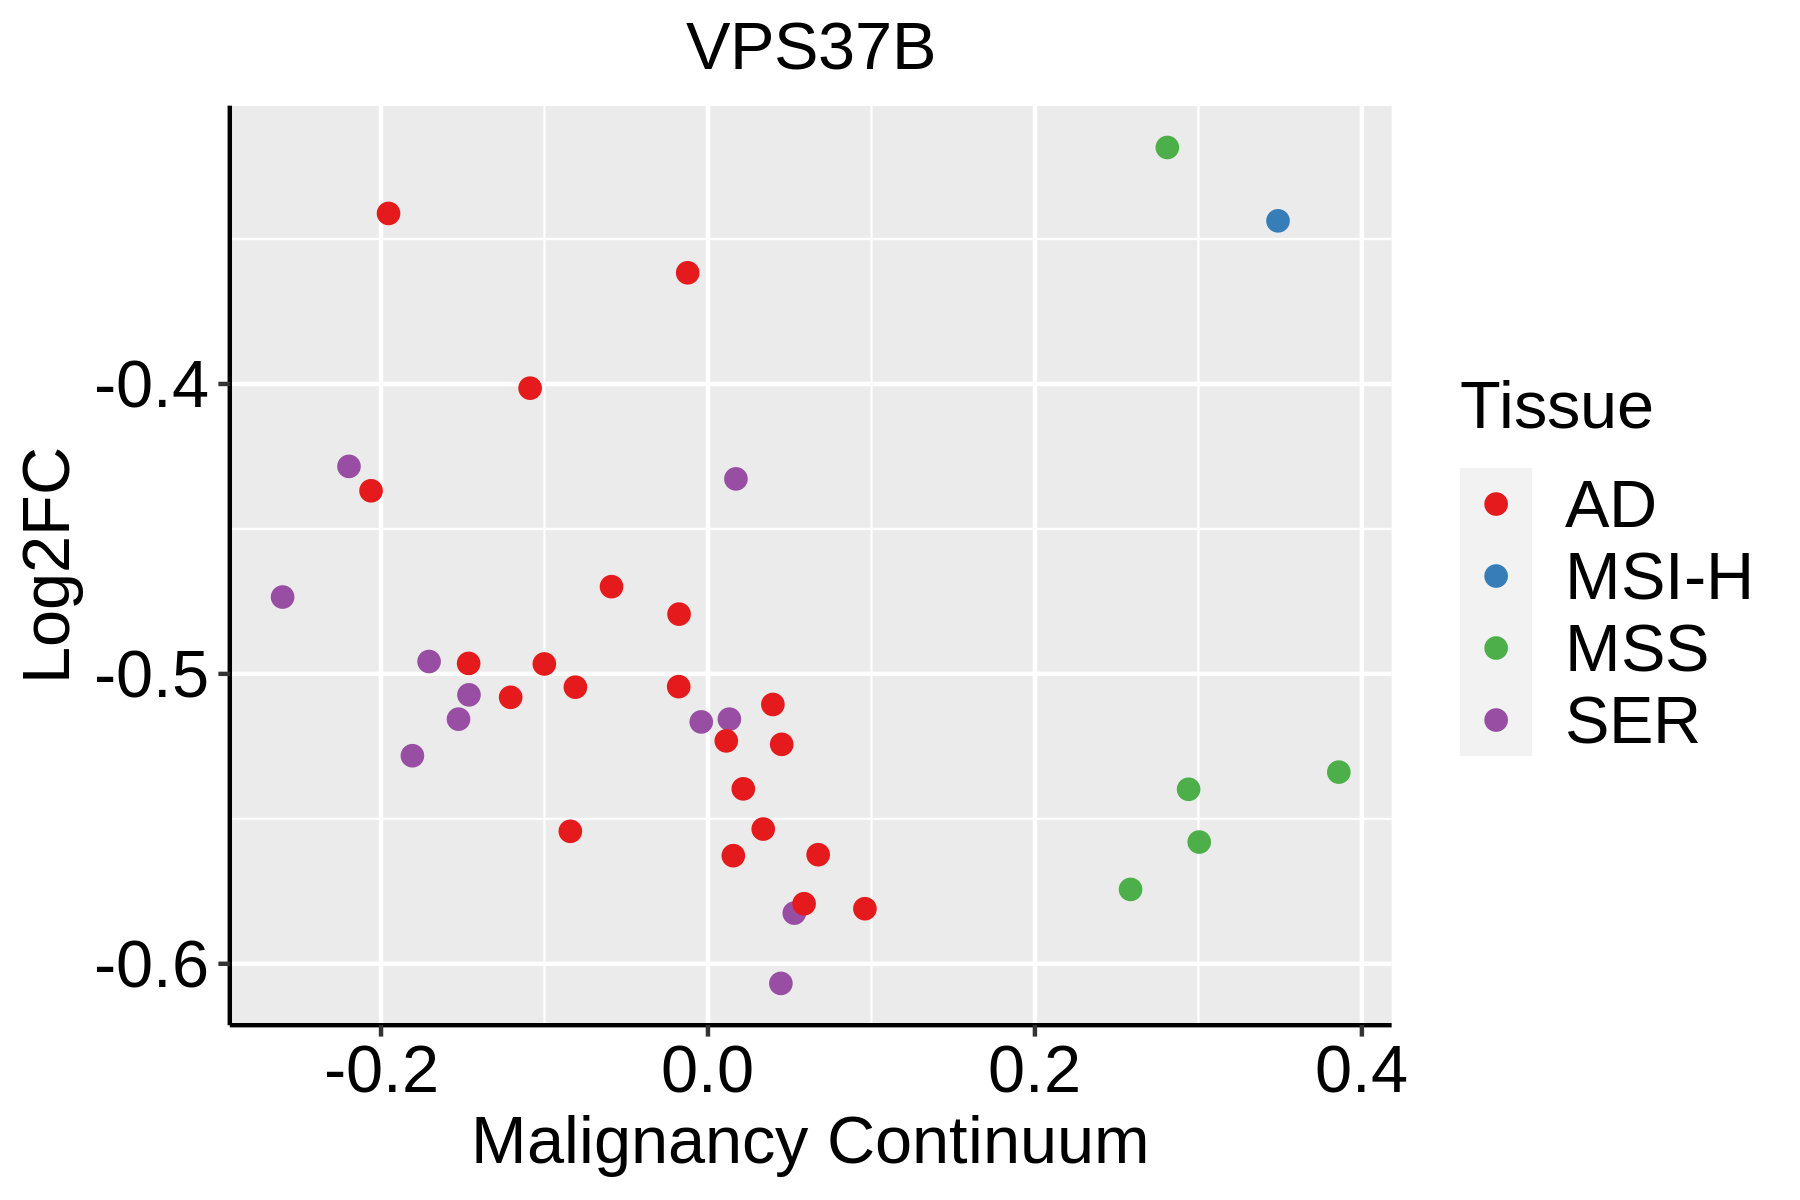 | AD: Adenomas |
| SER: Sessile serrated lesions | ||
| MSI-H: Microsatellite-high colorectal cancer | ||
| MSS: Microsatellite stable colorectal cancer | ||
| Endometrium | 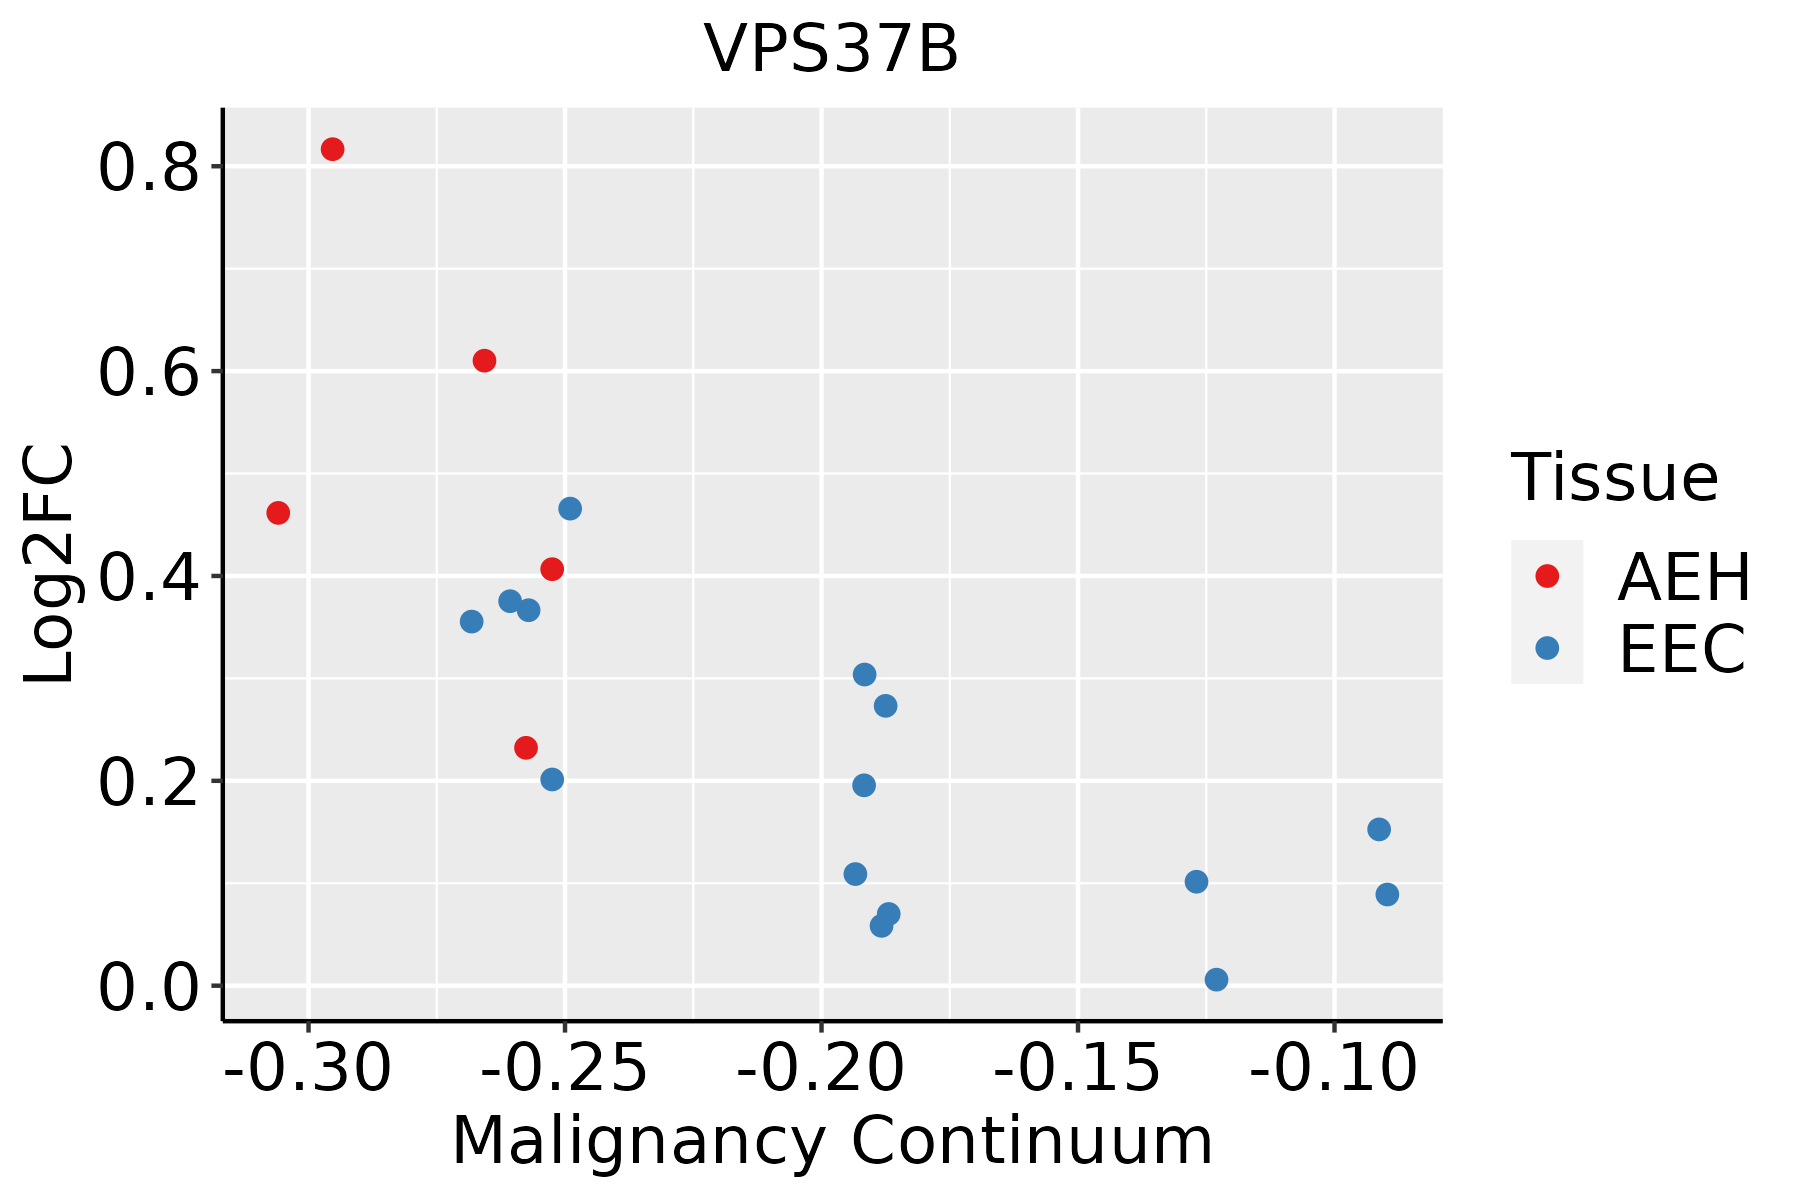 | AEH: Atypical endometrial hyperplasia |
| EEC: Endometrioid Cancer | ||
| Esophagus | 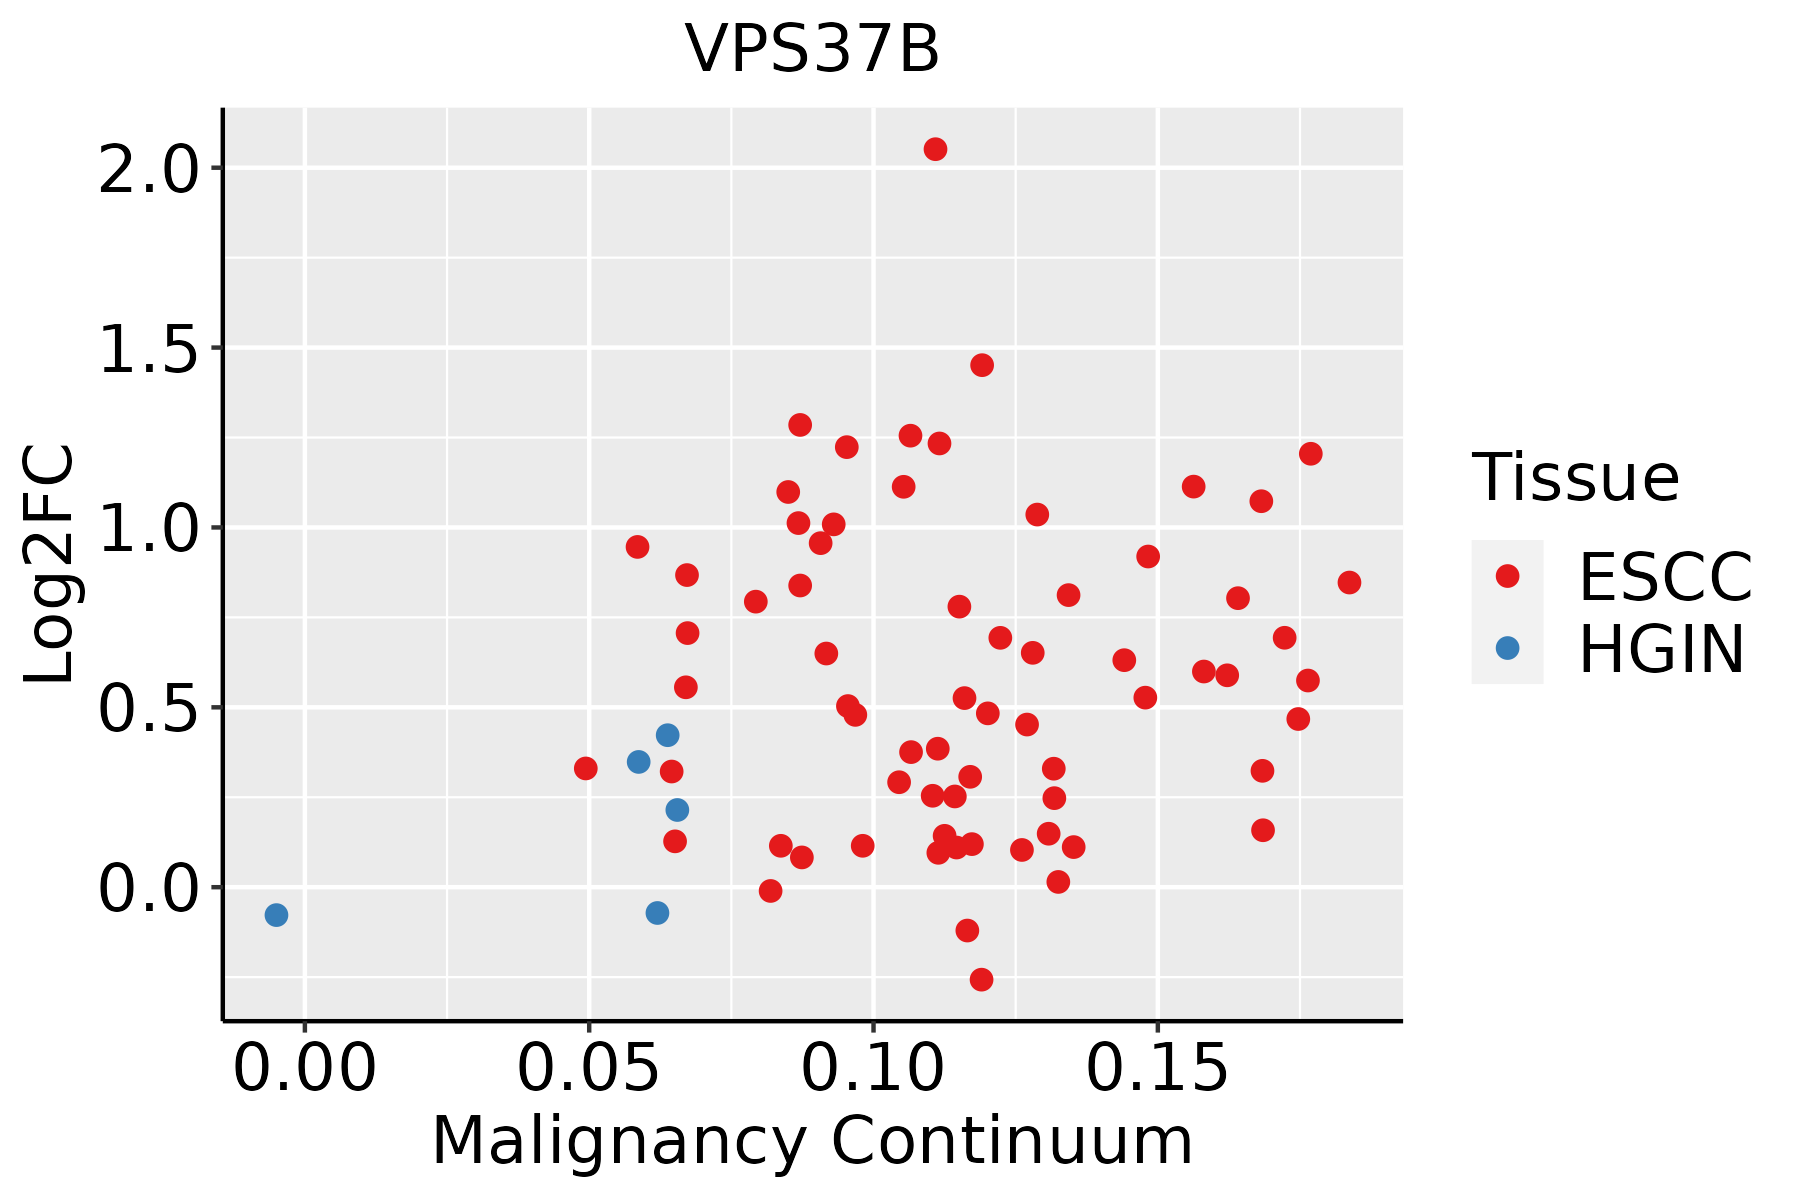 | ESCC: Esophageal squamous cell carcinoma |
| HGIN: High-grade intraepithelial neoplasias | ||
| LGIN: Low-grade intraepithelial neoplasias | ||
| Liver |  | HCC: Hepatocellular carcinoma |
| NAFLD: Non-alcoholic fatty liver disease | ||
| Lung | 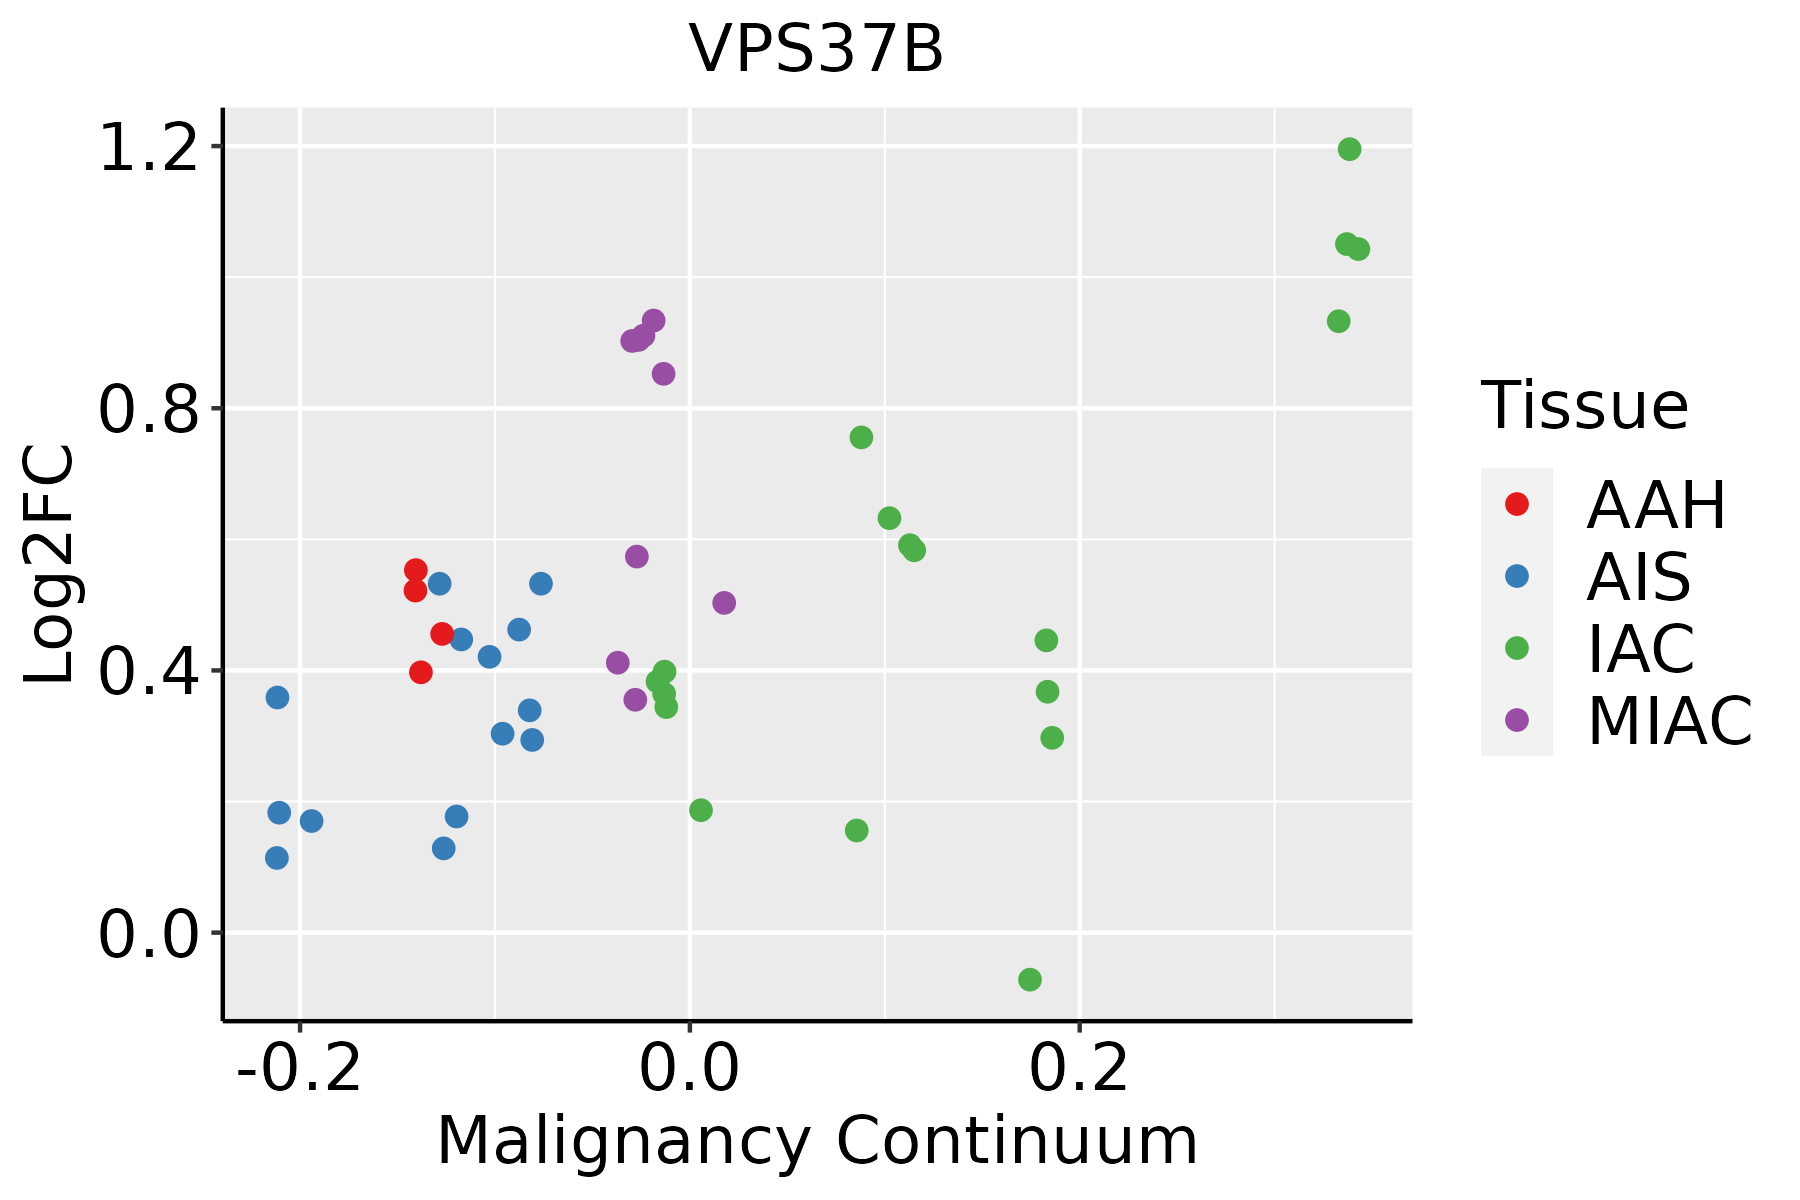 | AAH: Atypical adenomatous hyperplasia |
| AIS: Adenocarcinoma in situ | ||
| IAC: Invasive lung adenocarcinoma | ||
| MIA: Minimally invasive adenocarcinoma | ||
| Oral Cavity |  | EOLP: Erosive Oral lichen planus |
| LP: leukoplakia | ||
| NEOLP: Non-erosive oral lichen planus | ||
| OSCC: Oral squamous cell carcinoma | ||
| Skin | 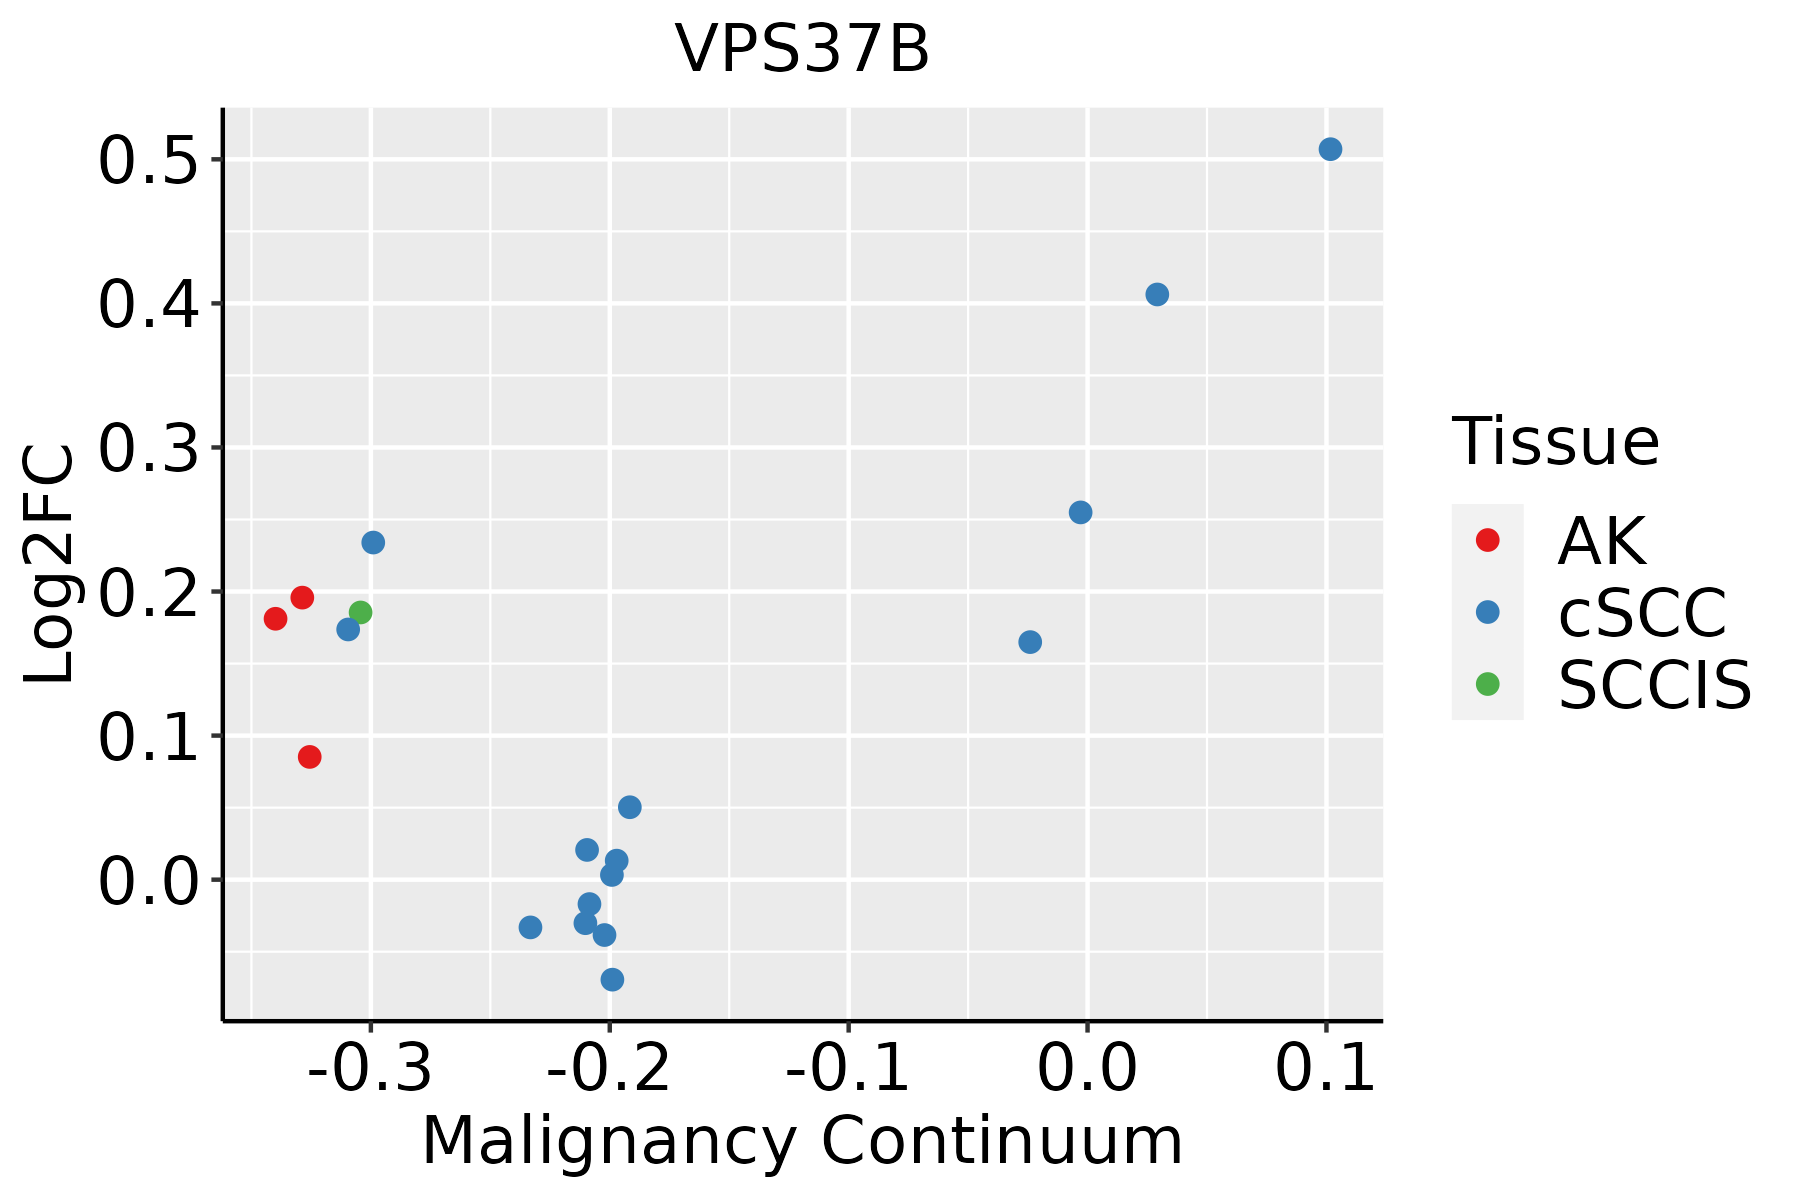 | AK: Actinic keratosis |
| cSCC: Cutaneous squamous cell carcinoma | ||
| SCCIS:squamous cell carcinoma in situ | ||
| Thyroid |  | ATC: Anaplastic thyroid cancer |
| HT: Hashimoto's thyroiditis | ||
| PTC: Papillary thyroid cancer |
| ∗log2FC in expression of this searched gene in stem-like cells from each diseased tissue sample relative to stem-like cells in normal samples in each tissue plotted against the malignancy continuum. Samples are colored based on if they are from different disease stage. |
Top |
Malignant transformation related pathway analysis |
| Find out the enriched GO biological processes and KEGG pathways involved in transition from healthy to precancer to cancer |
| Tissue | Disease Stage | Enriched GO biological Processes |
| Colorectum | AD |  |
| Colorectum | SER |  |
| Colorectum | MSS |  |
| Colorectum | MSI-H |  |
| Colorectum | FAP |  |
| ∗Top 15 enriched GO BP terms are showed in the bar plot of each disease state in each tissue. Each row represents a significant GO biological process which is colored according to the -log10(p.adjust). |
| Page: 1 2 3 4 5 6 7 8 9 |
| GO ID | Tissue | Disease Stage | Description | Gene Ratio | Bg Ratio | pvalue | p.adjust | Count |
| GO:001603210 | Cervix | CC | viral process | 109/2311 | 415/18723 | 5.40e-15 | 6.46e-12 | 109 |
| GO:001905810 | Cervix | CC | viral life cycle | 87/2311 | 317/18723 | 2.20e-13 | 1.20e-10 | 87 |
| GO:00725949 | Cervix | CC | establishment of protein localization to organelle | 99/2311 | 422/18723 | 1.23e-10 | 2.11e-08 | 99 |
| GO:005212610 | Cervix | CC | movement in host environment | 52/2311 | 175/18723 | 7.03e-10 | 8.76e-08 | 52 |
| GO:005170110 | Cervix | CC | biological process involved in interaction with host | 57/2311 | 203/18723 | 1.18e-09 | 1.41e-07 | 57 |
| GO:004440310 | Cervix | CC | biological process involved in symbiotic interaction | 71/2311 | 290/18723 | 7.94e-09 | 6.98e-07 | 71 |
| GO:000660510 | Cervix | CC | protein targeting | 68/2311 | 314/18723 | 2.17e-06 | 6.55e-05 | 68 |
| GO:00901509 | Cervix | CC | establishment of protein localization to membrane | 54/2311 | 260/18723 | 7.67e-05 | 1.05e-03 | 54 |
| GO:005079210 | Cervix | CC | regulation of viral process | 38/2311 | 164/18723 | 8.12e-05 | 1.10e-03 | 38 |
| GO:00726655 | Cervix | CC | protein localization to vacuole | 20/2311 | 67/18723 | 1.12e-04 | 1.40e-03 | 20 |
| GO:00162367 | Cervix | CC | macroautophagy | 58/2311 | 291/18723 | 1.40e-04 | 1.70e-03 | 58 |
| GO:190390010 | Cervix | CC | regulation of viral life cycle | 33/2311 | 148/18723 | 4.86e-04 | 4.76e-03 | 33 |
| GO:00070347 | Cervix | CC | vacuolar transport | 34/2311 | 157/18723 | 7.03e-04 | 6.40e-03 | 34 |
| GO:004390310 | Cervix | CC | regulation of biological process involved in symbiotic interaction | 19/2311 | 72/18723 | 9.11e-04 | 7.81e-03 | 19 |
| GO:00066235 | Cervix | CC | protein targeting to vacuole | 12/2311 | 37/18723 | 1.15e-03 | 9.39e-03 | 12 |
| GO:00726665 | Cervix | CC | establishment of protein localization to vacuole | 14/2311 | 49/18723 | 1.84e-03 | 1.37e-02 | 14 |
| GO:00160506 | Cervix | CC | vesicle organization | 54/2311 | 300/18723 | 2.71e-03 | 1.85e-02 | 54 |
| GO:0016032 | Colorectum | AD | viral process | 168/3918 | 415/18723 | 4.67e-20 | 3.66e-17 | 168 |
| GO:0019058 | Colorectum | AD | viral life cycle | 119/3918 | 317/18723 | 6.18e-12 | 8.23e-10 | 119 |
| GO:0072594 | Colorectum | AD | establishment of protein localization to organelle | 148/3918 | 422/18723 | 7.95e-12 | 1.04e-09 | 148 |
| Page: 1 2 3 4 5 6 7 8 9 10 11 12 13 14 15 16 17 18 19 20 21 22 23 24 |
| Pathway ID | Tissue | Disease Stage | Description | Gene Ratio | Bg Ratio | pvalue | p.adjust | qvalue | Count |
| hsa0414418 | Cervix | CC | Endocytosis | 64/1267 | 251/8465 | 6.97e-06 | 6.10e-05 | 3.61e-05 | 64 |
| hsa0414419 | Cervix | CC | Endocytosis | 64/1267 | 251/8465 | 6.97e-06 | 6.10e-05 | 3.61e-05 | 64 |
| hsa04144 | Colorectum | AD | Endocytosis | 111/2092 | 251/8465 | 5.95e-12 | 1.42e-10 | 9.08e-11 | 111 |
| hsa041441 | Colorectum | AD | Endocytosis | 111/2092 | 251/8465 | 5.95e-12 | 1.42e-10 | 9.08e-11 | 111 |
| hsa041442 | Colorectum | SER | Endocytosis | 81/1580 | 251/8465 | 1.14e-07 | 2.36e-06 | 1.71e-06 | 81 |
| hsa041443 | Colorectum | SER | Endocytosis | 81/1580 | 251/8465 | 1.14e-07 | 2.36e-06 | 1.71e-06 | 81 |
| hsa041444 | Colorectum | MSS | Endocytosis | 102/1875 | 251/8465 | 1.85e-11 | 4.43e-10 | 2.71e-10 | 102 |
| hsa041445 | Colorectum | MSS | Endocytosis | 102/1875 | 251/8465 | 1.85e-11 | 4.43e-10 | 2.71e-10 | 102 |
| hsa041446 | Colorectum | FAP | Endocytosis | 78/1404 | 251/8465 | 6.20e-09 | 2.96e-07 | 1.80e-07 | 78 |
| hsa041447 | Colorectum | FAP | Endocytosis | 78/1404 | 251/8465 | 6.20e-09 | 2.96e-07 | 1.80e-07 | 78 |
| hsa041448 | Colorectum | CRC | Endocytosis | 65/1091 | 251/8465 | 1.27e-08 | 1.06e-06 | 7.19e-07 | 65 |
| hsa041449 | Colorectum | CRC | Endocytosis | 65/1091 | 251/8465 | 1.27e-08 | 1.06e-06 | 7.19e-07 | 65 |
| hsa0414420 | Endometrium | AEH | Endocytosis | 56/1197 | 251/8465 | 2.58e-04 | 2.15e-03 | 1.57e-03 | 56 |
| hsa04144110 | Endometrium | AEH | Endocytosis | 56/1197 | 251/8465 | 2.58e-04 | 2.15e-03 | 1.57e-03 | 56 |
| hsa0414424 | Endometrium | EEC | Endocytosis | 57/1237 | 251/8465 | 3.34e-04 | 2.82e-03 | 2.10e-03 | 57 |
| hsa0414434 | Endometrium | EEC | Endocytosis | 57/1237 | 251/8465 | 3.34e-04 | 2.82e-03 | 2.10e-03 | 57 |
| hsa04144210 | Esophagus | ESCC | Endocytosis | 186/4205 | 251/8465 | 9.74e-16 | 4.66e-14 | 2.39e-14 | 186 |
| hsa0414437 | Esophagus | ESCC | Endocytosis | 186/4205 | 251/8465 | 9.74e-16 | 4.66e-14 | 2.39e-14 | 186 |
| hsa0414412 | Liver | Cirrhotic | Endocytosis | 119/2530 | 251/8465 | 2.33e-09 | 4.56e-08 | 2.81e-08 | 119 |
| hsa0414413 | Liver | Cirrhotic | Endocytosis | 119/2530 | 251/8465 | 2.33e-09 | 4.56e-08 | 2.81e-08 | 119 |
| Page: 1 2 |
Top |
Cell-cell communication analysis |
| Identification of potential cell-cell interactions between two cell types and their ligand-receptor pairs for different disease states |
| Ligand | Receptor | LRpair | Pathway | Tissue | Disease Stage |
| Page: 1 |
Top |
Single-cell gene regulatory network inference analysis |
| Find out the significant the regulons (TFs) and the target genes of each regulon across cell types for different disease states |
| TF | Cell Type | Tissue | Disease Stage | Target Gene | RSS | Regulon Activity |
| ∗The dot plots of a searched regulon are shown for all cell subpopulations in each disease state of each tissue based on the regulon specific score inferred using pySCENIC and by calculating the average expression. |
| Page: 1 |
Top |
Somatic mutation of malignant transformation related genes |
| Annotation of somatic variants for genes involved in malignant transformation |
| Hugo Symbol | Variant Class | Variant Classification | dbSNP RS | HGVSc | HGVSp | HGVSp Short | SWISSPROT | BIOTYPE | SIFT | PolyPhen | Tumor Sample Barcode | Tissue | Histology | Sex | Age | Stage | Therapy Types | Drugs | Outcome |
| VPS37B | SNV | Missense_Mutation | c.214C>G | p.Arg72Gly | p.R72G | Q9H9H4 | protein_coding | tolerated(0.22) | benign(0.07) | TCGA-A2-A0YG-01 | Breast | breast invasive carcinoma | Female | <65 | III/IV | Chemotherapy | cytoxan | SD | |
| VPS37B | insertion | In_Frame_Ins | novel | c.115_116insTGTATTGGACTAGTTTATGTATGG | p.Gln39delinsLeuTyrTrpThrSerLeuCysMetGlu | p.Q39delinsLYWTSLCME | Q9H9H4 | protein_coding | TCGA-BH-A0HF-01 | Breast | breast invasive carcinoma | Female | >=65 | I/II | Hormone Therapy | arimidex | SD | ||
| VPS37B | SNV | Missense_Mutation | novel | c.517N>A | p.Leu173Met | p.L173M | Q9H9H4 | protein_coding | tolerated(0.3) | benign(0.054) | TCGA-AA-3949-01 | Colorectum | colon adenocarcinoma | Female | >=65 | III/IV | Unknown | Unknown | SD |
| VPS37B | SNV | Missense_Mutation | novel | c.349N>G | p.Ile117Val | p.I117V | Q9H9H4 | protein_coding | deleterious(0) | probably_damaging(0.987) | TCGA-CA-6717-01 | Colorectum | colon adenocarcinoma | Male | <65 | I/II | Chemotherapy | oxaliplatin | CR |
| VPS37B | SNV | Missense_Mutation | c.814N>T | p.Pro272Ser | p.P272S | Q9H9H4 | protein_coding | tolerated(0.14) | benign(0.031) | TCGA-CK-5916-01 | Colorectum | colon adenocarcinoma | Female | >=65 | I/II | Unknown | Unknown | PD | |
| VPS37B | SNV | Missense_Mutation | rs370211610 | c.722N>T | p.Pro241Leu | p.P241L | Q9H9H4 | protein_coding | deleterious(0) | benign(0.059) | TCGA-D5-6531-01 | Colorectum | colon adenocarcinoma | Male | >=65 | I/II | Unknown | Unknown | SD |
| VPS37B | SNV | Missense_Mutation | c.480N>T | p.Gln160His | p.Q160H | Q9H9H4 | protein_coding | deleterious(0) | possibly_damaging(0.87) | TCGA-D5-6927-01 | Colorectum | colon adenocarcinoma | Male | <65 | I/II | Unknown | Unknown | SD | |
| VPS37B | SNV | Missense_Mutation | rs761502771 | c.215N>A | p.Arg72His | p.R72H | Q9H9H4 | protein_coding | tolerated(0.11) | benign(0.003) | TCGA-D5-6928-01 | Colorectum | colon adenocarcinoma | Male | >=65 | I/II | Unknown | Unknown | SD |
| VPS37B | insertion | Frame_Shift_Ins | rs747337112 | c.736_737insC | p.Arg246ProfsTer88 | p.R246Pfs*88 | Q9H9H4 | protein_coding | TCGA-AA-A022-01 | Colorectum | colon adenocarcinoma | Female | >=65 | I/II | Unknown | Unknown | SD | ||
| VPS37B | SNV | Missense_Mutation | novel | c.378G>T | p.Glu126Asp | p.E126D | Q9H9H4 | protein_coding | tolerated(0.39) | benign(0.279) | TCGA-AP-A1E0-01 | Endometrium | uterine corpus endometrioid carcinoma | Female | <65 | III/IV | Chemotherapy | paclitaxel | SD |
| Page: 1 2 |
Top |
Related drugs of malignant transformation related genes |
| Identification of chemicals and drugs interact with genes involved in malignant transfromation |
| (DGIdb 4.0) |
| Entrez ID | Symbol | Category | Interaction Types | Drug Claim Name | Drug Name | PMIDs |
| Page: 1 |

Copyright 2023-Present -The University of Texas Health Science Center at Houston |