
|
|||||
|
 | |
| |
| |
| |
| |
| |
|
Gene: VPS37A |
Gene summary for VPS37A |
| Gene information | Species | Human | Gene symbol | VPS37A | Gene ID | 137492 |
| Gene name | VPS37A subunit of ESCRT-I | |
| Gene Alias | HCRP1 | |
| Cytomap | 8p22 | |
| Gene Type | protein-coding | GO ID | GO:0006508 | UniProtAcc | Q8NEZ2 |
Top |
Malignant transformation analysis |
| Identification of the aberrant gene expression in precancerous and cancerous lesions by comparing the gene expression of stem-like cells in diseased tissues with normal stem cells |
| Entrez ID | Symbol | Replicates | Species | Organ | Tissue | Adj P-value | Log2FC | Malignancy |
| 137492 | VPS37A | LZE4T | Human | Esophagus | ESCC | 8.95e-18 | 6.52e-01 | 0.0811 |
| 137492 | VPS37A | LZE7T | Human | Esophagus | ESCC | 5.62e-03 | 2.36e-01 | 0.0667 |
| 137492 | VPS37A | LZE8T | Human | Esophagus | ESCC | 6.18e-08 | 2.18e-01 | 0.067 |
| 137492 | VPS37A | LZE22T | Human | Esophagus | ESCC | 2.50e-02 | 1.24e-01 | 0.068 |
| 137492 | VPS37A | LZE24T | Human | Esophagus | ESCC | 1.23e-15 | 4.47e-01 | 0.0596 |
| 137492 | VPS37A | LZE21T | Human | Esophagus | ESCC | 1.18e-04 | 4.11e-01 | 0.0655 |
| 137492 | VPS37A | LZE6T | Human | Esophagus | ESCC | 3.64e-04 | 8.97e-02 | 0.0845 |
| 137492 | VPS37A | P1T-E | Human | Esophagus | ESCC | 3.93e-04 | 4.57e-01 | 0.0875 |
| 137492 | VPS37A | P2T-E | Human | Esophagus | ESCC | 9.86e-27 | 5.76e-01 | 0.1177 |
| 137492 | VPS37A | P4T-E | Human | Esophagus | ESCC | 1.43e-22 | 7.26e-01 | 0.1323 |
| 137492 | VPS37A | P5T-E | Human | Esophagus | ESCC | 2.23e-10 | 1.57e-01 | 0.1327 |
| 137492 | VPS37A | P8T-E | Human | Esophagus | ESCC | 6.64e-20 | 3.59e-01 | 0.0889 |
| 137492 | VPS37A | P9T-E | Human | Esophagus | ESCC | 1.52e-15 | 3.32e-01 | 0.1131 |
| 137492 | VPS37A | P10T-E | Human | Esophagus | ESCC | 2.82e-27 | 4.25e-01 | 0.116 |
| 137492 | VPS37A | P11T-E | Human | Esophagus | ESCC | 9.57e-06 | 1.39e-01 | 0.1426 |
| 137492 | VPS37A | P12T-E | Human | Esophagus | ESCC | 4.89e-08 | 1.06e-01 | 0.1122 |
| 137492 | VPS37A | P15T-E | Human | Esophagus | ESCC | 2.55e-10 | 1.32e-01 | 0.1149 |
| 137492 | VPS37A | P16T-E | Human | Esophagus | ESCC | 5.24e-19 | 2.99e-01 | 0.1153 |
| 137492 | VPS37A | P17T-E | Human | Esophagus | ESCC | 1.32e-05 | 3.30e-01 | 0.1278 |
| 137492 | VPS37A | P19T-E | Human | Esophagus | ESCC | 5.69e-10 | 5.25e-01 | 0.1662 |
| Page: 1 2 3 4 |
| Tissue | Expression Dynamics | Abbreviation |
| Esophagus | 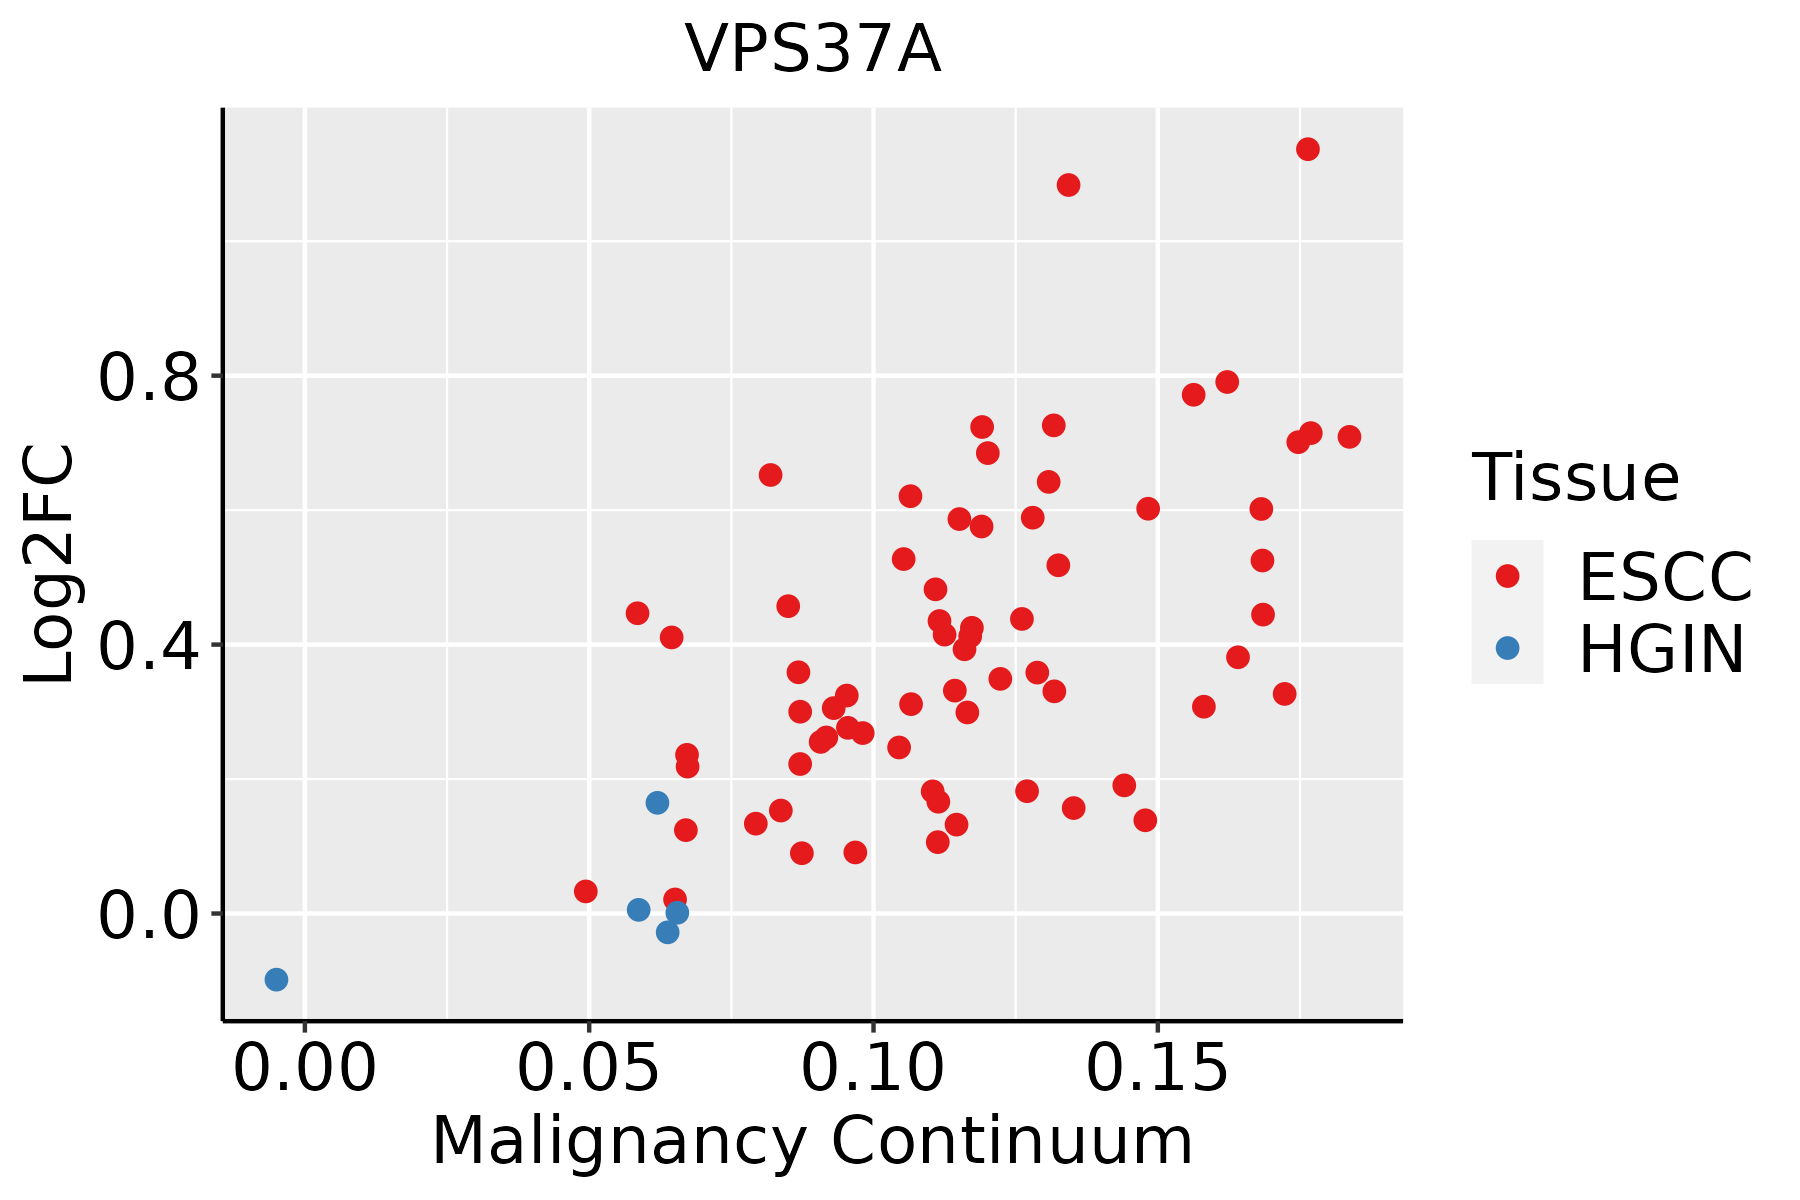 | ESCC: Esophageal squamous cell carcinoma |
| HGIN: High-grade intraepithelial neoplasias | ||
| LGIN: Low-grade intraepithelial neoplasias | ||
| Oral Cavity | 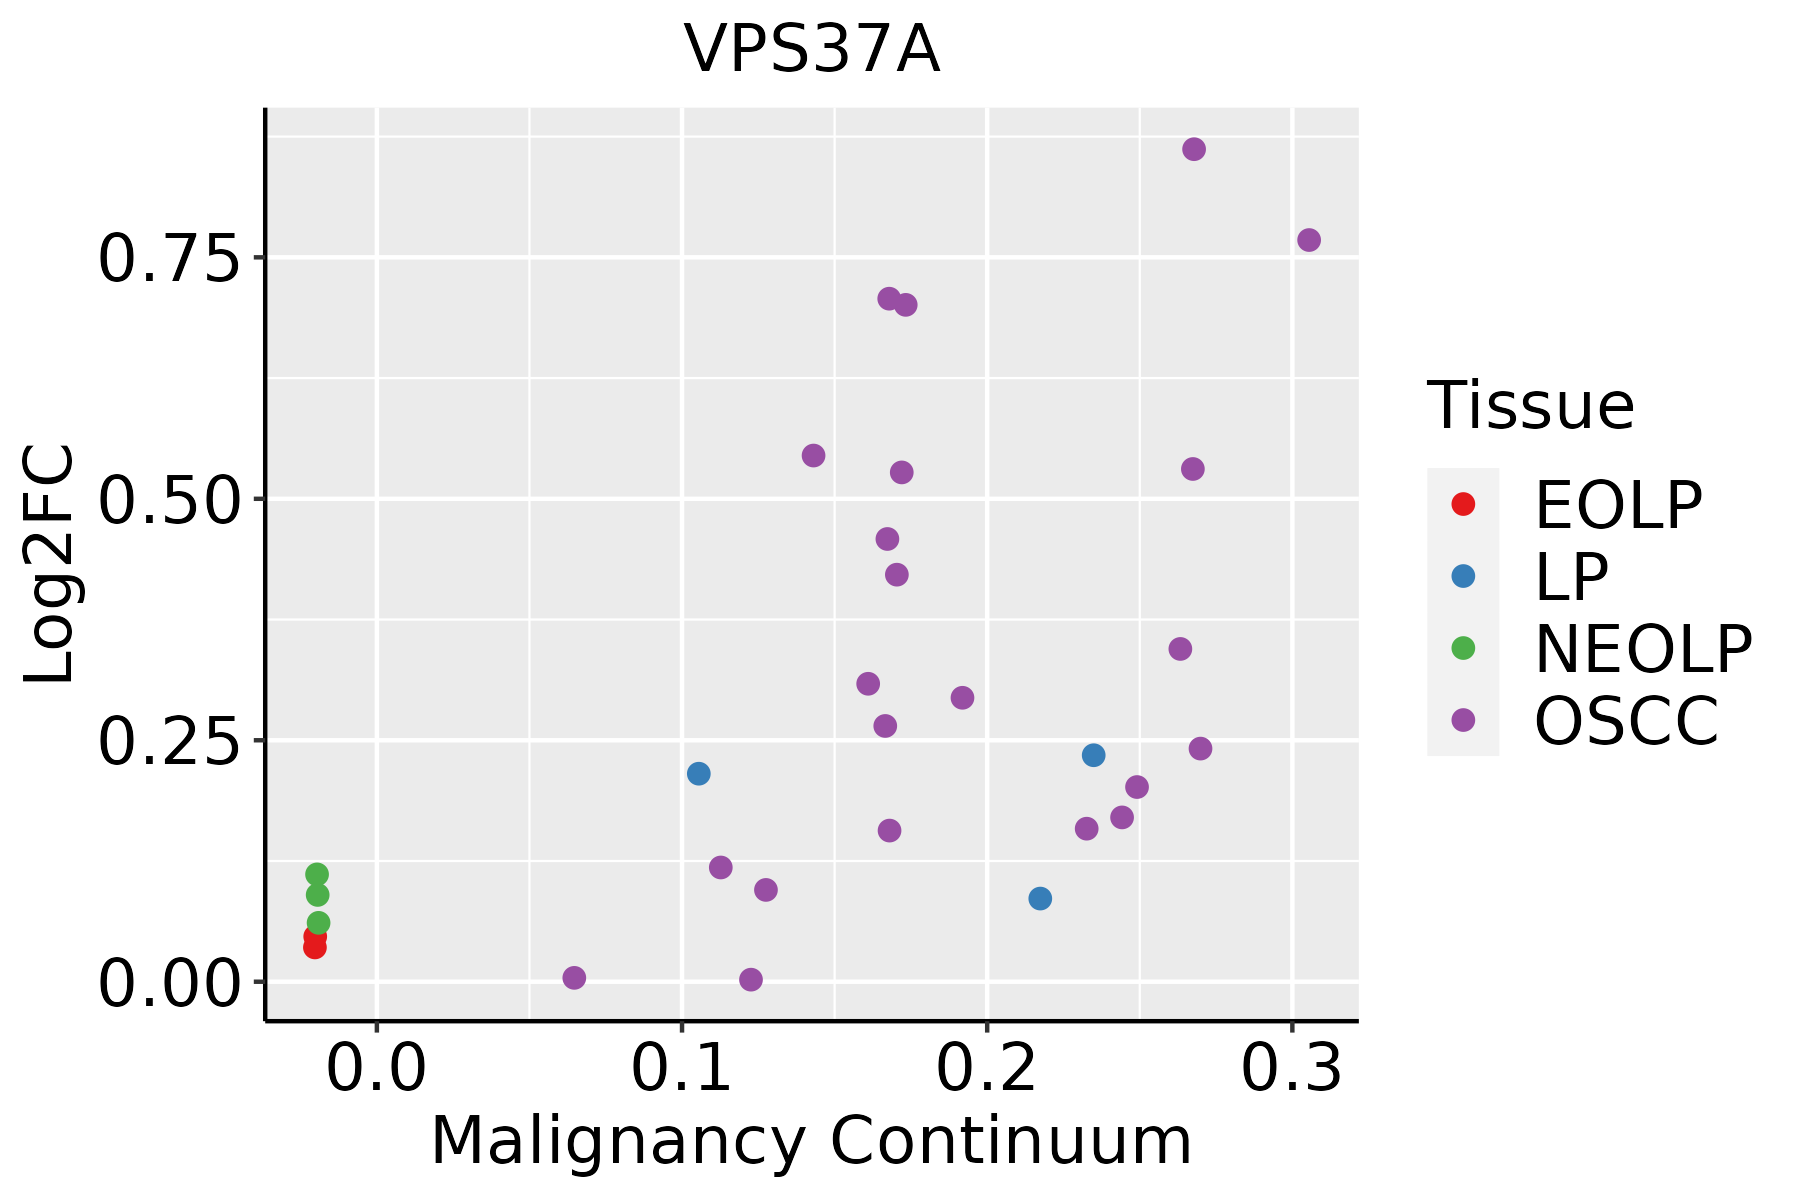 | EOLP: Erosive Oral lichen planus |
| LP: leukoplakia | ||
| NEOLP: Non-erosive oral lichen planus | ||
| OSCC: Oral squamous cell carcinoma | ||
| Skin |  | AK: Actinic keratosis |
| cSCC: Cutaneous squamous cell carcinoma | ||
| SCCIS:squamous cell carcinoma in situ |
| ∗log2FC in expression of this searched gene in stem-like cells from each diseased tissue sample relative to stem-like cells in normal samples in each tissue plotted against the malignancy continuum. Samples are colored based on if they are from different disease stage. |
Top |
Malignant transformation related pathway analysis |
| Find out the enriched GO biological processes and KEGG pathways involved in transition from healthy to precancer to cancer |
| Tissue | Disease Stage | Enriched GO biological Processes |
| Colorectum | AD |  |
| Colorectum | SER |  |
| Colorectum | MSS |  |
| Colorectum | MSI-H |  |
| Colorectum | FAP |  |
| ∗Top 15 enriched GO BP terms are showed in the bar plot of each disease state in each tissue. Each row represents a significant GO biological process which is colored according to the -log10(p.adjust). |
| Page: 1 2 3 4 5 6 7 8 9 |
| GO ID | Tissue | Disease Stage | Description | Gene Ratio | Bg Ratio | pvalue | p.adjust | Count |
| GO:0072594110 | Esophagus | ESCC | establishment of protein localization to organelle | 311/8552 | 422/18723 | 3.02e-32 | 2.13e-29 | 311 |
| GO:0016032111 | Esophagus | ESCC | viral process | 301/8552 | 415/18723 | 3.34e-29 | 1.32e-26 | 301 |
| GO:001623617 | Esophagus | ESCC | macroautophagy | 216/8552 | 291/18723 | 1.94e-23 | 4.57e-21 | 216 |
| GO:0006605111 | Esophagus | ESCC | protein targeting | 229/8552 | 314/18723 | 4.93e-23 | 1.01e-20 | 229 |
| GO:0019058111 | Esophagus | ESCC | viral life cycle | 226/8552 | 317/18723 | 1.17e-20 | 1.76e-18 | 226 |
| GO:001605014 | Esophagus | ESCC | vesicle organization | 211/8552 | 300/18723 | 2.85e-18 | 2.87e-16 | 211 |
| GO:0090150110 | Esophagus | ESCC | establishment of protein localization to membrane | 182/8552 | 260/18723 | 1.27e-15 | 8.19e-14 | 182 |
| GO:000703417 | Esophagus | ESCC | vacuolar transport | 119/8552 | 157/18723 | 1.16e-14 | 6.30e-13 | 119 |
| GO:003625714 | Esophagus | ESCC | multivesicular body organization | 30/8552 | 31/18723 | 1.04e-09 | 2.50e-08 | 30 |
| GO:003625814 | Esophagus | ESCC | multivesicular body assembly | 29/8552 | 30/18723 | 2.21e-09 | 4.99e-08 | 29 |
| GO:00726659 | Esophagus | ESCC | protein localization to vacuole | 52/8552 | 67/18723 | 9.14e-08 | 1.52e-06 | 52 |
| GO:000703214 | Esophagus | ESCC | endosome organization | 61/8552 | 82/18723 | 1.13e-07 | 1.85e-06 | 61 |
| GO:001906815 | Esophagus | ESCC | virion assembly | 31/8552 | 35/18723 | 1.40e-07 | 2.25e-06 | 31 |
| GO:003970214 | Esophagus | ESCC | viral budding via host ESCRT complex | 20/8552 | 21/18723 | 1.83e-06 | 2.15e-05 | 20 |
| GO:00066238 | Esophagus | ESCC | protein targeting to vacuole | 31/8552 | 37/18723 | 1.95e-06 | 2.26e-05 | 31 |
| GO:004675514 | Esophagus | ESCC | viral budding | 23/8552 | 26/18723 | 6.82e-06 | 6.90e-05 | 23 |
| GO:00726668 | Esophagus | ESCC | establishment of protein localization to vacuole | 37/8552 | 49/18723 | 2.05e-05 | 1.78e-04 | 37 |
| GO:00066124 | Esophagus | ESCC | protein targeting to membrane | 83/8552 | 131/18723 | 3.31e-05 | 2.73e-04 | 83 |
| GO:00431623 | Esophagus | ESCC | ubiquitin-dependent protein catabolic process via the multivesicular body sorting pathway | 19/8552 | 23/18723 | 3.12e-04 | 1.85e-03 | 19 |
| GO:007259418 | Oral cavity | OSCC | establishment of protein localization to organelle | 284/7305 | 422/18723 | 1.50e-32 | 1.35e-29 | 284 |
| Page: 1 2 3 |
| Pathway ID | Tissue | Disease Stage | Description | Gene Ratio | Bg Ratio | pvalue | p.adjust | qvalue | Count |
| hsa04144210 | Esophagus | ESCC | Endocytosis | 186/4205 | 251/8465 | 9.74e-16 | 4.66e-14 | 2.39e-14 | 186 |
| hsa0414437 | Esophagus | ESCC | Endocytosis | 186/4205 | 251/8465 | 9.74e-16 | 4.66e-14 | 2.39e-14 | 186 |
| hsa0414427 | Oral cavity | OSCC | Endocytosis | 174/3704 | 251/8465 | 9.42e-17 | 4.51e-15 | 2.29e-15 | 174 |
| hsa04144112 | Oral cavity | OSCC | Endocytosis | 174/3704 | 251/8465 | 9.42e-17 | 4.51e-15 | 2.29e-15 | 174 |
| Page: 1 |
Top |
Cell-cell communication analysis |
| Identification of potential cell-cell interactions between two cell types and their ligand-receptor pairs for different disease states |
| Ligand | Receptor | LRpair | Pathway | Tissue | Disease Stage |
| Page: 1 |
Top |
Single-cell gene regulatory network inference analysis |
| Find out the significant the regulons (TFs) and the target genes of each regulon across cell types for different disease states |
| TF | Cell Type | Tissue | Disease Stage | Target Gene | RSS | Regulon Activity |
| ∗The dot plots of a searched regulon are shown for all cell subpopulations in each disease state of each tissue based on the regulon specific score inferred using pySCENIC and by calculating the average expression. |
| Page: 1 |
Top |
Somatic mutation of malignant transformation related genes |
| Annotation of somatic variants for genes involved in malignant transformation |
| Hugo Symbol | Variant Class | Variant Classification | dbSNP RS | HGVSc | HGVSp | HGVSp Short | SWISSPROT | BIOTYPE | SIFT | PolyPhen | Tumor Sample Barcode | Tissue | Histology | Sex | Age | Stage | Therapy Types | Drugs | Outcome |
| VPS37A | SNV | Missense_Mutation | c.1101N>A | p.Met367Ile | p.M367I | Q8NEZ2 | protein_coding | tolerated(0.4) | benign(0.379) | TCGA-BH-A0HF-01 | Breast | breast invasive carcinoma | Female | >=65 | I/II | Hormone Therapy | arimidex | SD | |
| VPS37A | SNV | Missense_Mutation | c.375N>C | p.Lys125Asn | p.K125N | Q8NEZ2 | protein_coding | deleterious(0.01) | probably_damaging(0.995) | TCGA-C5-A1BQ-01 | Cervix | cervical & endocervical cancer | Female | >=65 | III/IV | Chemotherapy | cisplatin | CR | |
| VPS37A | SNV | Missense_Mutation | c.1184N>T | p.Ala395Val | p.A395V | Q8NEZ2 | protein_coding | deleterious_low_confidence(0.01) | probably_damaging(0.994) | TCGA-AA-3663-01 | Colorectum | colon adenocarcinoma | Male | <65 | I/II | Unknown | Unknown | SD | |
| VPS37A | SNV | Missense_Mutation | rs755402438 | c.1157N>T | p.Ala386Val | p.A386V | Q8NEZ2 | protein_coding | tolerated(0.61) | benign(0) | TCGA-AZ-6598-01 | Colorectum | colon adenocarcinoma | Female | >=65 | I/II | Unknown | Unknown | SD |
| VPS37A | SNV | Missense_Mutation | c.19N>G | p.Leu7Val | p.L7V | Q8NEZ2 | protein_coding | tolerated(0.25) | benign(0.084) | TCGA-G4-6294-01 | Colorectum | colon adenocarcinoma | Male | >=65 | III/IV | Chemotherapy | fluorouracil | PD | |
| VPS37A | SNV | Missense_Mutation | novel | c.683C>T | p.Pro228Leu | p.P228L | Q8NEZ2 | protein_coding | deleterious(0) | possibly_damaging(0.793) | TCGA-A5-A0G2-01 | Endometrium | uterine corpus endometrioid carcinoma | Female | <65 | III/IV | Unknown | Unknown | SD |
| VPS37A | SNV | Missense_Mutation | c.195T>G | p.Ile65Met | p.I65M | Q8NEZ2 | protein_coding | deleterious(0.04) | possibly_damaging(0.758) | TCGA-A5-A0GP-01 | Endometrium | uterine corpus endometrioid carcinoma | Female | <65 | I/II | Unknown | Unknown | SD | |
| VPS37A | SNV | Missense_Mutation | novel | c.407N>T | p.Ala136Val | p.A136V | Q8NEZ2 | protein_coding | deleterious(0.03) | benign(0.024) | TCGA-AJ-A8CV-01 | Endometrium | uterine corpus endometrioid carcinoma | Female | <65 | I/II | Unknown | Unknown | SD |
| VPS37A | SNV | Missense_Mutation | c.455N>A | p.Ser152Tyr | p.S152Y | Q8NEZ2 | protein_coding | tolerated(0.78) | benign(0.086) | TCGA-AP-A051-01 | Endometrium | uterine corpus endometrioid carcinoma | Female | >=65 | I/II | Unknown | Unknown | SD | |
| VPS37A | SNV | Missense_Mutation | novel | c.850C>A | p.Leu284Ile | p.L284I | Q8NEZ2 | protein_coding | tolerated(0.14) | possibly_damaging(0.625) | TCGA-AP-A1DV-01 | Endometrium | uterine corpus endometrioid carcinoma | Female | <65 | I/II | Unknown | Unknown | SD |
| Page: 1 2 3 |
Top |
Related drugs of malignant transformation related genes |
| Identification of chemicals and drugs interact with genes involved in malignant transfromation |
| (DGIdb 4.0) |
| Entrez ID | Symbol | Category | Interaction Types | Drug Claim Name | Drug Name | PMIDs |
| 137492 | VPS37A | DRUG RESISTANCE | CETUXIMAB | CETUXIMAB | 22016507 |
| Page: 1 |

Copyright 2023-Present -The University of Texas Health Science Center at Houston |