
|
|||||
|
 | |
| |
| |
| |
| |
| |
|
Gene: VPS36 |
Gene summary for VPS36 |
| Gene information | Species | Human | Gene symbol | VPS36 | Gene ID | 51028 |
| Gene name | vacuolar protein sorting 36 homolog | |
| Gene Alias | C13orf9 | |
| Cytomap | 13q14.3 | |
| Gene Type | protein-coding | GO ID | GO:0006508 | UniProtAcc | Q86VN1 |
Top |
Malignant transformation analysis |
| Identification of the aberrant gene expression in precancerous and cancerous lesions by comparing the gene expression of stem-like cells in diseased tissues with normal stem cells |
| Entrez ID | Symbol | Replicates | Species | Organ | Tissue | Adj P-value | Log2FC | Malignancy |
| 51028 | VPS36 | LZE4T | Human | Esophagus | ESCC | 5.15e-15 | 5.67e-01 | 0.0811 |
| 51028 | VPS36 | LZE5T | Human | Esophagus | ESCC | 9.43e-04 | 4.12e-01 | 0.0514 |
| 51028 | VPS36 | LZE7T | Human | Esophagus | ESCC | 6.51e-03 | 1.85e-01 | 0.0667 |
| 51028 | VPS36 | LZE8T | Human | Esophagus | ESCC | 2.66e-13 | 3.66e-01 | 0.067 |
| 51028 | VPS36 | LZE20T | Human | Esophagus | ESCC | 3.38e-03 | 2.41e-01 | 0.0662 |
| 51028 | VPS36 | LZE24T | Human | Esophagus | ESCC | 6.83e-21 | 5.69e-01 | 0.0596 |
| 51028 | VPS36 | LZE21T | Human | Esophagus | ESCC | 1.91e-02 | 2.16e-01 | 0.0655 |
| 51028 | VPS36 | P1T-E | Human | Esophagus | ESCC | 7.06e-17 | 9.56e-01 | 0.0875 |
| 51028 | VPS36 | P2T-E | Human | Esophagus | ESCC | 2.98e-51 | 8.58e-01 | 0.1177 |
| 51028 | VPS36 | P4T-E | Human | Esophagus | ESCC | 1.74e-48 | 1.28e+00 | 0.1323 |
| 51028 | VPS36 | P5T-E | Human | Esophagus | ESCC | 8.85e-21 | 4.42e-01 | 0.1327 |
| 51028 | VPS36 | P8T-E | Human | Esophagus | ESCC | 1.99e-43 | 7.75e-01 | 0.0889 |
| 51028 | VPS36 | P9T-E | Human | Esophagus | ESCC | 3.95e-25 | 6.55e-01 | 0.1131 |
| 51028 | VPS36 | P10T-E | Human | Esophagus | ESCC | 3.98e-37 | 7.18e-01 | 0.116 |
| 51028 | VPS36 | P11T-E | Human | Esophagus | ESCC | 7.99e-09 | 4.36e-01 | 0.1426 |
| 51028 | VPS36 | P12T-E | Human | Esophagus | ESCC | 2.22e-26 | 5.75e-01 | 0.1122 |
| 51028 | VPS36 | P15T-E | Human | Esophagus | ESCC | 5.84e-32 | 7.27e-01 | 0.1149 |
| 51028 | VPS36 | P16T-E | Human | Esophagus | ESCC | 1.25e-35 | 9.00e-01 | 0.1153 |
| 51028 | VPS36 | P17T-E | Human | Esophagus | ESCC | 3.27e-05 | 3.33e-01 | 0.1278 |
| 51028 | VPS36 | P19T-E | Human | Esophagus | ESCC | 7.61e-03 | 4.49e-01 | 0.1662 |
| Page: 1 2 3 4 5 6 |
| Tissue | Expression Dynamics | Abbreviation |
| Esophagus | 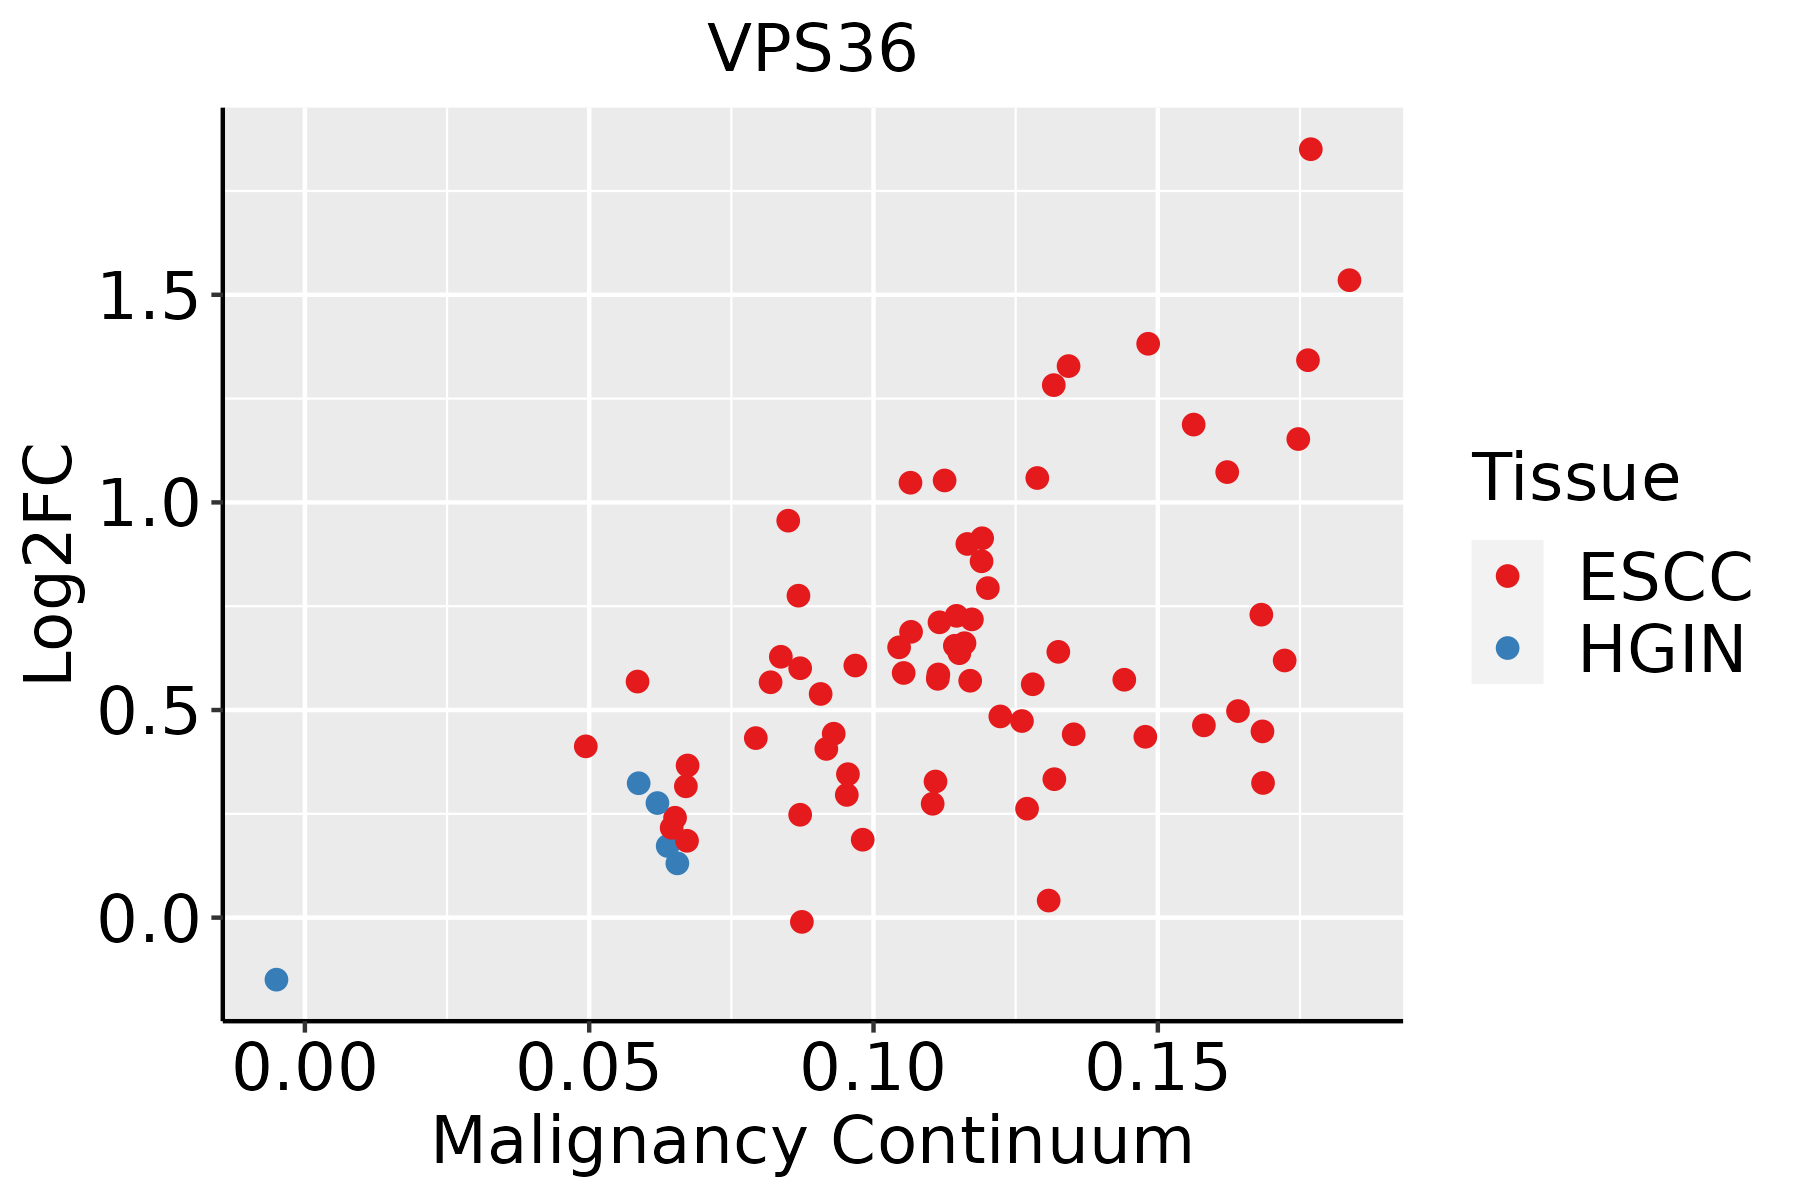 | ESCC: Esophageal squamous cell carcinoma |
| HGIN: High-grade intraepithelial neoplasias | ||
| LGIN: Low-grade intraepithelial neoplasias | ||
| Liver |  | HCC: Hepatocellular carcinoma |
| NAFLD: Non-alcoholic fatty liver disease | ||
| Oral Cavity | 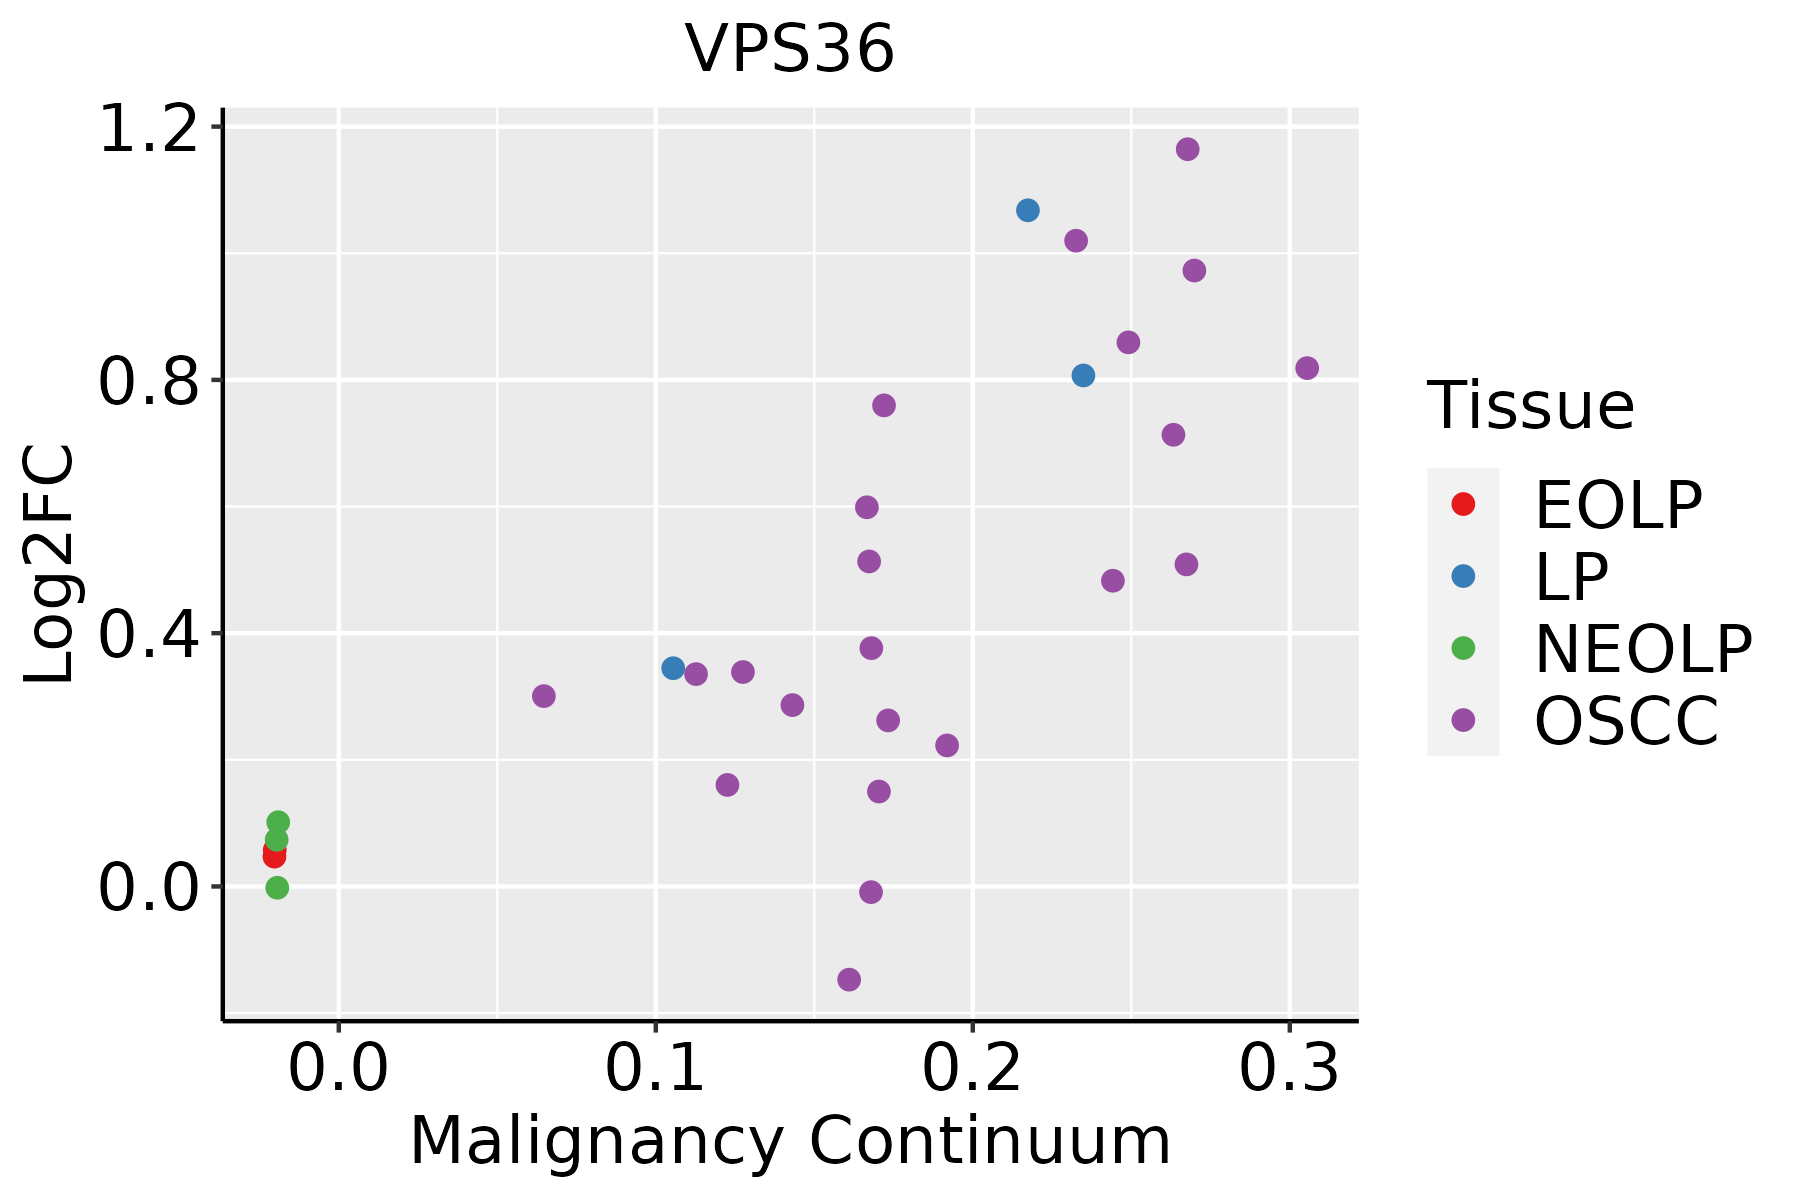 | EOLP: Erosive Oral lichen planus |
| LP: leukoplakia | ||
| NEOLP: Non-erosive oral lichen planus | ||
| OSCC: Oral squamous cell carcinoma | ||
| Skin | 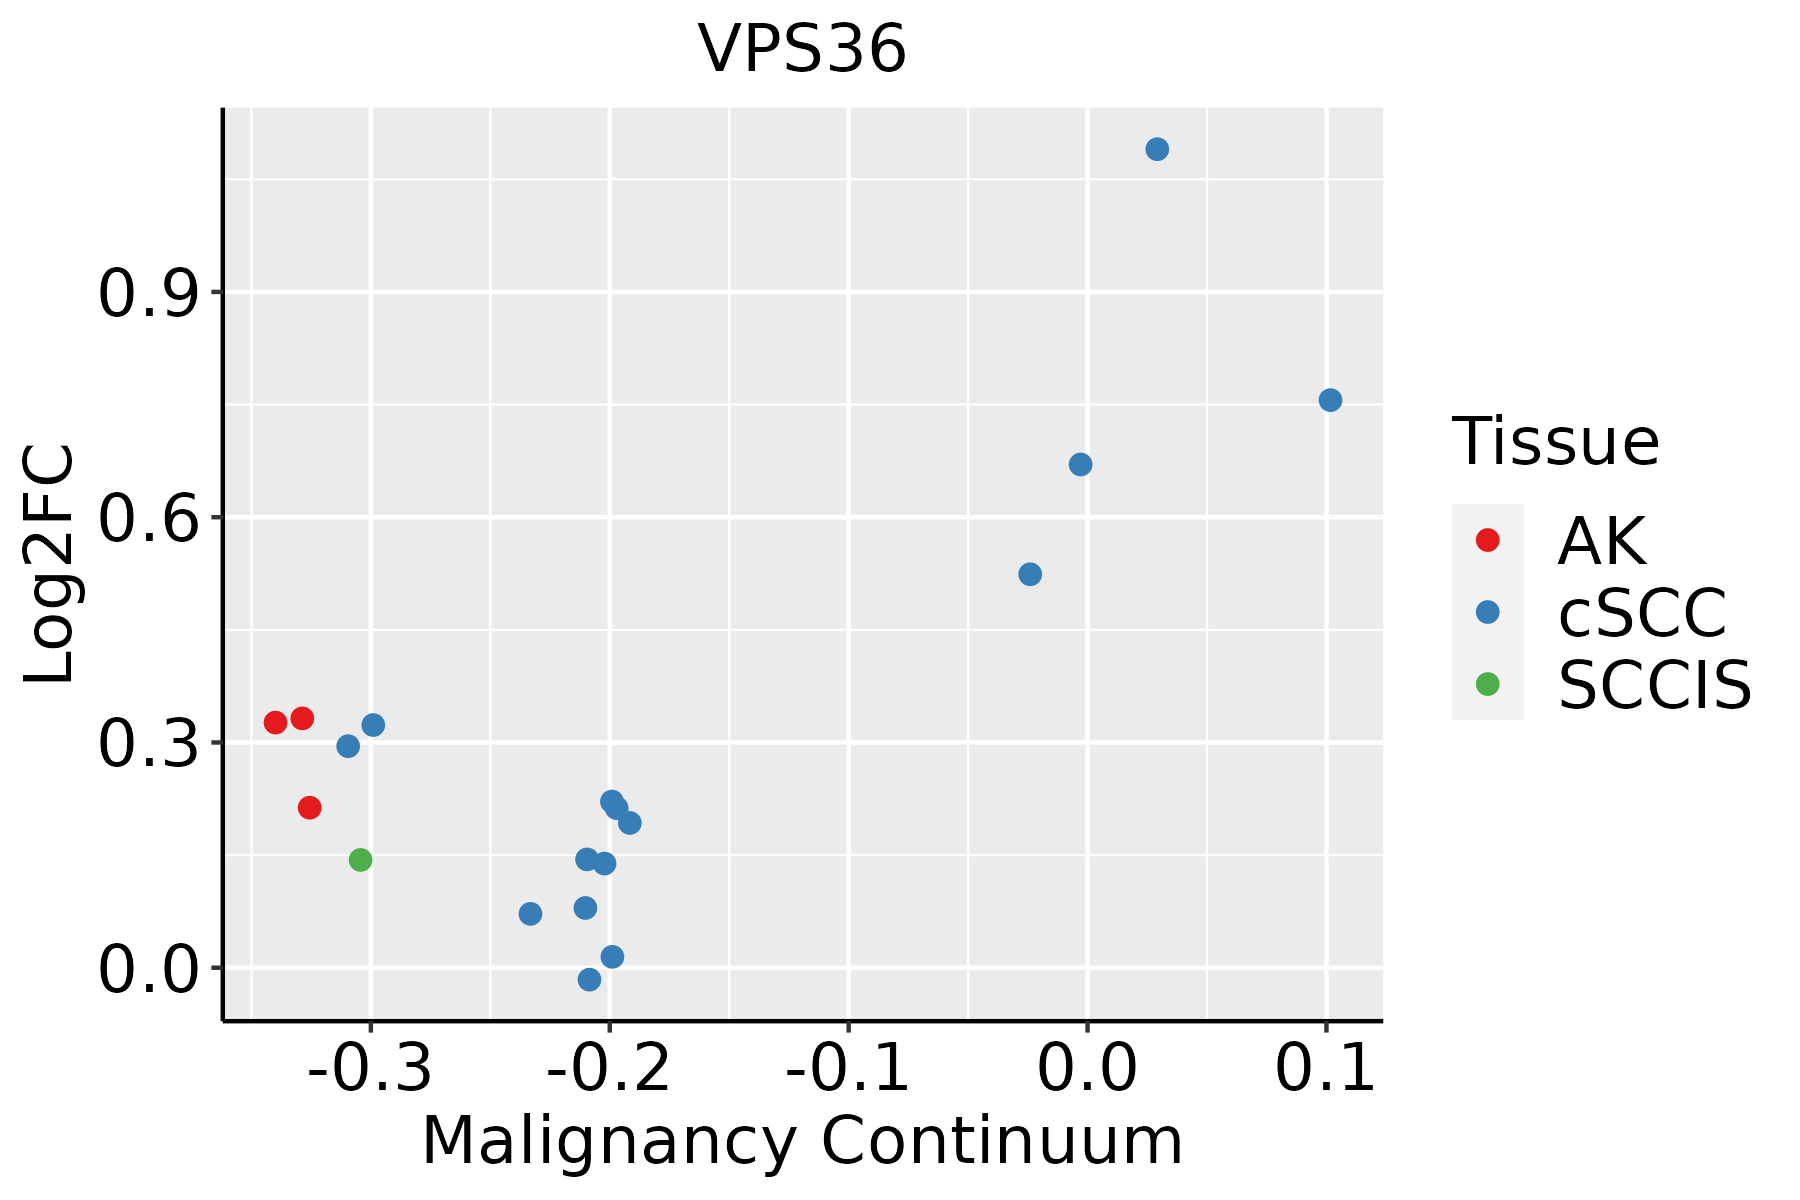 | AK: Actinic keratosis |
| cSCC: Cutaneous squamous cell carcinoma | ||
| SCCIS:squamous cell carcinoma in situ | ||
| Thyroid | 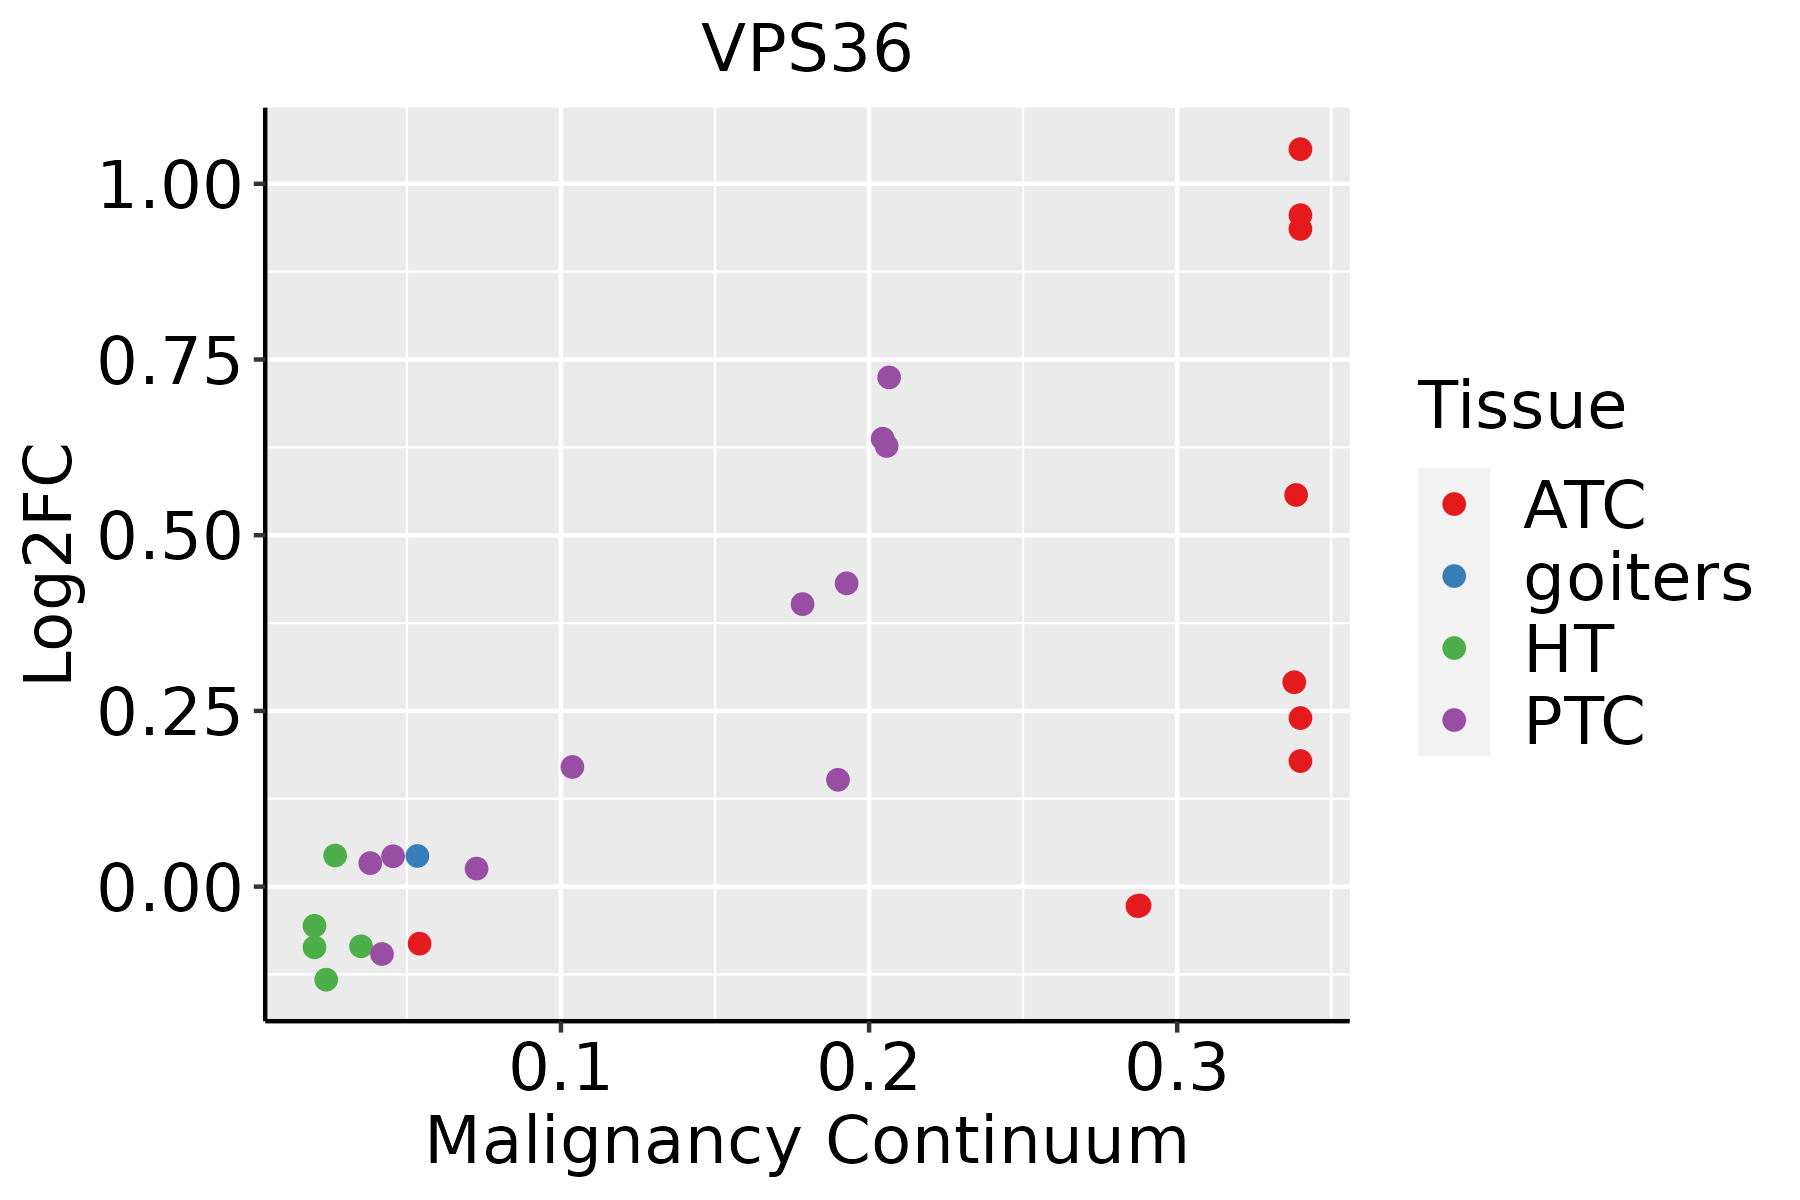 | ATC: Anaplastic thyroid cancer |
| HT: Hashimoto's thyroiditis | ||
| PTC: Papillary thyroid cancer |
| ∗log2FC in expression of this searched gene in stem-like cells from each diseased tissue sample relative to stem-like cells in normal samples in each tissue plotted against the malignancy continuum. Samples are colored based on if they are from different disease stage. |
Top |
Malignant transformation related pathway analysis |
| Find out the enriched GO biological processes and KEGG pathways involved in transition from healthy to precancer to cancer |
| Tissue | Disease Stage | Enriched GO biological Processes |
| Colorectum | AD |  |
| Colorectum | SER |  |
| Colorectum | MSS |  |
| Colorectum | MSI-H |  |
| Colorectum | FAP |  |
| ∗Top 15 enriched GO BP terms are showed in the bar plot of each disease state in each tissue. Each row represents a significant GO biological process which is colored according to the -log10(p.adjust). |
| Page: 1 2 3 4 5 6 7 8 9 |
| GO ID | Tissue | Disease Stage | Description | Gene Ratio | Bg Ratio | pvalue | p.adjust | Count |
| GO:0072594110 | Esophagus | ESCC | establishment of protein localization to organelle | 311/8552 | 422/18723 | 3.02e-32 | 2.13e-29 | 311 |
| GO:001623617 | Esophagus | ESCC | macroautophagy | 216/8552 | 291/18723 | 1.94e-23 | 4.57e-21 | 216 |
| GO:001605014 | Esophagus | ESCC | vesicle organization | 211/8552 | 300/18723 | 2.85e-18 | 2.87e-16 | 211 |
| GO:001619715 | Esophagus | ESCC | endosomal transport | 168/8552 | 230/18723 | 2.28e-17 | 1.93e-15 | 168 |
| GO:000703417 | Esophagus | ESCC | vacuolar transport | 119/8552 | 157/18723 | 1.16e-14 | 6.30e-13 | 119 |
| GO:003625714 | Esophagus | ESCC | multivesicular body organization | 30/8552 | 31/18723 | 1.04e-09 | 2.50e-08 | 30 |
| GO:003625814 | Esophagus | ESCC | multivesicular body assembly | 29/8552 | 30/18723 | 2.21e-09 | 4.99e-08 | 29 |
| GO:007198514 | Esophagus | ESCC | multivesicular body sorting pathway | 34/8552 | 37/18723 | 3.49e-09 | 7.39e-08 | 34 |
| GO:003250915 | Esophagus | ESCC | endosome transport via multivesicular body sorting pathway | 29/8552 | 31/18723 | 1.92e-08 | 3.72e-07 | 29 |
| GO:00726659 | Esophagus | ESCC | protein localization to vacuole | 52/8552 | 67/18723 | 9.14e-08 | 1.52e-06 | 52 |
| GO:000703214 | Esophagus | ESCC | endosome organization | 61/8552 | 82/18723 | 1.13e-07 | 1.85e-06 | 61 |
| GO:00453245 | Esophagus | ESCC | late endosome to vacuole transport | 23/8552 | 25/18723 | 1.39e-06 | 1.69e-05 | 23 |
| GO:00726668 | Esophagus | ESCC | establishment of protein localization to vacuole | 37/8552 | 49/18723 | 2.05e-05 | 1.78e-04 | 37 |
| GO:00325113 | Esophagus | ESCC | late endosome to vacuole transport via multivesicular body sorting pathway | 16/8552 | 17/18723 | 3.46e-05 | 2.82e-04 | 16 |
| GO:00431623 | Esophagus | ESCC | ubiquitin-dependent protein catabolic process via the multivesicular body sorting pathway | 19/8552 | 23/18723 | 3.12e-04 | 1.85e-03 | 19 |
| GO:00161975 | Liver | NAFLD | endosomal transport | 41/1882 | 230/18723 | 2.02e-04 | 3.53e-03 | 41 |
| GO:00160505 | Liver | NAFLD | vesicle organization | 50/1882 | 300/18723 | 2.42e-04 | 4.06e-03 | 50 |
| GO:00726653 | Liver | NAFLD | protein localization to vacuole | 16/1882 | 67/18723 | 7.94e-04 | 9.90e-03 | 16 |
| GO:00726663 | Liver | NAFLD | establishment of protein localization to vacuole | 13/1882 | 49/18723 | 8.43e-04 | 1.03e-02 | 13 |
| GO:00725947 | Liver | NAFLD | establishment of protein localization to organelle | 62/1882 | 422/18723 | 1.48e-03 | 1.64e-02 | 62 |
| Page: 1 2 3 4 5 6 7 |
| Pathway ID | Tissue | Disease Stage | Description | Gene Ratio | Bg Ratio | pvalue | p.adjust | qvalue | Count |
| hsa04144210 | Esophagus | ESCC | Endocytosis | 186/4205 | 251/8465 | 9.74e-16 | 4.66e-14 | 2.39e-14 | 186 |
| hsa0414437 | Esophagus | ESCC | Endocytosis | 186/4205 | 251/8465 | 9.74e-16 | 4.66e-14 | 2.39e-14 | 186 |
| hsa0414412 | Liver | Cirrhotic | Endocytosis | 119/2530 | 251/8465 | 2.33e-09 | 4.56e-08 | 2.81e-08 | 119 |
| hsa0414413 | Liver | Cirrhotic | Endocytosis | 119/2530 | 251/8465 | 2.33e-09 | 4.56e-08 | 2.81e-08 | 119 |
| hsa0414422 | Liver | HCC | Endocytosis | 178/4020 | 251/8465 | 2.03e-14 | 5.22e-13 | 2.91e-13 | 178 |
| hsa0414432 | Liver | HCC | Endocytosis | 178/4020 | 251/8465 | 2.03e-14 | 5.22e-13 | 2.91e-13 | 178 |
| hsa0414427 | Oral cavity | OSCC | Endocytosis | 174/3704 | 251/8465 | 9.42e-17 | 4.51e-15 | 2.29e-15 | 174 |
| hsa04144112 | Oral cavity | OSCC | Endocytosis | 174/3704 | 251/8465 | 9.42e-17 | 4.51e-15 | 2.29e-15 | 174 |
| hsa0414428 | Oral cavity | LP | Endocytosis | 121/2418 | 251/8465 | 1.89e-11 | 3.70e-10 | 2.38e-10 | 121 |
| hsa0414436 | Oral cavity | LP | Endocytosis | 121/2418 | 251/8465 | 1.89e-11 | 3.70e-10 | 2.38e-10 | 121 |
| hsa0414442 | Oral cavity | EOLP | Endocytosis | 71/1218 | 251/8465 | 5.28e-09 | 8.97e-08 | 5.29e-08 | 71 |
| hsa0414452 | Oral cavity | EOLP | Endocytosis | 71/1218 | 251/8465 | 5.28e-09 | 8.97e-08 | 5.29e-08 | 71 |
| Page: 1 |
Top |
Cell-cell communication analysis |
| Identification of potential cell-cell interactions between two cell types and their ligand-receptor pairs for different disease states |
| Ligand | Receptor | LRpair | Pathway | Tissue | Disease Stage |
| Page: 1 |
Top |
Single-cell gene regulatory network inference analysis |
| Find out the significant the regulons (TFs) and the target genes of each regulon across cell types for different disease states |
| TF | Cell Type | Tissue | Disease Stage | Target Gene | RSS | Regulon Activity |
| ∗The dot plots of a searched regulon are shown for all cell subpopulations in each disease state of each tissue based on the regulon specific score inferred using pySCENIC and by calculating the average expression. |
| Page: 1 |
Top |
Somatic mutation of malignant transformation related genes |
| Annotation of somatic variants for genes involved in malignant transformation |
| Hugo Symbol | Variant Class | Variant Classification | dbSNP RS | HGVSc | HGVSp | HGVSp Short | SWISSPROT | BIOTYPE | SIFT | PolyPhen | Tumor Sample Barcode | Tissue | Histology | Sex | Age | Stage | Therapy Types | Drugs | Outcome |
| VPS36 | SNV | Missense_Mutation | novel | c.818N>A | p.Val273Glu | p.V273E | Q86VN1 | protein_coding | deleterious(0) | probably_damaging(0.993) | TCGA-AR-A0TU-01 | Breast | breast invasive carcinoma | Female | <65 | I/II | Unspecific | Doxorubicin | SD |
| VPS36 | SNV | Missense_Mutation | c.386N>C | p.Arg129Thr | p.R129T | Q86VN1 | protein_coding | deleterious(0.01) | benign(0.046) | TCGA-E2-A1LG-01 | Breast | breast invasive carcinoma | Female | <65 | I/II | Chemotherapy | doxorubicin | SD | |
| VPS36 | insertion | Frame_Shift_Ins | novel | c.816_817insAGAGGAAGAAG | p.Val273ArgfsTer5 | p.V273Rfs*5 | Q86VN1 | protein_coding | TCGA-AR-A0TU-01 | Breast | breast invasive carcinoma | Female | <65 | I/II | Unspecific | Doxorubicin | SD | ||
| VPS36 | SNV | Missense_Mutation | novel | c.622N>C | p.Asp208His | p.D208H | Q86VN1 | protein_coding | deleterious(0.01) | possibly_damaging(0.506) | TCGA-VS-A94Z-01 | Cervix | cervical & endocervical cancer | Female | <65 | I/II | Chemotherapy | cisplatin | CR |
| VPS36 | SNV | Missense_Mutation | c.611A>C | p.Asp204Ala | p.D204A | Q86VN1 | protein_coding | tolerated(0.09) | benign(0.249) | TCGA-AA-3864-01 | Colorectum | colon adenocarcinoma | Male | >=65 | I/II | Unknown | Unknown | SD | |
| VPS36 | SNV | Missense_Mutation | c.301N>T | p.Ser101Cys | p.S101C | Q86VN1 | protein_coding | deleterious(0) | probably_damaging(0.995) | TCGA-AD-A5EJ-01 | Colorectum | colon adenocarcinoma | Female | >=65 | I/II | Unknown | Unknown | SD | |
| VPS36 | SNV | Missense_Mutation | c.1036G>A | p.Val346Met | p.V346M | Q86VN1 | protein_coding | deleterious(0.04) | possibly_damaging(0.646) | TCGA-NH-A5IV-01 | Colorectum | colon adenocarcinoma | Female | >=65 | I/II | Unknown | Unknown | SD | |
| VPS36 | SNV | Missense_Mutation | novel | c.158N>T | p.Lys53Ile | p.K53I | Q86VN1 | protein_coding | tolerated(0.1) | benign(0.09) | TCGA-AG-3726-01 | Colorectum | rectum adenocarcinoma | Female | <65 | I/II | Unknown | Unknown | SD |
| VPS36 | insertion | Frame_Shift_Ins | rs777713470 | c.499_500insA | p.Arg167LysfsTer5 | p.R167Kfs*5 | Q86VN1 | protein_coding | TCGA-DM-A28C-01 | Colorectum | colon adenocarcinoma | Male | >=65 | I/II | Unknown | Unknown | PD | ||
| VPS36 | SNV | Missense_Mutation | novel | c.361N>T | p.Arg121Cys | p.R121C | Q86VN1 | protein_coding | tolerated(0.1) | benign(0.021) | TCGA-A5-A0G1-01 | Endometrium | uterine corpus endometrioid carcinoma | Female | >=65 | I/II | Unknown | Unknown | SD |
| Page: 1 2 3 4 |
Top |
Related drugs of malignant transformation related genes |
| Identification of chemicals and drugs interact with genes involved in malignant transfromation |
| (DGIdb 4.0) |
| Entrez ID | Symbol | Category | Interaction Types | Drug Claim Name | Drug Name | PMIDs |
| Page: 1 |

Copyright 2023-Present -The University of Texas Health Science Center at Houston |