
|
|||||
|
 | |
| |
| |
| |
| |
| |
|
Gene: VPS33A |
Gene summary for VPS33A |
| Gene information | Species | Human | Gene symbol | VPS33A | Gene ID | 65082 |
| Gene name | VPS33A core subunit of CORVET and HOPS complexes | |
| Gene Alias | MPSPS | |
| Cytomap | 12q24.31 | |
| Gene Type | protein-coding | GO ID | GO:0000902 | UniProtAcc | Q96AX1 |
Top |
Malignant transformation analysis |
| Identification of the aberrant gene expression in precancerous and cancerous lesions by comparing the gene expression of stem-like cells in diseased tissues with normal stem cells |
| Entrez ID | Symbol | Replicates | Species | Organ | Tissue | Adj P-value | Log2FC | Malignancy |
| 65082 | VPS33A | C04 | Human | Oral cavity | OSCC | 1.95e-06 | 3.52e-01 | 0.2633 |
| 65082 | VPS33A | C21 | Human | Oral cavity | OSCC | 3.08e-16 | 3.66e-01 | 0.2678 |
| 65082 | VPS33A | C30 | Human | Oral cavity | OSCC | 9.54e-12 | 5.27e-01 | 0.3055 |
| 65082 | VPS33A | C38 | Human | Oral cavity | OSCC | 2.48e-02 | 3.96e-01 | 0.172 |
| 65082 | VPS33A | C43 | Human | Oral cavity | OSCC | 1.75e-03 | 1.44e-01 | 0.1704 |
| 65082 | VPS33A | C46 | Human | Oral cavity | OSCC | 7.93e-08 | 2.45e-01 | 0.1673 |
| 65082 | VPS33A | C08 | Human | Oral cavity | OSCC | 3.22e-08 | 2.32e-01 | 0.1919 |
| 65082 | VPS33A | LN22 | Human | Oral cavity | OSCC | 2.53e-02 | 3.38e-01 | 0.1733 |
| 65082 | VPS33A | LN46 | Human | Oral cavity | OSCC | 4.56e-03 | 1.78e-01 | 0.1666 |
| 65082 | VPS33A | LP15 | Human | Oral cavity | LP | 1.60e-03 | 5.77e-01 | 0.2174 |
| 65082 | VPS33A | SYSMH2 | Human | Oral cavity | OSCC | 2.18e-04 | 1.76e-01 | 0.2326 |
| 65082 | VPS33A | SYSMH3 | Human | Oral cavity | OSCC | 3.30e-09 | 2.21e-01 | 0.2442 |
| Page: 1 |
| Tissue | Expression Dynamics | Abbreviation |
| Oral Cavity | 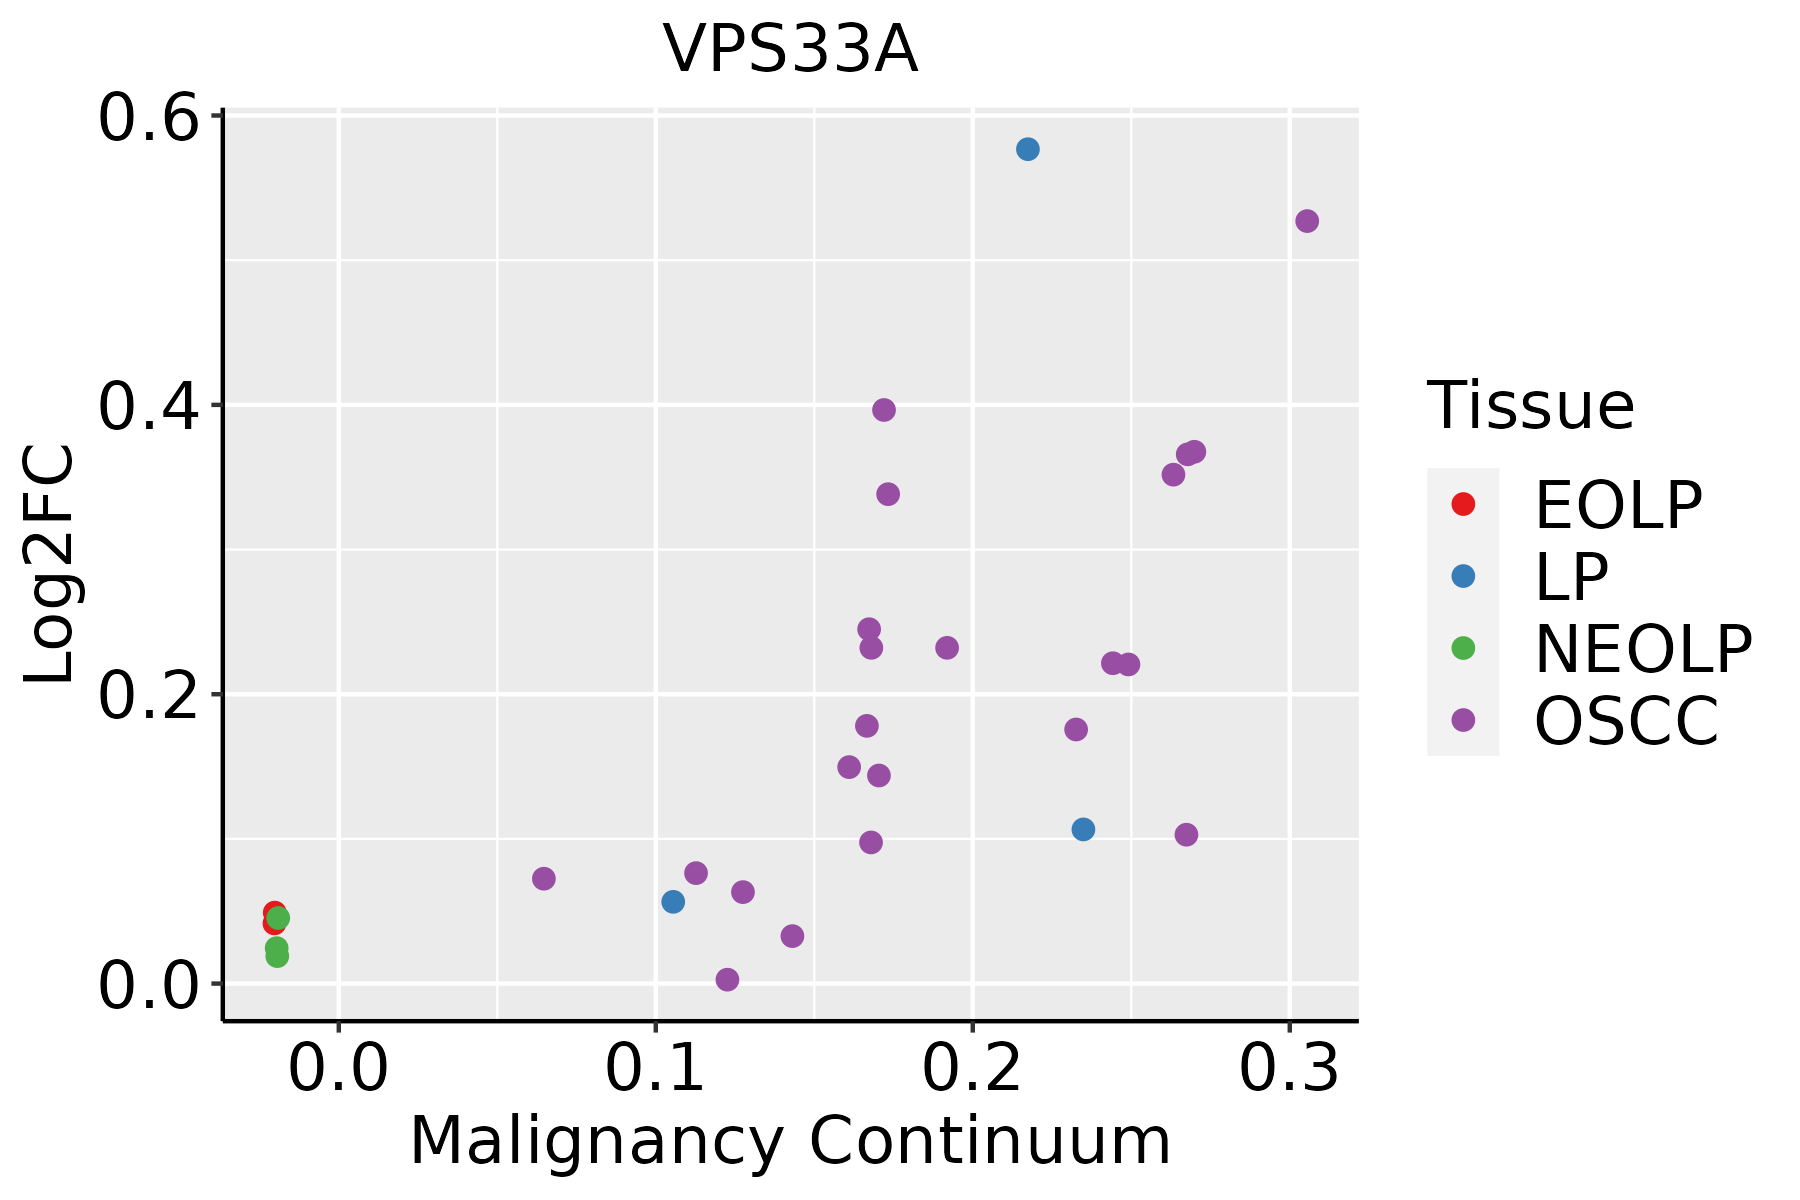 | EOLP: Erosive Oral lichen planus |
| LP: leukoplakia | ||
| NEOLP: Non-erosive oral lichen planus | ||
| OSCC: Oral squamous cell carcinoma |
| ∗log2FC in expression of this searched gene in stem-like cells from each diseased tissue sample relative to stem-like cells in normal samples in each tissue plotted against the malignancy continuum. Samples are colored based on if they are from different disease stage. |
Top |
Malignant transformation related pathway analysis |
| Find out the enriched GO biological processes and KEGG pathways involved in transition from healthy to precancer to cancer |
| Tissue | Disease Stage | Enriched GO biological Processes |
| Colorectum | AD |  |
| Colorectum | SER |  |
| Colorectum | MSS |  |
| Colorectum | MSI-H |  |
| Colorectum | FAP |  |
| ∗Top 15 enriched GO BP terms are showed in the bar plot of each disease state in each tissue. Each row represents a significant GO biological process which is colored according to the -log10(p.adjust). |
| Page: 1 2 3 4 5 6 7 8 9 |
| GO ID | Tissue | Disease Stage | Description | Gene Ratio | Bg Ratio | pvalue | p.adjust | Count |
| GO:002241119 | Oral cavity | OSCC | cellular component disassembly | 283/7305 | 443/18723 | 9.57e-27 | 3.37e-24 | 283 |
| GO:001623610 | Oral cavity | OSCC | macroautophagy | 192/7305 | 291/18723 | 7.01e-21 | 1.14e-18 | 192 |
| GO:00070335 | Oral cavity | OSCC | vacuole organization | 115/7305 | 180/18723 | 1.11e-11 | 4.00e-10 | 115 |
| GO:003009920 | Oral cavity | OSCC | myeloid cell differentiation | 213/7305 | 381/18723 | 1.24e-11 | 4.42e-10 | 213 |
| GO:000703410 | Oral cavity | OSCC | vacuolar transport | 103/7305 | 157/18723 | 1.25e-11 | 4.44e-10 | 103 |
| GO:003298410 | Oral cavity | OSCC | protein-containing complex disassembly | 136/7305 | 224/18723 | 3.42e-11 | 1.13e-09 | 136 |
| GO:00516489 | Oral cavity | OSCC | vesicle localization | 105/7305 | 177/18723 | 3.30e-08 | 6.30e-07 | 105 |
| GO:00070402 | Oral cavity | OSCC | lysosome organization | 51/7305 | 74/18723 | 1.77e-07 | 2.87e-06 | 51 |
| GO:00801712 | Oral cavity | OSCC | lytic vacuole organization | 51/7305 | 74/18723 | 1.77e-07 | 2.87e-06 | 51 |
| GO:00070418 | Oral cavity | OSCC | lysosomal transport | 69/7305 | 114/18723 | 2.62e-06 | 3.26e-05 | 69 |
| GO:00973522 | Oral cavity | OSCC | autophagosome maturation | 28/7305 | 40/18723 | 7.00e-05 | 5.60e-04 | 28 |
| GO:00357512 | Oral cavity | OSCC | regulation of lysosomal lumen pH | 14/7305 | 16/18723 | 9.15e-05 | 6.93e-04 | 14 |
| GO:0033059 | Oral cavity | OSCC | cellular pigmentation | 33/7305 | 53/18723 | 5.11e-04 | 2.98e-03 | 33 |
| GO:00083332 | Oral cavity | OSCC | endosome to lysosome transport | 33/7305 | 55/18723 | 1.30e-03 | 6.46e-03 | 33 |
| GO:001623615 | Oral cavity | LP | macroautophagy | 135/4623 | 291/18723 | 4.71e-16 | 6.70e-14 | 135 |
| GO:0022411110 | Oral cavity | LP | cellular component disassembly | 173/4623 | 443/18723 | 9.97e-12 | 7.44e-10 | 173 |
| GO:000703415 | Oral cavity | LP | vacuolar transport | 74/4623 | 157/18723 | 7.85e-10 | 3.70e-08 | 74 |
| GO:000703313 | Oral cavity | LP | vacuole organization | 79/4623 | 180/18723 | 1.26e-08 | 4.74e-07 | 79 |
| GO:000704114 | Oral cavity | LP | lysosomal transport | 49/4623 | 114/18723 | 1.38e-05 | 2.45e-04 | 49 |
| GO:0030099110 | Oral cavity | LP | myeloid cell differentiation | 130/4623 | 381/18723 | 1.94e-05 | 3.27e-04 | 130 |
| Page: 1 2 |
| Pathway ID | Tissue | Disease Stage | Description | Gene Ratio | Bg Ratio | pvalue | p.adjust | qvalue | Count |
| hsa0513230 | Oral cavity | OSCC | Salmonella infection | 174/3704 | 249/8465 | 2.67e-17 | 1.49e-15 | 7.58e-16 | 174 |
| hsa05132114 | Oral cavity | OSCC | Salmonella infection | 174/3704 | 249/8465 | 2.67e-17 | 1.49e-15 | 7.58e-16 | 174 |
| hsa05132210 | Oral cavity | LP | Salmonella infection | 128/2418 | 249/8465 | 1.17e-14 | 2.79e-13 | 1.80e-13 | 128 |
| hsa0513238 | Oral cavity | LP | Salmonella infection | 128/2418 | 249/8465 | 1.17e-14 | 2.79e-13 | 1.80e-13 | 128 |
| Page: 1 |
Top |
Cell-cell communication analysis |
| Identification of potential cell-cell interactions between two cell types and their ligand-receptor pairs for different disease states |
| Ligand | Receptor | LRpair | Pathway | Tissue | Disease Stage |
| Page: 1 |
Top |
Single-cell gene regulatory network inference analysis |
| Find out the significant the regulons (TFs) and the target genes of each regulon across cell types for different disease states |
| TF | Cell Type | Tissue | Disease Stage | Target Gene | RSS | Regulon Activity |
| ∗The dot plots of a searched regulon are shown for all cell subpopulations in each disease state of each tissue based on the regulon specific score inferred using pySCENIC and by calculating the average expression. |
| Page: 1 |
Top |
Somatic mutation of malignant transformation related genes |
| Annotation of somatic variants for genes involved in malignant transformation |
| Hugo Symbol | Variant Class | Variant Classification | dbSNP RS | HGVSc | HGVSp | HGVSp Short | SWISSPROT | BIOTYPE | SIFT | PolyPhen | Tumor Sample Barcode | Tissue | Histology | Sex | Age | Stage | Therapy Types | Drugs | Outcome |
| VPS33A | SNV | Missense_Mutation | novel | c.1543C>G | p.Leu515Val | p.L515V | Q96AX1 | protein_coding | tolerated(0.08) | probably_damaging(0.982) | TCGA-A7-A6VW-01 | Breast | breast invasive carcinoma | Female | <65 | I/II | Chemotherapy | doxorubicin | CR |
| VPS33A | SNV | Missense_Mutation | c.1777G>C | p.Glu593Gln | p.E593Q | Q96AX1 | protein_coding | deleterious(0.01) | possibly_damaging(0.638) | TCGA-AO-A12D-01 | Breast | breast invasive carcinoma | Female | <65 | I/II | Chemotherapy | cyclophosphamide | SD | |
| VPS33A | SNV | Missense_Mutation | c.1241N>G | p.Ser414Cys | p.S414C | Q96AX1 | protein_coding | tolerated(0.4) | benign(0.092) | TCGA-C8-A1HM-01 | Breast | breast invasive carcinoma | Female | >=65 | I/II | Chemotherapy | doxorubicin | CR | |
| VPS33A | SNV | Missense_Mutation | rs777018517 | c.1411N>T | p.Arg471Cys | p.R471C | Q96AX1 | protein_coding | deleterious(0) | probably_damaging(0.94) | TCGA-D8-A1Y3-01 | Breast | breast invasive carcinoma | Female | <65 | III/IV | Chemotherapy | doxorubicine+cyclophosphamide | SD |
| VPS33A | insertion | Frame_Shift_Ins | novel | c.1390_1391insTACTTGGGGGGCTGAGG | p.Pro464LeufsTer87 | p.P464Lfs*87 | Q96AX1 | protein_coding | TCGA-A8-A07Z-01 | Breast | breast invasive carcinoma | Female | >=65 | I/II | Unspecific | Exemestane | SD | ||
| VPS33A | insertion | Nonsense_Mutation | novel | c.1416_1417insAGGTAGCTCTAAGTCTCTGTATCTATAGGGTTT | p.Leu472_Trp473insArgTerLeuTerValSerValSerIleGlyPhe | p.L472_W473insR*L*VSVSIGF | Q96AX1 | protein_coding | TCGA-A8-A09M-01 | Breast | breast invasive carcinoma | Female | >=65 | III/IV | Chemotherapy | paclitaxel | CR | ||
| VPS33A | insertion | Nonsense_Mutation | novel | c.922_923insCCTAAGAGGAAGCCATCTGTACTACAAATAAAGAAT | p.Gly308delinsAlaTerGluGluAlaIleCysThrThrAsnLysGluCys | p.G308delinsA*EEAICTTNKEC | Q96AX1 | protein_coding | TCGA-AN-A0FX-01 | Breast | breast invasive carcinoma | Female | <65 | I/II | Unknown | Unknown | SD | ||
| VPS33A | insertion | Nonsense_Mutation | novel | c.1441-1_1441insTAAGAACTCGAATCGGATTATTCCCTGAGGGATAGCAGCTTTCA | p.Asn481Ter | p.N481* | Q96AX1 | protein_coding | TCGA-BH-A0AY-01 | Breast | breast invasive carcinoma | Female | <65 | I/II | Chemotherapy | SD | |||
| VPS33A | deletion | Frame_Shift_Del | c.1376delN | p.Gly459AlafsTer86 | p.G459Afs*86 | Q96AX1 | protein_coding | TCGA-BH-A18G-01 | Breast | breast invasive carcinoma | Female | >=65 | I/II | Unknown | Unknown | SD | |||
| VPS33A | SNV | Missense_Mutation | rs150571876 | c.563N>T | p.Thr188Met | p.T188M | Q96AX1 | protein_coding | tolerated(0.09) | possibly_damaging(0.726) | TCGA-2W-A8YY-01 | Cervix | cervical & endocervical cancer | Female | <65 | I/II | Chemotherapy | cisplatin | CR |
| Page: 1 2 3 4 5 6 7 8 |
Top |
Related drugs of malignant transformation related genes |
| Identification of chemicals and drugs interact with genes involved in malignant transfromation |
| (DGIdb 4.0) |
| Entrez ID | Symbol | Category | Interaction Types | Drug Claim Name | Drug Name | PMIDs |
| Page: 1 |

Copyright 2023-Present -The University of Texas Health Science Center at Houston |